INTRODUCTION
Myxosporea are well-known parasites whose taxonomy, phylogeny and life-cycles have been controversial for several decades. Although most of the 1350±known myxosporean species primarily infect fish, some particular species affect platyhelminths, amphibians, reptiles, birds, and possibly even the mammalian Talpa europea (Kent et al. 2001). The interest in this group of parasites has recently increased mainly due to the economic impact of some myxosporoses in fisheries and aquaculture industry (Alvarez-Pellitero and Sitjà-Bobadilla, 1993a; Moran et al. 1999; Kent et al. 2001). One of the most virulent myxosporean species is Enteromyxum scophthalmi Palenzuela, Redondo and Alvarez-Pellitero, 2002. E. scophthalmi infection results in a fatal consumptive syndrome, and is considered the most severe parasitic disease of farmed turbot (Scophthalmus maximus) (Palenzuela et al. 2002). The parasite invades the fish intestine and produces acute enteritis, starvation and, eventually, death. Mortality may reach 100% in affected stocks (Branson et al. 1999). To our knowledge, the disease has not been described in wild fish.
Key aspects of epidemiology, phylogeny, taxonomy, biology, transmission and life-cycles remain unclear for most Myxosporea. Although fish-to-fish transmission has been demonstrated for E. scophthalmi (Redondo et al. 2002) and some data on the characteristics of the parasite life-cycle in the fish host are available (Redondo et al. 2004), there is still a substantial lack of information on host/parasite relationships, particularly those related with the epidemiology of the disease.
Epidemiological investigation is an important component in the process of understanding infectious diseases in aquaculture (Georgiadis et al. 2001). Epidemiology can provide useful information on factors associated with infection that ultimately can be used to control and prevent parasitic diseases. Since no treatment has been proved to be effective for control of turbot enteromyxosis, epidemiological investigation of the mechanisms related with the infection is a prerequisite for the design of successful sanitary programmes. The objective of this observational study was to prospectively investigate, during a 4-year period, the host and environmental factors related with E. scophthalmi infection in turbot stocks from an enzootic farm in North Western Spain, in order to improve the effectiveness of disease prevention and control programmes. The influence of the fish introduction date and origin were analysed in 2 different studies, and 2 subgroups were established in the second study to evaluate the effect of water quality.
MATERIALS AND METHODS
Fish
From 1997 to 2000 a parasitological cohort study was carried out in the ongrowing facilities of a turbot farm in Galicia, North Western Spain. Fish were cultured in a land-based shore site with a pump flow-through seawater supply (37‰ salinity), in 600 litre round tanks at a stocking density of approximately 25 kg/m2. Fish were kept in the hatchery and nursery facilities until weighing 10–20 g, when they were introduced to the ongrowing tanks. The water supply was fine filtered (1 μm mesh) and UV irradiated (25 mJ/cm2) in the hatchery, and coarse sand-filtered (50 μm) in the nursery. As a part of the attempts of the farm to improve the rearing conditions, starting on March 1998, the farm water intake was moved 100 metres further off-shore, outside of the 1 m depth-intermareal zone where the initial intake was placed.
Sampling schedule
On the basis of prior experience in the farm, samplings were programmed to get information on the influence of different factors suspected to be related to the epidemiology of E. scophthalmi infection. The course of the infection and several epidemiological factors were analysed in 4 different cohorts (stocks) in 2 different types of study. The influence of the introduction date was evaluated in 2 fish stocks (A and B) from the same hatchery (H1) and broodstock (Study 1). The influence of the fish origin was analysed in 2 fish stocks (C and D) from different hatcheries (H1 and H2, respectively) and broodstocks, introduced to the ongrowing facilities on the same date (Study 2). In addition, the influence of water filtration was studied in the 2 stocks of Study 2.
Study 1
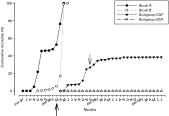
Fish of stocks A and B were introduced to the ongrowing facilities in June and October 97, respectively. A total of 61 fish (stock A) and 148 fish (stock B) were sampled for 6 and 8 months (A and B, respectively), at monthly intervals, starting 6 (A) and 1 (B) month post-introduction (p.i.). The sampling schedule is detailed in Table 1. The change in water intake started 2 months before the last sampling (see Fig. 1).

Fig. 1. Cumulative mortality of turbot from stocks A, B, C (subgroup CUF) and D (subgroup DUF). —[ltrif ] date of water intake improvement/modification. → date of starting of culling of fish from infected tanks due to the farm management measures (removal of symptomatic fish).
Table 1. Details on sampling schedule, temperature (T), prevalence (P), mean intensity (MI) and mean severity of histopathological lesions (MSL) in fish from stocks A and B (n, number of sampled fish.)

Study 2
Fish from stocks C and D were introduced into the facilities at the same date (April 98). Both stocks were divided in 2 subgroups, receiving filtered (CF and DF) and unfiltered (CUF and DUF) water, respectively. Water filtration was carried out using a 50 μm-pore sand filter. A total of 324 fish (stock C) and 312 fish (stock D) were followed for 14 and 20 months, respectively, at monthly intervals starting from their introduction. Sampling details are summarized in Table 2.
Table 2. Details on sampling schedule, temperature (T), prevalence (P), mean intensity (MI) and mean severity of histopathological lesions (MSL) in fish from stocks C and D, kept in filtered (FW) and unfiltered (UFW) water (n, number of sampled fish.)

Sampling and histological processing
Turbot were sacrificed by chilling on ice and spinal cord severance or by overexposure to the anaesthetic MS-222 (Sigma, St Louis MO, USA), and bled from the caudal vein before the necropsies. Fish were weighed, measured and necropsied, and their organs excised for fresh and histological examination for parasites. Samples of the digestive tract (oesophagus, stomach, anterior, medium and posterior parts of the intestine), spleen, kidney, gills, skin/muscle, liver and gall bladder were fixed in 10% neutral buffered formalin.
For histological study, fixed tissue samples were embedded in paraffin or Technovit-7100 resin (Kulzer, Heraeus). Paraffin sections (4–5 μm) were stained with haematoxylin-eosin, Giemsa, Ziehl-Nielsen or PAS staining, and resin sections (1–3 μm) with toluidine blue, Giemsa or PAS staining.
Infection intensity was evaluated in the histological sections following a scale of 1+ to 3+, according to the number of parasite stages present in microscope fields at 300×magnification. Fish were considered infected when the parasite was detected in histological sections of any part of the digestive tract, the target organ. The presence and severity of pathological lesions typical of the disease were also evaluated in the sections and classified as: absent (0), minor (1), moderate (2), and severe (3). Mortality was registered daily for each stock and monthly cumulative percentages of dead fish were calculated.
Prevalence, abundance and mean intensity (sensu Bush et al. 1997) were calculated for each sampled group. Monthly prevalence and mean intensities were analysed for all sampled stocks to evaluate the evolution of the infection.
Statistical analysis
Seasonal variations were analysed for stocks B (study 1) and C (study 2). As data were not expected to adjust to a normal distribution, the non-parametric Kruskall-Wallis One way Analysis of Variance on Ranks was used to detect possible differences of infection abundance among seasons. Dunn's Method was used to correct for differences in the number of animals per group. In addition, the rates of change in abundance of infection per season was investigated using the regression function (linear, exponential, sigmoid, Gaussian polynomial and logarithmic) that best fitted the data as estimated by the highest R2 value. These statistical analyses were performed with SigmaStat software (SPSS Inc., Chicago, Ill.).
In Study 2, the association between E. scophthalmi infection and water filtering was investigated using a corrected odds ratio test (Mehta et al. 1985) for stocks C and D. The weights of E. scophthalmi-infected and non-infected CUF fish were compared using a Mann-Whitney test. The test was performed using the Stat Calc extension of EpiInfo v. 3.3 (Center for Diseases Control, 2004, www.cdc.gov/epiinfo/) and SPSS 12.0.1 (SPSS inc 1989–2003, www.spss.com). Differences in infection abundance between different fish weight-groups and the rate of association between infection abundance and fish weight were analysed as explained for the study of season influence. In order to study the dispersion pattern and the age (weight)-intensity profile of E. scophthalmi in C turbot, the variance to mean ratio (VMR) was calculated for the total sampled fish and for each weight class. In addition, the frequency distribution of the parasite within the sampled hosts was obtained.
RESULTS
Infection progress in cultures
Study 1, Stock A
In the first sampling, 6 months p.i. in the ongrowing tanks, all fish were already parasitized in the intestine and stomach. Prevalence was high throughout the study, whereas intensity was high for December to February and decreased slightly further on. The severity of histopathological lesions varied according to the infection intensity and was higher in the first 3 samplings than in the remaining ones, probably due to mortality of highly infected fish (Table 1). Mortality started in September 1997, 3 months after introduction. An increase in mortality occurred in October–November 1997, followed by a plateau from November 1997 to February 1998, and a subsequent rise in April 1998. The cumulative mortality was 100% by May 1998 (Fig. 1).
Study 1, Stock B
The earliest parasite detection in the fish intestine occurred in January 1998, about 3 months p.i. Both prevalence and intensity remained relatively low at the next 2 samplings. Prevalence increased in April (6 months p.i.) and reached 100% in the 3 subsequent samplings, with a moderate to high infection intensity. Only immature parasites were detected in the first findings, but maturation progressed further and sporoblasts were more frequent in the last samplings. The mean severity of histopathological lesions tended to increase along the samplings, in parallel with the rise of infection intensity (Table 1). Mortality rose very slightly during the first 6 months after introduction in the ongrowing tanks. However, the rapid increase registered in spring resulted in a 100% cumulative mortality by June 1998 (Fig. 1).
Study 2
Stock C. subgroup CF (filtered water)
The parasite was never found in fish of this subgroup during the 13 months of study (Table 2). No mortality was recorded.
Stock C. subgroup CUF (unfiltered water)
The first detection of the parasite occurred in July 1998 (3 months p.i.) (Table 2). Both prevalence and intensity increased slightly in August–September, and rapidly in October (80%). Prevalence was high until the last sampling in February 1999, except for an intermediate level recorded in December (50%). In this group, parasite maturation occurred earlier than in group B, as sporoblasts and spores started to appear 4 months p.i. The mean severity of histopathological lesions in infected fish followed approximately the increasing pattern of infection intensity and prevalence from July to November 1998, and a slight decrease occurred from December 1998 to February 1999 (Table 2). Mortality started in June, 3 months p.i. and 1 month before the first detection of the parasite (Fig. 1). No further mortality was registered during the summer, but a new increase occurred from October 1998 to February 2000. Cumulative mortality remained around 40% in the following months, as fish from infected tanks were culled due to the farm management measures (removal of symptomatic fish).
Stock D. Subgroup DF (filtered water)
As in group CF, fish of this stock were never found infected during the studied period (13 months) (Table 2).
Stock D. Subgroup DUF (unfiltered water)
The progression of infection in this subgroup was completely different from the evolution of infection observed in group CUF (Table 2). Note that, as both groups were reared on the same farm, with the same unfiltered water, and introduced on the same date, the only difference between these two groups was the previous origin (hatchery and broodstock). Fish were not found infected until August 1999 (16 months p.i.), with 75% prevalence and low intensity. One month later, prevalence decreased to 50%, but both the infection intensity and the mean severity of histopathological lesions increased. In the last 2 samplings no fish was found to be parasitized (Table 2). No mortality was registered in fish of stock D (Fig. 1).
Analysis of the distribution of E. scophthalmi in turbot cultures
Influence of water quality (Study 2. Stocks C and D)
A clear influence of the water quality on the infection was observed, as fish reared in filtered water were never found parasitized. The proportion of infected fish obtained from tanks receiving filtered water (0/195) was significantly lower (OR: 0, CI 95%: 0–0·07; P<0·001) than the proportion of infected fish obtained from tanks with unfiltered water (102/440). Thus, the risk of infection was significantly (P<0·001) reduced by filtering the water.
Season effect (Studies 1 and 2. Stock B and subgroup CUF)
In stock B, no fish was found parasitized in autumn. Prevalence, intensity and abundance were low in winter and increased later, reaching a maximum in spring/summer, although abundance and intensity were slightly lower in summer than in spring (Fig. 2). The relationship between abundance and season fitted a polynomial regression (R2=0·7632, P<0·0001). Spring abundance value was significantly higher than the corresponding winter value (P<0·05).

Fig. 2. Non-linear regression adjustment of Enteromyxum scophthalmi abundance (white bars) versus season in turbot, in stocks B (R2=0·7632, P=0·001) and CUF (R2=0·991, P=0·05). Graphs are presented to show coincidence in time. Different letters above each abundance bar indicate statistical significance with the Kruskall-Wallis One way Analysis of Variance on Ranks, followed by Dunn's method (P<0·05). Grey bars represent infection prevalence. Numbers inside prevalence bars indicate the mean intensity of infection.
In CUF fish, the parasite was not found in spring, whereas prevalence, intensity and abundance were low in summer and peaked in autumn and winter (Fig. 2). The relationship between abundance and season best fitted a sigmoid curve (R2=0·991, P<0·0001). Abundance was significantly higher in autumn and winter than in spring and summer (P<0·05).
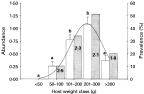
Fish weight effect (Study 2, subgroup CUF)
In the overall analysis, the median weight of E. scophthalmi infected fish (153 g) was significantly higher (P<0·01, Mann-Whitney U=13234·0) than the median weight (44 g) of non-infected fish. Fig. 3 shows the distribution of E. scophthalmi infection according to fish weight classes. Prevalence, intensity and abundance showed a convex profile. Abundance best fitted a Gaussian function (R2=0·992, P<0·0001). Fish weighing less than 50 g were not found parasitized, and the highest prevalence was recorded in the 201–300 g fish class, with infection levels subsequently decreasing in animals larger than 300 g. Abundance followed approximately the same pattern as prevalence and values in the central weight classes (101–200 g and 201–300 g) were significantly higher than those of the other classes (P<0·05). Mean intensity decreased from the second (50–100 g) to the highest (>300 g) weight class. Fig. 4 shows the VMR for each weight class. The VMR increased suddenly in the second weight class reaching its peak, and then decreased in the subsequent weight classes, although it recuperated slightly in the heaviest fish.

Fig. 3. Non-linear regression adjustment of Enteromyxum scophthalmi abundance (white bars) vs weight class in turbot, subgroup CUF (R2=0·9876, P=0·0124). Different letters above each abundance bar indicate statistical significance with the Kruskall-Wallis One way Analysis of Variance on Ranks, followed by Dunn's method (P<0·05). Grey bars represent infection prevalence. Numbers inside prevalence bars indicate the mean intensity of infection.

Fig. 4. Percentage of fish showing different degrees of severity of histopathological lesions in turbot, subgroup CUF.
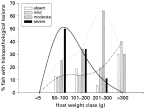
The percentage of infected fish showing different severity of histopathological lesions varied according to the weight class (Fig. 5). The proportion of fish with severe lesions peaked in the second weight class (50–100 g) and decreased progressively in larger fish. Accordingly, the curve was ascendant for fish with mild severe lesions. The percentage of fish with moderate lesions increased progressively with the weight class peaking for 201–300 g fish, with a subsequent decrease in the largest fish.

Fig. 5. Dispersion of Enteromyxum scophthalmi in turbot from C and D stocks without filtration (subgroups CUF and DUF), expressed as the VMR in relation to host weight.
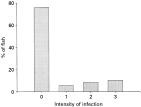
Dispersion pattern (Study 2, subgroup CUF)
Pattern distribution data had a variance clearly higher than the mean (overdispersed), with aggregation in the null intensity (absence of the parasite) (Fig. 6). The VMR was 1·947.

Fig. 6. Frequency distribution of Enteromyxum scophthalmi in turbot from C and D stocks without filtration (subgroups CUF and DUF). Variance was clearly higher than the mean (VMR=1·947) (overdispersion), with aggregation in the null intensity.
DISCUSSION
Different studies, groups and subgroups were established to analyse the influence of certain culture conditions on the epidemiology of the myxozoan E. scophthalmi in farmed turbot. The study of several stocks of different origins, reared under different conditions after introduction to the ongrowing tanks in diverse periods of the year, allowed us to demonstrate the influence of several risk factors on the onset and progression of E. scophthalmi infections.
Water filtration was estimated to be significantly associated with the presence of the parasite in turbot cultures. Fish reared with filtered water were never found to be parasitized, in contrast with animals of the same stocks maintained in unfiltered water, so the risk of infection was at least 14 times lower in fish receiving filtered water than in those maintained in unfiltered water.
Although the complete life-cycle of E. scophthalmi is still unknown, its direct fish-to-fish transmission has been demonstrated in experiments of cohabitation of infected and non-infected fish, through waterborne contamination with the effluent from an infected tank, and orally using scrapings of parasite-infected tissues (Redondo et al. 2002). Thus, infected fish are considered the main source of myxosporean stages capable of infecting new fish, and the release of parasite stages occurs mainly when fish are severely parasitized, but it can start before external symptoms and mortality appear. Nevertheless, we cannot disregard the existence of a hypothetical alternate cycle in invertebrate hosts and the entrance of putative infective actinospores (Redondo et al. 2002, 2004). The finding of some PCR-positive samples in invertebrates collected in areas in close proximity to the water pumping sites and distribution channels within the farm (authors' unpublished observations) needs confirmation.
Whatever the infective stage is, the main route of entry to the farms seems to be the water supply, as demonstrated by the results obtained herein considering that infection was prevented by filtration. Furthermore, the parasite was never found in the hatchery or nursery facilities of the same farm, which received fine or coarse filtered water respectively, in studies carried out during the first 2 years of the current investigation. The influence of water quality is also supported by the observations in stocks C and D, introduced in the ongrowing tanks after the improvement of the farm water intake. The progress of the disease in these stocks was slower than in stocks A and B which did not receive the improved supply until 10 and 6 months of their introduction, respectively. In addition, mortality in stock C was clearly lower than that of stocks A and B, and no mortality was observed in stock D. The efficacy of sand water filtration to avoid the entrance of infective stages of different Myxozoa has been assessed with certain success (Nehring et al. 2003; Arndt and Wagner, 2004). Although the use of sand filtration in turbot farms as a routine prophylactic measure is not feasible due to the large water volumes involved, the improvement of water quality by modifications of the intake can contribute to keep the infection at low levels.
Fish origin and stock also had an influence on the infection, as demonstrated by the different results obtained for subgroups CUF and DUF. Their total prevalences were 41·7 and 3·6%, respectively, in spite of have being introduced at the same date and reared under the same conditions. A tank-bias effect is very improbable (according to the farm experience, no tank–bias effect had been detected before in replicate tanks) and the existence of genetically based differences in susceptibility (as both stocks came from different broodstock) needs further investigation.
Once the infection is established in the farm, its fast progression is probably due to the release of parasite stages into the water by parasitized fish (Redondo et al. 2002) as such stages are able to infect other fish. This observation may explain the progressive increase of the prevalence, intensity and severity of lesions observed in our study. The parasite was not detected in the digestive tract until the fish had spent a minimum of 3 months in the ongrowing facilities. However, blood stages have been previously found as soon as 1 month after introduction in some turbot exposed to enzootic waters (Redondo et al. 2004), long before the detection of histopathological lesions and symptoms of enteromyxosis. Thus, a relatively long pre-patent period is characteristic of this myxosporosis. The duration of the pre-patent period varied with the introduction date, as deduced from the comparison of stocks from the same (A vs B) or different (CUF vs B) origins, introduced at different dates. The progression of the infection was initially faster in fish from stock A and subgroup CUF than in stock B, probably due to the seasonal variations of water temperature, as stocks A and C were introduced in summer (June) or spring (April), respectively, and stock B in autumn (October). The faster progression of E. scophthalmi infection with increasing temperatures has been demonstrated under experimental laboratory and farm conditions (Redondo et al. 2002; authors' unpublished observations). An extended pre-patent period and a significant influence of temperature on the onset and progression of myxozoan infections after exposure to enzootic waters have been widely reported (Bartholomew et al. 1989; McGeorge et al. 1996; Moran and Kent, 1999).
Seasonal fluctuations have been observed for several myxosporoses (Bartholomew et al. 1989; Alvarez-Pellitero and Sitjà-Bobadilla, 1993b; Sitjà-Bobadilla and Alvarez-Pellitero, 1993; McGeorge et al. 1996), although no clear seasonal patterns have been found for some species (Palenzuela et al. 1997, 1999). Temperature has been considered a major factor in parasitoses seasonality, although other ecological and host ethological factors cannot be disregarded. In this study, a seasonal distribution was seen in all stocks, with maximum in spring/summer for fish introduced in October, and autumn/winter for fish introduced in April. Besides the influence of temperature, this pattern is most likely affected by the progressive accumulation of infective stages with time once the infection has started (as infected fish become donors of infective material), and is reflected in the non-linear regression profiles of infection abundance vs season. Thus, the availability and kind of infective stages responsible for the onset of the infections also play a role, as it has been suggested for other myxosporeans (Palenzuela et al. 1997; Foott et al. 2004). Some E. scophthalmi initial stages were found in blood and gills in stock B fish soon after introduction into the system. These stages were morphologically different from those observed in experimental infections by cohabitation (Redondo et al. 2004), so they could possibly proceed from hypothetical actinosporean stages, not yet demonstrated. In such a case, it seems that the time necessary for their development is quite long, as typical intestinal stages were not found until 3 months later.
An influence of fish weight on E. leei infections can be deduced from the studies presented here. The overall analysis demonstrated that larger fish were more frequently infected than smaller fish. Infection intensity varied slightly between the 5 different weight classes, whereas prevalence had a clear peak in the 201–300 g class followed by a decrease in the largest fish. Such distribution coincides with the size/age-dependent convex profile, as described for different parasites, including myxosporeans (Alvarez-Pellitero and Sitjà-Bobadilla, 1993b; Su and White, 1996; Palenzuela et al. 1999; Gbankoto et al. 2003).
Biological, ecological and immunological factors may affect the host age distribution and dispersion patterns, as the age-dependent exposure or the density-dependent parasite establishment (Duerr et al. 2003). The dispersion pattern of E. scophthlami corresponds to that of an overdispersed parasite distribution, with VMR=1·947 and a clearly aggregated frequency distribution. This is the model described for the great majority of parasites (Shaw et al. 1998), and differences in parasite infectivity or host susceptibility may partly explain it. When expressed in relation to host weight classes, VMR followed approximately the convex profile usually found in parasite distribution, except for a slight rise that occurred in the largest weight class. VMR was higher than 1 in all turbot size classes, but it was generally lower than the combined VMR, except for the 201–300 g weight class that showed the maximum value (2·5). Therefore, although host weight contributes to E. scophthalmi aggregation, the overall interpretation of its dispersion pattern is difficult due to the superposition of different processes (Duerr et al. 2003). The fact that the distribution is still aggregated within a given weight class demonstrates that there are other transmission factors implicated in aggregation, as described for helminths of yellow perch (Zelmer and Arai, 1998). The differential availability of E. scophthalmi infective stages (an accumulative process influenced by temperature), leading to certain heterogeneity in exposure, could contribute to modify slightly the typical convex profile (Duerr et al. 2003). After the introduction of the parasite to the tanks, the high stocking density typical of farming systems also plays an important role, as host population density is one of the factors involved in transmission rates of parasites (Arneberg et al. 1998). The decrease of prevalence, intensity and abundance in the highest weight class is probably due to the effect of mortality and/or acquired immunity, usually leading to a convex profile. In fact, most fatalities occurred in the anterior weight class (201–300 g) and surviving fish must be those non-infected or having overcome the infection. As a matter of fact, the influence of infection in different immune factors and the existence of specific antibodies in long-term-exposed fish have been demonstrated (Sitjà-Bobadilla et al. 2004, 2006).
The results of this study can be affected by biases inherent to any observational study, as our analysis was based on the comparison of disease occurrence and exposure to risk factors in groups of individuals living in natural (field) conditions. Thus, risk factors and/or disease status cannot be randomly allocated to individuals, as can be achieved with experimental studies (Thrusfield, 1999). Despite these drawbacks, observational studies allow us to monitor the disease in a natural frame, and are more cost-effective in the primary screening of several potential risk factors associated with the disease, and usually more realistic, than most experimental designs. Therefore, observational studies are useful tools in providing information on disease epidemiology in the field and they are a valuable complement to descriptive studies of relatively new or scarcely described diseases like this enteromyxosis. Based on the findings presented in the current study, further investigation of E. scophtalmi epidemiology in the field should include estimates of transmission rate, multivariate analysis of risk factors and risk analysis of introduction in free facilities.
In conclusion, the results obtained support the hypothesis that E. scophthalmi enters the ongrowing systems through the water supply. Once introduced into the system, exposure to the parasite increases with time and host weight (in part due to the fish-to-fish transmission within the tanks). Consequently, preventive measures should take into account these two main risk factors. The avoidance of introduction and accumulation of parasites in culture tanks is essential for the farm management. Such measures should include water filtration in the first steps of the fish production cycle, and monitoring of stocks using high-throughput non-invasive methods, such as PCR testing (authors' unpublished observations) which allows fast and reliable detection of the parasite. Different factors are involved in the aggregated parasite distribution. Host age and density, parasite-induced host mortality and acquired immunity, as well as the availability and concentration of infective stages are among these factors.
Funding for this study was provided by the EU and the Spanish Ministerio de Ciencia y Tecnología through research grants FEDER 1FD97-0679-C02-01 and AGL2001-2241-C02-01. Additional support was obtained from Stolt Sea Farm S. A. We are grateful to J. Monfort from IATS and C. M. Carreira from the School of Veterinary Medicine of Lugo for histological processing.