


Introduction
Leishmaniasis is caused by the digenetic parasite Leishmania which are flagellated promastigotes within the sandfly vector and aflagellated amastigotes within susceptible host macrophages (Sunter and Gull, Reference Sunter and Gull2017; Bates, Reference Bates2018). Leishmaniasis has a diverse disease spectrum that ranges from a self-limiting cutaneous lesion to the fatal form of visceral leishmaniasis (VL), while has a dermal sequel, post kala-azar dermal leishmaniasis (PKDL; Chappuis et al., Reference Chappuis, Sundar, Hailu, Ghalib, Rijal, Peeling, Alvar and Boelaert2007; Zijlstra et al., Reference Zijlstra, Alves, Rijal, Arana and Alvar2017; Gedda et al., Reference Gedda, Singh, Kumar, Singh, Madhukar, Upadhyay, Singh and Sundar2020). The study of human leishmaniasis is facilitated using Syrian golden hamsters as it shares pathological features and immunological responses comparable with humans (Melby et al., Reference Melby, Chandrasekar, Zhao and Coe2001; Garg and Dube, Reference Garg and Dube2006; Saini and Rai, Reference Saini and Rai2020; Moulik et al., Reference Moulik, Karmakar, Joshi, Dube, Mandal and Chatterjee2021a).
Animal models are an invaluable resource to screen for potential anti-leishmanials using in vivo/ex vivo approaches (Vermeersch et al., Reference Vermeersch, da Luz, Toté, Timmermans, Cos and Maes2009). Generally, the initial screening is in Leishmania-infected macrophages and the number of amastigotes in host cells is a direct measure of drug activity (Escobar et al., Reference Escobar, Matu, Marques and Croft2002; Yardley et al., Reference Yardley, Croft, De Doncker, Dujardin, Koirala, Rijal, Miranda, Llanos-Cuentas and Chappuis2005). This requires microscopic counting and being a subjective approach, is susceptible to operator bias. To obviate this subjectivity, molecular approaches are the need of the hour and preferably those that can identify amastigotes.
A molecular target should have high abundance and this criterion is best achieved by kinetoplast mini-circle DNA (kDNA), present as 1000 copies per cell in all Leishmania spp. (Salotra et al., Reference Salotra, Sreenivas, Pogue, Lee, Nakhasi, Ramesh and Negi2001; Mary et al., Reference Mary, Faraut, Lascombe and Dumon2004). In fact, the kDNA-based qPCR or real-time PCR has stood the test of time in determining parasite load (Mary et al., Reference Mary, Faraut, Drogoul, Xeridat, Schleinitz, Cuisenier and Dumon2006; Verma et al., Reference Verma, Kumar, Katara, Singh, Negi, Ramesh and Salotra2010; Sudarshan et al., Reference Sudarshan, Weirather, Wilson and Sundar2011; Abbasi et al., Reference Abbasi, Aramin, Hailu, Shiferaw, Kassahun, Belay, Jaffe and Warburg2013; Hossain et al., Reference Hossain, Ghosh, Khan, Duthie, Vallur, Picone, Howard, Reed and Mondal2017; Moulik et al., Reference Moulik, Chaudhuri, Sardar, Ghosh, Saha, Das and Chatterjee2018, Reference Moulik, Sengupta and Chatterjee2021b). However, for ex vivo drug screening, there is no assay that can selectively detect amastigotes, reflecting the need to further optimize molecular methods of detection.
In terms of amastigote-specific genes, the most well studied is the A2 gene family first identified in L. donovani amastigotes translating into a family of A2 proteins ranging from 45 to 100 kDa (Charest and Matlashewski, Reference Charest and Matlashewski1994; Avishek et al., Reference Avishek, Ahuja, Pradhan, Gannavaram, Selvapandiyan, Nakhasi and Salotra2018). The A2 protein is also expressed at high levels in axenic amastigotes (Matlashewski, Reference Matlashewski2001). Another important amastigote-specific gene is amastin present as a surface protein (Johnston et al., Reference Johnston, Blaxter, Degrave, Foster, Ivens and Melville1999). It contains a unique, highly conserved 11-amino acid signature at the N terminus. The presence of amastin has been reported in Trypanosoma cruzi (McCall and Matlashewski, Reference McCall and Matlashewski2010) and Leishmania infantum amastigotes (Rochette et al., Reference Rochette, McNicoll, Girard, Breton, Leblanc, Bergeron and Papadopoulou2005). The latex agglutination test (LAT), a rapid diagnostic test for detection of anti-Leishmania antibodies, utilizes the A2 antigen and exhibited accuracy comparable to direct agglutination test (Akhoundi et al., Reference Akhoundi, Mohebali, Shojaee, Jalali, Kazemi, Bandehpour, Keshavarz, Edrissian, Eslami, Malekafzali and Kouchaki2013). The amastigote-derived A2 protein has also been investigated for antibody responses in India, Sudan and South America with variable sensitivities (Carvalho et al., Reference Carvalho, Charest, Tavares, Matlashewski, Valente, Rabello, Gazzinelli and Fernandes2002). Similarly, amastin peptides have been employed for the serodiagnosis of active VL (Rafati et al., Reference Rafati, Hassani, Taslimi, Movassagh, Rochette and Papadopoulou2006).
The droplet digital polymerase chain reaction (ddPCR) detects samples with a low copy number of the target nucleic acid and additionally allows direct quantification without the need for a standard curve (Belmonte et al., Reference Belmonte, Martin, Frescura, Damas, Pereira, Tarnopolsky and Kaufman2016). The traditional qPCR uses an analogue approach as it quantifies samples by comparing their cycle threshold (Ct) to a standard curve generated by well-defined samples. However, development of such a standard curve for detection of amastigotes is challenging as they are present within host macrophages and it is not feasible to quantify the exact burden of amastigotes per macrophage. The advent of the analytical ddPCR assay and it not requiring a standard curve makes it a value addition in the field of nucleic acid quantification (Gobert et al., Reference Gobert, Cotillard, Fourmestraux, Pruvost, Miguet and Boyer2018). The principle for ddPCR is based on the reaction mixture being divided into hundreds to millions of partitions (droplets in oil emulsion), and each droplet being capable of initiating an independent PCR reaction. At the end-point, the partitions are scored as positive or negative and these values are used to calculate the target concentration using binomial Poisson statistics (Pinheiro et al., Reference Pinheiro, Coleman, Hindson, Herrmann, Hindson, Bhat and Emslie2012). Using statistical software, the target gene copy number is automatically determined based on the number of droplets positive for amplification of the target nucleic acid (Cai et al., Reference Cai, Li, Lv, Yang, Li, He and Pan2014; Floren et al., Reference Floren, Wiedemann, Brenig, Schütz and Beck2015). In view of limited molecular assays to quantify the disease burden in terms of amastigotes, this study aimed to develop a ddPCR-based semi-automated approach for quantifying the expression of amastigote-specific genes A2 and amastin adaptable for parasitological detection in (i) drug screening assays and (ii) PKDL.
Materials and methods
Reagents
All reagents were of analytical grade and obtained from Bio-Rad Laboratories (Hercules, CA, USA) and Sigma-Aldrich (St. Louis, MO, USA), except cDNA Reverse Transcription kit and SYBR Green Quantitative PCR (qPCR) Master Mix from Applied Biosystems (Grand Island, NY, USA), Trizol reagent and RNALater (Ambion, Austin, TX, USA) and fetal bovine serum (FBS, Gibco, Thermo Fischer Scientific, Waltham, MA, USA).
Parasite culture
Leishmania donovani (MHOM/IN/1983/AG83) promastigotes were maintained at 24°C in M199 medium supplemented with 10% heat-inactivated FBS, penicillin G (50 IU mL−1) and streptomycin (50 μg mL−1); parasites were sub-cultured every 48–72 h, inoculum being 1 × 10⁶ cells mL−1.
Experimental models of visceral leishmaniasis
Hepatic and splenic tissues were obtained from L. donovani-infected male golden hamsters (Mesocricetus auratus, 45–50 g, n = 10) maintained in the Division of Parasitology, Central Drug Research Institute (CDRI), Lucknow, India, and kindly provided by Dr Anuradha Dube, CDRI, Lucknow. Tissue samples were stored in RNALater at −80°C.
Peritoneal macrophages were isolated from male/female Swiss albino mice (6–10 weeks old, 20–25 g) housed in the animal facility, IPGME&R, Kolkata, India under controlled temperature (22 ± 5°C), humidity (60 ± 5%) and a 12 h light/dark cycle. Stationary 5–7 days old promastigote cultures were used for ex vivo infection. Briefly, following an IP administration of 10–15 mL chilled phosphate-buffered saline (0.02 m phosphate, pH 7.2, PBS), the peritoneal exudate was aspirated and resuspended in RPMI medium (Phenol Red+) supplemented with 10% FBS, penicillin G (50 IU mL−1) and streptomycin (50 μg mL−1).
The peritoneal exudate was seeded (~2 × 10⁶ mL−1) in 12-well plates; following an overnight incubation (37°C, 5% CO2), the non-adherent cells were removed and adherent macrophages infected with stationary phase promastigotes at a multiplicity of infection of 10:1 (parasite: macrophage) for 48 h (Karmakar et al., Reference Karmakar, Roy and Mandal2019). Subsequently, anti-leishmanials, miltefosine (HePC, 0–5 μ m) or amphotericin B (AmphoB, 0–50 nm) were added and after an additional 48 h, the cells were recovered by gentle scraping, and the cell pellets stored in RNALater at −80°C. Alongside, infected peritoneal macrophages with and without drug treatments were stained with Giemsa and independently examined in a blinded manner under a bright-field light microscope (EVOS FL Cell Imaging System, Waltham, MA, USA), the % infectivity and number of intracellular amastigotes was counted in at least 100 macrophages/slide.
Study population
Patients with a clinical diagnosis of PKDL (n = 10) were recruited either from Dermatology Outpatient Departments of School of Tropical Medicine/Calcutta Medical College/IPGME&R, Kolkata or from active field surveys conducted in endemic districts of West Bengal (Malda, Dakshin Dinajpur, Murshidabad and Birbhum) by a camp approach, using standard case definitions and defined risk factors, for example, living in an endemic area and having an epidemiological link (past history of VL). The diagnosis of PKDL was primarily based on clinical features and a history of VL, rK-39 strip test positivity and/or confirmed by demonstration of LD bodies by Giemsa staining, and/or ITS-1 PCR (Sengupta et al., Reference Sengupta, Chaudhuri, Moulik, Ghosh, Saha, Das and Chatterjee2019). Informed consent was taken for a 4 mm punch biopsy. Cases with hypopigmented macules were considered as macular PKDL, whereas an assortment of papules, nodules, macules and/or plaques was termed as polymorphic PKDL. None suffered from any co-infection or pre-existing disease, and pregnant women were excluded. Samples were collected at disease presentation. For controls, skin biopsies (n = 10) from foreskin of males undergoing voluntary circumcision were obtained. Dermal biopsies were stored in RNALater at −80°C.
Optimization and determination of copy number of target genes using droplet digital PCR
The assay was performed using total RNA isolated by the Trizol method from Leishmania-infected murine peritoneal macrophages, hepatic or splenic tissues from hamsters (n = 10) and dermal biopsies of patients with PKDL (n = 10). The concentration of RNA was measured in NanodropTM One/OneC Microvolume UV-Vis Spectrophotometer (Thermo Fischer Scientific, MA, USA) and converted to single-stranded cDNA using the High-Capacity cDNA Reverse Transcription Kit (Applied Biosystems™, MA, USA), according to the manufacturer's instructions. The final concentration of prepared cDNA was 1 μg (for a 20 μL reaction) and detection of amplicons was done using primers (sourced from NCBI Primer – BLAST, https://www.ncbi.nlm.nih.gov/tools/primer-blast) whose specificity was confirmed by UCSC In-Silico PCR for amastigote-specific genes A2 (F, 5′-CTGCAGGCTGTTGACGTTTC-3′; R, 5′-AAGGTTTGCCTCGTCACCAT-3′) and amastin (F, 5′-GTGCATCGTGTTCATGTTCC-3′; R, 5′GGGCGGTAGTCGTAATTGTT-3′). Absolute quantification was performed by ddPCR using primers for A2 and amastin, and expression determined as copies per μL using QuantaSoft software (version 1.7.4, Bio-Rad Laboratories).
Briefly, the optimized reaction mixture containing cDNA (50 ng) was added to a ddPCR EvaGreen Supermix (Bio-Rad Laboratories, CA, USA) containing 100 nm mL−1 of each forward and reverse primer, final volume being 20 μL. For negative controls (NC), 10 μL nuclease-free water was added along with 10 μL of ddPCR Eva Green Super mix, and in case of non-template control (NTC), nuclease-free water was used instead of cDNA. Each reaction was then loaded into a sample well of an 8-well disposable cartridge (DG8), along with 70 μL of droplet generation oil. Droplets were formed using QX200 droplet generators which were then transferred to a 96-well PCR plate to perform PCR of 40 cycles at 95°C for 5 min, 95°C for 30 s, annealing (58–62°C) for 1 min, with a final extension at 90°C for 5 min. In ddPCR, the reaction mixture is partitioned into tens of thousands of droplets, with each droplet being an independent PCR reaction. The target template copy number is determined based on the number of droplets positive for amplification of the target template and these values help to calculate the target concentration using binomial Poisson statistics (Pinheiro et al., Reference Pinheiro, Coleman, Hindson, Herrmann, Hindson, Bhat and Emslie2012). The resultant products were scanned on a QX200 Droplet Reader, and data analysed using QuantaSoft software (version 1.7.4, Bio-Rad Laboratories; Dighal et al., Reference Dighal, Mukhopadhyay, Sengupta, Moulik, Mukherjee, Roy, Chaudhuri, Das and Chatterjee2020) and expressed as copies per μL with confidence intervals of 95%. The threshold was adjusted based on clear demarcation of positive droplets from the negative cluster with respect to individual wells (Supplementary Fig. S1). The background signals were eliminated using an NC and NTC.
Optimization of ddPCR reaction conditions was performed with (a) varying amounts of target cDNA obtained from infected liver and splenic tissues of hamsters (12.5–100 ng), (b) annealing temperature (58–62°C) and (c) primer concentration (100–500 nm mL−1). The optimal expression of 6.0 and 1.8 copies μL−1 for A2 and amastin, respectively, was detected with 50 ng template, 100 nm mL−1 of primer, Tm at 58°C (Supplementary Figs S2–S4 and Table S1). A dramatic drop in expression was observed when the template concentration was 100 ng μL−1, attributable to excess of template causing inhibition of PCR reaction. Additionally, with increasing concentration of template, there may be exhaustion of products like oligos, primer/probe, etc., accounting for the drop in signal amplification. It may also result in the formation of packed DNA structures within the confined space of the reaction tube, thereby increasing the chance of false priming and cause a poor yield (https://www.caister.com/highveld/pcr/pcr-troubleshooting). These standardized parameters were considered as optimal conditions and subsequently, the detection of amastigote load was performed.
Controls for droplet digital PCR
Both NC and NTC were used to define the cut-off. NC, i.e. template negative for amplification by A2 and amastin, included (i) uninfected hepatic and splenic tissues, (ii) uninfected peritoneal macrophages, (iii) preputial skin biopsies from males undergoing voluntary circumcision and (iv) promastigotes. NTC included the use of nuclease-free water as template.
Determination of the cut-off for droplet digital PCR
The ddPCR assay determined NTC as ‘No Call’ with a single threshold line for A2 and amastin based on no copies detected using the QuantaSoft™ software (black droplets). Samples were marked as positive (blue droplets) if more than 4 fluorescent signal events were shown above the threshold line to avoid false positivity. The cut-off for the ddPCR assay was defined based on negative samples as they did not show more than 2 fluorescent signals. The assay sensitivity was validated by determining the absolute limit of detection (aLOD), i.e. the lowest target copy number in a sample that can be reliably detected, but not necessarily quantified. The absolute limit of quantification (aLOQ) is the lowest target copy number in a sample that can be reliably quantified with an acceptable level of precision and accuracy (Holst-Jensen et al., Reference Holst-Jensen, Rønning, Løvseth and Berdal2003); in ddPCR, the aLOQ was equivalent to aLOD. The sensitivity of the performed assay was evaluated by the receiver operating characteristic (ROC) curve and area under the ROC curve (AUC) values with 95% confidence interval. The linearity of the optimized ddPCR assay was determined and the linear regression was established as R 2; values >0.7 were considered as a strong and effective coefficient parameter.
Measurement of parasite load by real-time polymerase chain reaction (qPCR)
DNA extraction was performed according to the manufacturer's instructions (QIAamp DNA Mini Kit, Qiagen, NW, Germany) from tissue biopsies collected in phosphate-buffered saline (20 mm, pH 7.4), excised into small pieces and eluted in 50 μL of DNA elution buffer. For measurement of parasite load in hepatic and splenic tissues sourced from infected hamsters and in patients with PKDL, a standard curve was generated and real-time PCR was performed (Ghosh et al., Reference Ghosh, Das, Mukherjee, Mukhopadhyay, Barbhuiya, Hazra and Chatterjee2015; Moulik et al., Reference Moulik, Chaudhuri, Sardar, Ghosh, Saha, Das and Chatterjee2018). The parasite number when <10 reported a cycle threshold (Ct) value almost equivalent to NTC, and was accorded an arbitrary value of 1.
Statistical analysis
Data were analysed either by Mann–Whitney t test (in case of 2 groups) and Kruskal–Wallis test (more than 2 groups) for non-parametric data using GraphPad Prism software version 8.4.2 (GraphPad Software, La Jolla, California, USA), P < 0.05 was considered significant. ddPCR data were expressed as mean ± s.e.m. (standard error of mean). Correlation was calculated using Pearson's correlation and the coefficient of correlation (r) when >0.4 was considered as relevant.
Results
Measurement of parasite load
The parasite load was measured in Leishmania-infected hamsters by qPCR using specific primers for minicircle kDNA and was quantified using a standard curve. During the initial phase of Leishmania infection, parasites rapidly multiply both in the liver and spleen, but the latter demonstrates a higher parasite burden upon establishment of infection (Moreira et al., Reference Moreira, Vitoriano-Souza, Roatt, Vieira, Ker, de Oliveira Cardoso, Giunchetti, Carneiro, de Lana and Reis2012; Moulik et al., Reference Moulik, Karmakar, Joshi, Dube, Mandal and Chatterjee2021a). This was reflected in this study as the parasite load in hepatic and splenic tissues was 6512 (4369–9957) and 60 982 (48 862–85 820) parasites per μg of genomic DNA, respectively.
Measurement of amastigote-specific genes in animal models of visceral leishmaniasis
In liver tissues from infected hamsters, the expression of A2 was detected as compared to their uninfected counterparts, being 2.42 ± 0.38 vs 0.01 ± 0.00 copies μL−1, P < 0.001 (Fig. 1A, i, iii). Similarly, in splenic tissues, A2 was substantially raised being 12.15 ± 3.62 vs 0.02 ± 0.00 copies μL−1 (Fig. 1A, ii, v). Importantly, A2 correlated positively with parasite load, in hepatic (r = 0.87) and splenic (r = 0.87) tissues (Fig. 1A, iv, vi). With regard to amastin, it was raised in liver and splenic tissues, being 1.61 ± 0.17 vs 0.01 ± 0.01 copies μL−1, P < 0.001 (Fig. 1B, i, iii), and 2.15 ± 0.24 vs 0.01 ± 0.01 copies μL−1, P < 0.001, respectively (Fig. 1B, ii, v). There was a robust positive correlation with hepatic (r = 0.56) and splenic parasite load (r = 0.68, Fig. 1B, iv, vi).

Fig. 1. Status of A2 and amastin in hepatic and splenic tissues of infected Syrian golden hamsters. (A, B. i–ii) Representative 1-dimensional plots of droplets measured for fluorescence signals (amplitude indicated on y-axis) emitted from A2 (A) and amastin (B) in infected (n = 10) and non-infected (n = 10) liver and splenic tissues of hamsters. Lane 1: negative controls; lane 2: non-template controls; lanes 3–4: non-infected liver and non-infected splenic tissues; lanes 5–7: infected hepatic (i) and splenic tissues (ii) respectively. EvaGreen-bound positive droplets are shown in blue while negative droplets are shown in black, with expression of the genes quantified as copies per μL. (A, B. iii, v) Bar graphs showing mRNA expression of A2 (A) and amastin (B) in infected hepatic (iii) and splenic tissues (v) of hamsters. Each horizontal bar represents mean ± s.e.m. of 10 animals in duplicates. #P < 0.001 as compared to uninfected counterparts. (A, B. iv, vi) Correlation between no. of parasites per μg gDNA with expression of A2 (A) and amastin (B) in infected liver tissues (iv) and splenic tissues (vi) respectively; (C) receiver operating characteristic (ROC) curve for A2 and amastin in hamster liver (i, iii) and splenic (ii, iv) tissues. Linear regression between predicted and actual ddPCR output (copies per μL) was observed for all tested targets and measured as R 2 in hamster liver (v, vii) and splenic (vi, viii) tissues.
Assay specificity and sensitivity
The assay specificity was confirmed using cDNA from target sources (amastigotes in experimental models or dermal lesions from patients with PKDL) while non-target samples included promastigotes, uninfected hamster tissues and peritoneal macrophages along with skin biopsies from healthy individuals. The control arms exhibited the expression of A2 and amastin similar to NTC. The LOQ was equivalent to LOD and for both A2 and amastin was 0.15 copies μL−1. AUC for A2 and amastin in the liver (Fig. 1C, i, iii) and the spleen (Fig. 1C, ii, iv) was 1.000 (95% CI ); R 2 for A2 in the liver and the spleen was 0.91 and 0.80, while for amastin, it was 0.97 and 0.89, respectively (Fig. 1C, v–viii).
Measurement of amastigote-specific genes A2 and amastin in Leishmania-infected peritoneal macrophages
In an ex vivo model of infection wherein murine peritoneal macrophages were infected with stationary phase promastigotes, A2 was enhanced as compared to uninfected macrophages, being 2.97 ± 0.12 vs 0.02 ± 0.01 copies μL−1, P < 0.001 (Fig. 2A). Importantly, A2 in log and stationary phase promastigotes (AG83) was comparable with NTC, confirming assay specificity. HePC/miltefosine caused a dose-dependent decrease in A2 from 2.97 ± 0.12 to 2.18 ± 0.29 (0.3 μ m), 1.46 ± 0.20 (0.6 μ m), 0.84 ± 0.18 (1.25 μ m), 0.57 �� 0.09 (P < 0.05, 2.5 μ m) and 0.27 ± 0.10 copies μL−1 (P < 0.001, 5 μ m) and the IC50 was graphically extrapolated to be 0.56 μ m (Fig. 2A, i–iii). Similarly, AmphoB caused a progressive dose-dependent decrease in A2 from 2.97 ± 0.12 to 1.96 ± 0.38 (3.12 nm), 1.74 ± 0.48 (6.25 nm), 0.85 ± 0.10 (12.5 nm), 0.54 ± 0.03 (P < 0.01, 25.0 nm) and 0.38 ± 0.07 copies μL−1 (P < 0.001, 50 nm) and the IC50 was 8.0 nm (Fig. 2A, iv–vi).

Fig. 2. Status of A2 (A) and amastin (B) in L. donovani-infected murine peritoneal macrophages. (A, B. i, iv) Representative 1-dimensional plots of droplets measured for fluorescence signals (amplitude indicated on y-axis) emitted from A2 (A) and amastin (B) in murine peritoneal macrophages infected with L. donovani followed by treatment with HePC (i) or AmphoB (iv) as described in Materials and methods section. Lane 1: negative control, lane 2: non-template control, lanes 3, 4: log phase and stationary phase promastigotes respectively, lane 5: control, non-infected peritoneal macrophages, lane 6: infected peritoneal macrophages, lanes 7–11: HePC (0.3–5 μ m) [i] and AmphoB (3.12–50 nm) [iv] treated peritoneal macrophages. EvaGreen-bound positive droplets are shown in blue while negative droplets are shown in black, with expression of the genes quantified as the copies per μL. (A, B. ii, v) Bar graphs showing mRNA expression of A2 (A) and amastin (B) in peritoneal macrophages infected with L. donovani and treated with HePC (ii) or Ampho B (v). Each horizontal bar represents mean ± s.e.m. of at least 3 different experiments in duplicates; *P < 0.05, **P < 0.01 and ***P < 0.001 as compared to infected macrophages. (A, B. iii, vi) Anti-amastigote activities of HePC (iii) and AmphoB (vi) were evaluated as described in Materials and methods section. (C) Receiver operating characteristic (ROC) curve for A2 (i) and amastin (iii) in infected peritoneal macrophages. Linear regression between predicted and actual ddPCR output (copies per μL) was observed for A2 (ii) and amastin (iv). (D) Representative images showing the anti-amastigote activity of HePC and AmphoB in AG83-infected peritoneal macrophages. Murine peritoneal macrophages (i) infected with L. donovani promastigotes (ii) treated with 0.6 μ m HePC (iii) or 12.5 nm AmphoB (iv); Bar-10 μm, magnification 1000×.
Similarly, amastin was significantly raised in infected macrophages as compared to their non-infected counterparts, being 2.82 ± 0.45 vs 0.02 ± 0.01 copies μL−1, P < 0.001 (Fig. 2B), whereas in log and stationary phase promastigotes, it remained similar to NTC, corroborating assay specificity. HePC caused a dose-dependent decrease in amastin from 2.82 ± 0.45 to 2.63 ± 0.38 (0.3 μ m), 1.32 ± 0.35 (0.6 μ m), 0.95 ± 0.35 (1.25 μ m), 0.47 ± 0.27 (2.5 μ m) and 0.18 ± 0.08 copies μL−1 (P < 0.05, 5 μ m, Fig. 2B, i–iii), the derived IC50 being 0.59 μ m. Similarly, AmphoB demonstrated a dose-dependent decrease being 2.82 ± 0.45, 2.66 ± 0.51 (3.12 nm), 1.82 ± 0.44 (6.25 nm), 1.00 ± 0.22 (12.5 nm), 0.66 ± 0.14 (25 nm) and 0.32 ± 0.09 copies μL−1 (P < 0.05, 50 nm), and the IC50 extrapolated was 8.6 nm (Fig. 2B, iv–vi).
For A2 and amastin, AUC was 1.000 (95% CI ), P < 0.0001 (Fig. 2C, i, iii); R 2 for A2 and amastin in infected peritoneal macrophages was 0.90 and 0.95, respectively (Fig. 2C, ii, iv). In parallel, Giemsa-stained macrophages were microscopically examined (Fig. 2D), and the IC50 of HePC and AmphoB was 0.62 μ m and 8.4 nm, respectively.
Measurement of amastigote-specific genes in patients with post kala-azar dermal leishmaniasis
This study objectively quantified the parasite burden in skin lesions sourced from patients with PKDL (Table 1). In PKDL, A2 was significantly enhanced in PKDL cases with respect to healthy controls, being 9.22 ± 1.34 vs 0.03 ± 0.00 copies μL−1 respectively, P < 0.001 (Fig. 3A, i–iii) as was amastin, 5.17 ± 0.64 vs 0.03 ± 0.01 copies μL−1, P < 0.001, respectively (Fig. 3B, i–iii). Both A2 and amastin correlated positively with parasite load, r = 0.91 and r = 0.82, respectively (Fig. 3A, B, iv). The AUC is 1.000 (95% CI 1.000–1.000) for A2 (Fig. 3C, i) and amastin (Fig. 3C, iii) and the R 2 for A2 and amastin was 0.98 and 0.97, respectively (Fig. 3C, ii, iv).
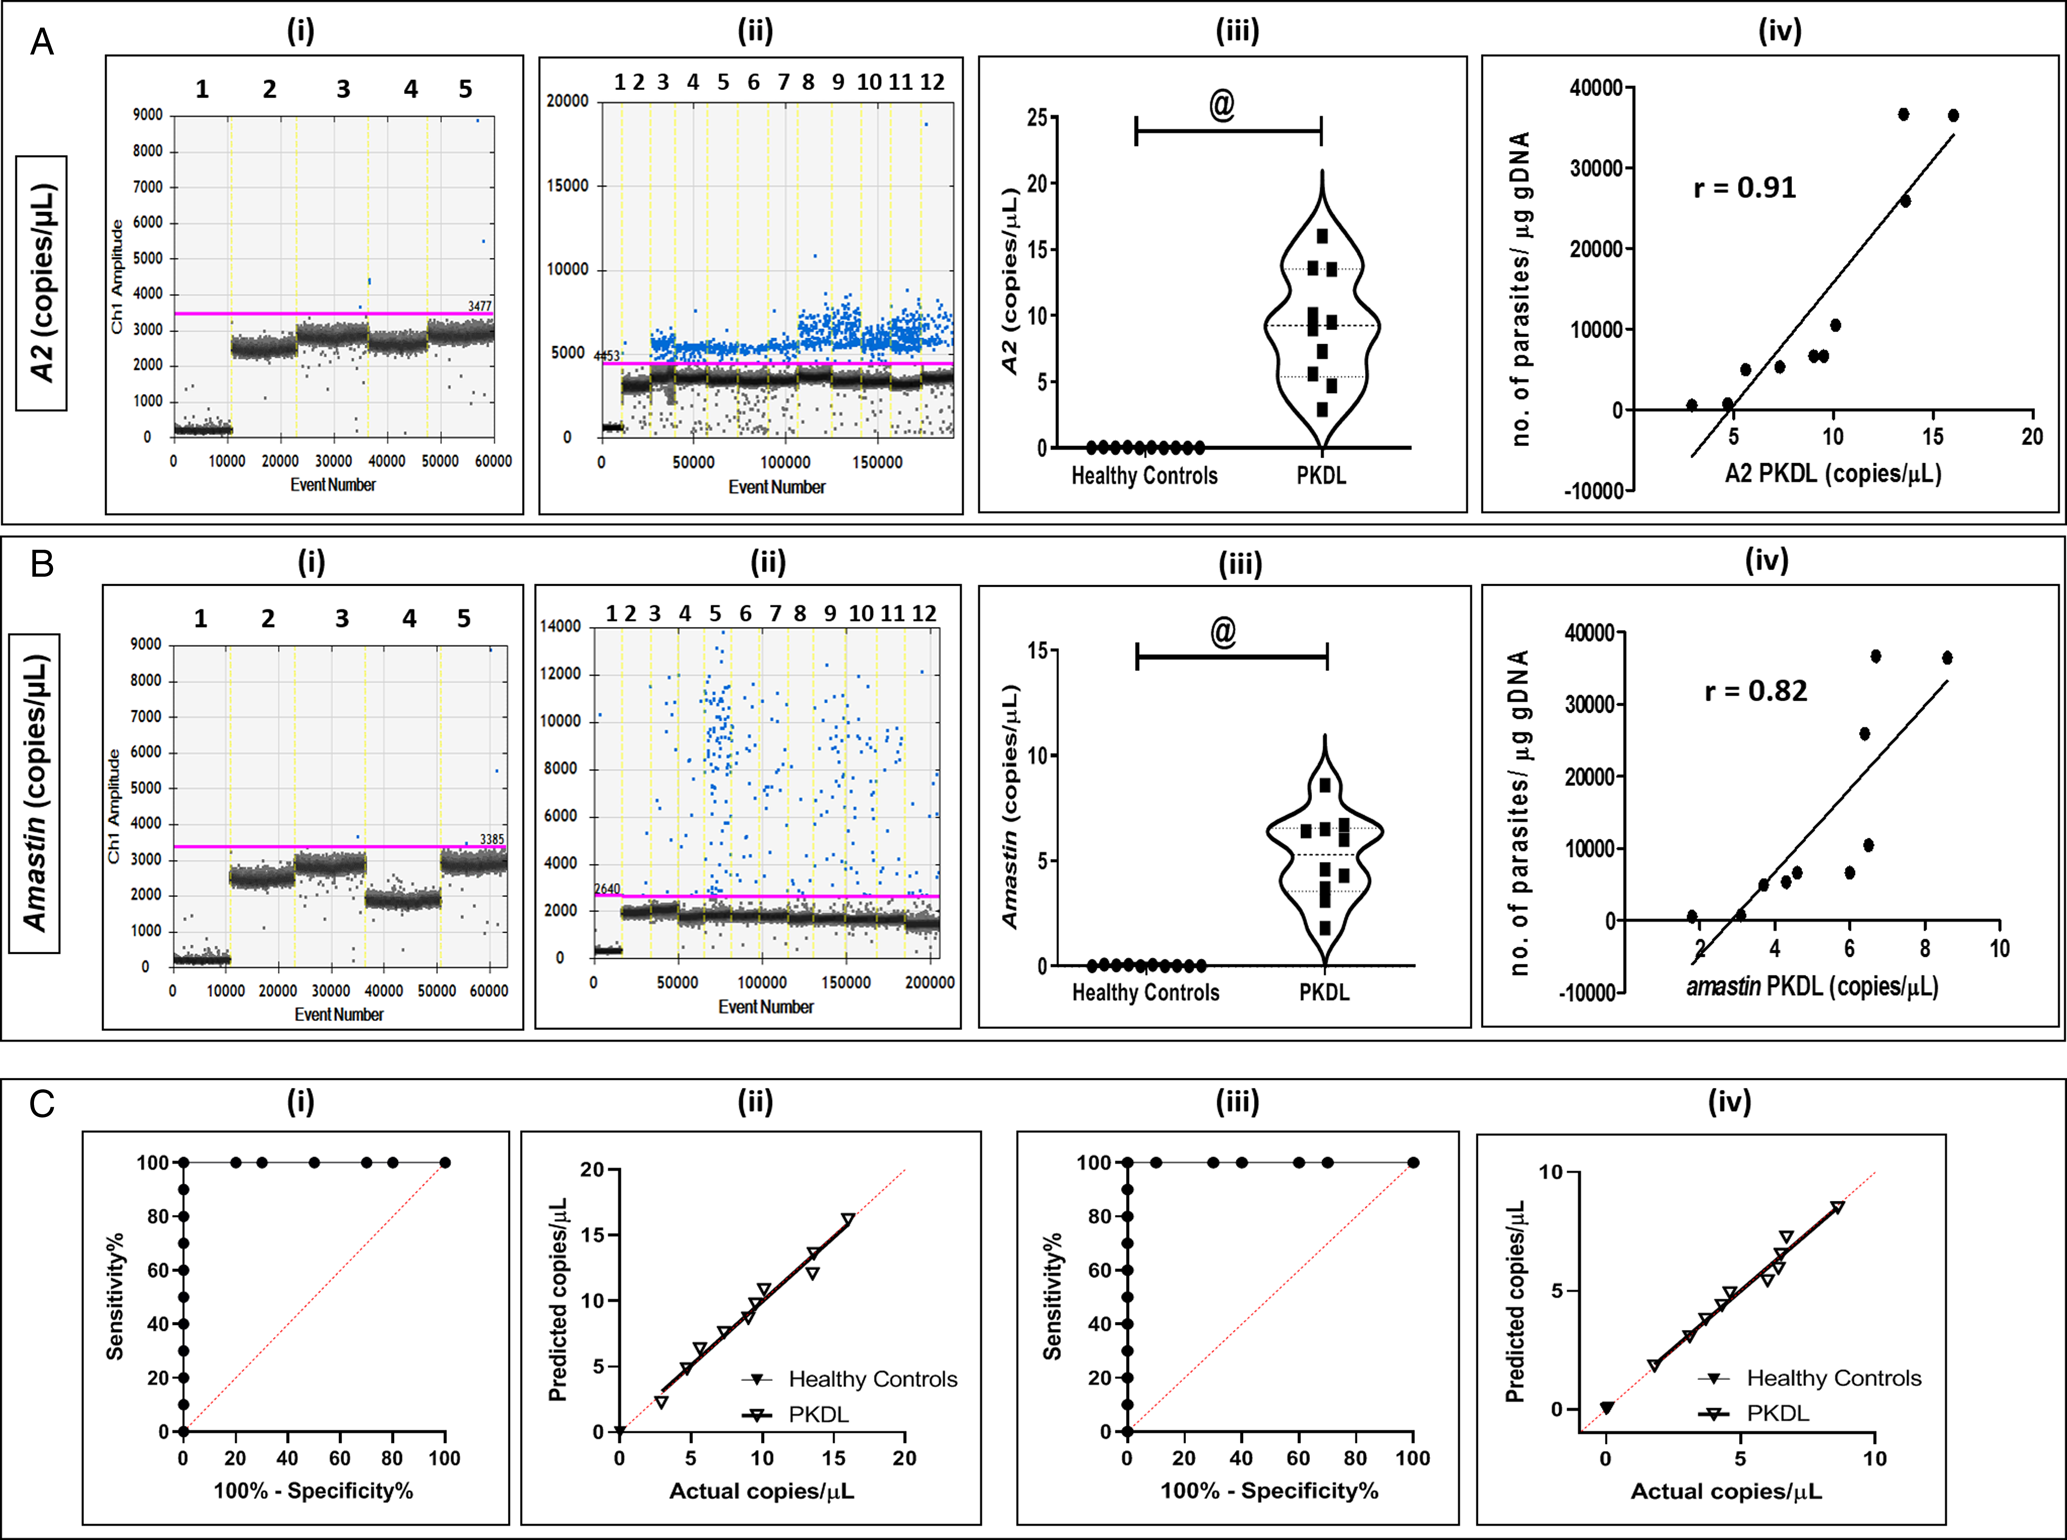
Fig. 3. Status of amastigote-specific genes A2 (A) and amastin (B) in PKDL. (A, B) Representative 1-dimensional plots of droplets measured for fluorescence signals (amplitude indicated on y-axis) emitted from A2 (A) and amastin (B) in skin biopsies sourced from PKDL cases (n = 10) and healthy controls (n = 10). EvaGreen-bound positive droplets are shown in blue while negative droplets are shown in black, with expression of genes quantified as copies per μL. (i) Lane 1: negative controls, lane 2: non-template controls, lanes 3–5: healthy controls for A2 (A) and Amastin (B) respectively. (ii) Lane 1: negative controls, lane 2: non-template controls, lanes 3–12: PKDL cases tested for expression of A2 (A) and Amastin (B) respectively. (iii) Violin plots showing mRNA expression of A2 (A) and amastin (B) in PKDL cases and healthy controls (n = 10). Each horizontal bar represents mean ± s.e.m. of 10 individuals in duplicates; @P < 0.001 as compared to healthy controls. (iv) Correlation between number of parasites per μg gDNA with A2 (A) and amastin (B) in PKDL cases. (C) Receiver operating characteristic (ROC) curve for A2 (i) and amastin (iii) in PKDL cases. Linear regression between predicted and actual ddPCR output (copies per μL) was observed for all tested targets in PKDL for A2 (ii) and amastin (iv).
Table 1. Study population

ITS-1 PCR, internal transcribed spacer-1 polymerase chain reaction; NA, not applicable; PKDL, post kala-azar dermal leishmaniasis; VL, visceral leishmaniasis.
a Values given in median (IQR).
Discussion
Distinct morphological and biochemical changes occur during the differentiation of promastigotes into infective amastigotes (Holst-Jensen et al., Reference Holst-Jensen, Rønning, Løvseth and Berdal2003; Pinheiro et al., Reference Pinheiro, Coleman, Hindson, Herrmann, Hindson, Bhat and Emslie2012). In view of A2 and amastin being exclusively present in amastigotes, it suggested their critical role in supporting parasite survival within host macrophages. Parasites like T. cruzi or Leptomonas are expected to demonstrate positivity, but amastin is more abundant in Leishmania spp. (Jackson, Reference Jackson2010). To obviate this cross-reactivity, the primers used in this study were exclusively designed for Leishmania spp. and therefore would not show any amplification for other parasites. The initial standardization for A2 and amastin endorsed the potential of ddPCR to monitor parasite load, and also emphasized that the optimal concentration of template was important (Supplementary Table S1 and Figs S2–S4). Moreover, their positive correlation with kDNA in qPCR and statistically evaluated AUC values established the assay sensitivity (Fig. 1). Importantly, as the non-target samples yielded a negative amplicon for A2 and amastin, it unequivocally confirmed assay specificity. Furthermore, the stage-specific expression of A2 and amastin was validated by its negative expression in promastigotes, and with the establishment of infection and transformation into amastigotes, it clearly correlated with an enhanced expression of A2 and amastin (Fig. 2).
Drug development in leishmaniasis till date depends on the quantification of amastigotes in ex vivo-infected macrophages, the classical method being counting of Giemsa-stained macrophages. However, this approach has an inherent operator bias, is time consuming and laborious, and cannot be applied for high-throughput screening. This limitation can be circumvented by employing objective approaches, e.g. kDNA-based qPCR. This is feasible within an established animal model of Leishmania infection wherein the expression of amastigotes can be quantified in terms of kDNA on the assumption that only amastigotes are present (Moulik et al., Reference Moulik, Karmakar, Joshi, Dube, Mandal and Chatterjee2021a). However, in short-term ex vivo drug screening methods as in peritoneal macrophages, quantification by kDNA qPCR approach maybe inadequate as despite numerous washing steps, a substantial proportion of promastigotes can remain loosely adherent to macrophages and would result in a false positivity. This can be obviated if quantification of amastigotes with A2 and amastin is adopted. Additionally, detection by ddPCR eliminated the need for standard curves for A2 and amastin. The generation of amastigotes in vitro would be needed to create a standard curve for qPCR but this is not feasible. Also, quantifying the precise number of amastigotes in Leishmania-infected peritoneal macrophages cannot be tailor-made for standard curve as the degree of infectivity can vary. Therefore, in this light, this ddPCR approach has a strong potential to be translated into a high-throughput drug screening platform. In view of the IC50 of miltefosine (HePC) and amphotericin B (AmphoB) in parasitized macrophages, as measured by conventional microscopy matching with the IC50 quantitatively determined by ddPCR (Fig. 2A–D), it endorsed the implementation of ddPCR.
Patients with PKDL can present with papulonodular (polymorphic) or hypomelanotic lesions (macular). These cases are considered as the disease reservoir, especially during inter-epidemic periods, and therefore have an immense epidemiological significance (de Paiva et al., Reference de Paiva, Grazielle-Silva, Cardoso, Nakagaki, Mendonça-Neto, Canavaci, Souza Melo, Martinelli, Fernandes, daRocha and Teixeira2015; Zijlstra et al., Reference Zijlstra, Alves, Rijal, Arana and Alvar2017; Gedda et al., Reference Gedda, Singh, Kumar, Singh, Madhukar, Upadhyay, Singh and Sundar2020). Sero-diagnostics for kala-azar/VL involves ELISA-based assays employing crude or soluble antigens sourced from Leishmania spp. and rK39-immunochromatographic test is the most robust assay (Saha et al., Reference Saha, Mazumdar, Anam, Ravindran, Bairagi, Saha, Goswami, Pramanik, Guha, Kar, Banerjee and Ali2005; Sundar et al., Reference Sundar, Singh, Maurya, Kumar, Chhabra, Singh and Rai2006; Mondal et al., Reference Mondal, Bern, Ghosh, Rashid, Molina, Chowdhury, Nath, Ghosh, Chapman, Alim, Bilbe and Alvar2019). Additionally, the heightened anti-leishmanial IgG and its subclasses have helped identify and monitor active VL and PKDL cases (Mukhopadhyay et al., Reference Mukhopadhyay, Das, De Sarkar, Manna, Ganguly, Barbhuiya, Maitra, Hazra and Chatterjee2012; Bhattacharyya et al., Reference Bhattacharyya, Ayandeh, Falconar, Sundar, El-Safi, Gripenberg, Bowes, Thunissen, Singh, Kumar, Ahmed, Eisa, Saad, Silva Pereira, Boelaert, Mertens and Miles2014; Sengupta and Chatterjee, Reference Sengupta and Chatterjee2021). Other important Leishmania-specific antigens include recombinant GP63, recombinant cysteine protease A (Didwania et al., Reference Didwania, Ejazi, Chhajer, Sabur, Mazumder, Kamran, Kar, Pandey, Das, Das, Rahaman, Goswami and Ali2020) and Leishmania membrane antigen (Ejazi et al., Reference Ejazi, Ghosh, Saha, Choudhury, Bhattacharyya, Chatterjee, Pandey, Das, Das, Rahaman, Goswami, Rai, Khanal, Bhattarai, Deepachandi, Siriwardana, Karunaweera, deBrito, Gomes, Nakazawa, Costa, Adem, Yeshanew, Melkamu, Fikre, Hurissa, Diro, Carrillo, Moreno and Ali2019). Alternatively, antigen detection in urine can be expected to broadly correlate with the parasite load (Ejazi et al., Reference Ejazi, Bhattacharya, Bakhteyar, Mumtaz, Pandey, Das, Das, Rahaman, Goswami and Ali2016). The A2 amastigote antigen-based LAT was performed in VL cases (Akhoundi et al., Reference Akhoundi, Mohebali, Shojaee, Jalali, Kazemi, Bandehpour, Keshavarz, Edrissian, Eslami, Malekafzali and Kouchaki2013), but no similar study has been performed to identify PKDL cases.
A major limitation in the diagnosis of PKDL is that (a) serological tests are of limited value as positivity can be attributed to a past episode of VL and (b) detection of parasites in Giemsa-stained skin biopsies is a major challenge especially for macular PKDL which presently constitute almost 50% of the PKDL disease burden (Sengupta et al., Reference Sengupta, Chaudhuri, Moulik, Ghosh, Saha, Das and Chatterjee2019). Additionally, the limited availability of a standardized ‘test of cure’ tool for guiding clinicians is a major limitation, as till date the resolution of clinical features is considered as the efficacy parameter. Therefore, this study may find value in PKDL-related clinical trials, an area where chemotherapy regimens till date remain empirical.
Interestingly, A2 has been implicated only in visceralization during establishment of infection, and was considered to be selectively expressed in VL, with negligible expression in CL and PKDL lesions (Sharma et al., Reference Sharma, Gurumurthy, Duncan, Nakhasi and Salotra2010). However, as this study has demonstrated the presence of A2 and amastin in PKDL (Fig. 3), it may be attributed to a lower sensitivity of the assay employed in that study vis-a-vis the more sensitive ddPCR used in this study. The presence of A2 in PKDL has opened new avenues in understanding the potential dermatotropic role of A2 in the pathogenesis of PKDL (Fig. 3). Also, it would be interesting to study the effectiveness of using A2 as a monitoring tool for CL, where interpretation of lesion healing is challenging.
Overall, the optimized ddPCR assay was demonstrated to be sensitive as the linear regression curves exhibited strong goodness of fit. However, the reagents and ddPCR machines are expensive and perhaps difficult to use as a common tool in laboratories. Irrespective of the study models, the expression of A2 was consistently greater than amastin, and would be the preferred biomarker in future. The availability of such a molecular diagnostic platform involving precise detection of amastigote burden will be an invaluable asset for drug screening as also for conducting clinical trials, and thus provide strong support for the ongoing leishmaniasis elimination programme in South Asia.
Supplementary material
The supplementary material for this article can be found at https://doi.org/10.1017/S0031182022000610.
Acknowledgements
The work received technical support from the Multidisciplinary Research Unit (MRU), IPGME&R (V.25011/103/2016-HR).
Author contributions
M. R., D. S. and M. C. conceived and designed the study. M. R. and D. S. conducted data gathering. M. R. performed statistical analyses. M. R. and M. C. wrote the article.
Financial support
The work received financial assistance from the Department of Science and Technology, Government of West Bengal [grant number 969/(Sanc)/ST/P/SandT/9G-22/2016], Indian Council of Medical Research (ICMR) Government of India [grant numbers: 6/9-7(151)2017-ECD II and 6/9-7(263)KA/2021/ECD II], JC Bose Fellowship, Science & Engineering Board, Government of India (JCB/2019/000043). M. R. and D. S. are recipients of Senior Research Fellowship from University Grants Commission and ICMR, Government of India, respectively. The funders had no role in study design, data collection and analysis, decision to publish or preparation of the manuscript.
Conflict of interest
None.
Ethical standards
All animal-related experiments were approved by the Institutional Animal Ethics Committee of IPGME&R, Kolkata (CPCSEA Registration No. 544/PO/c/02/CPCSEA). All human-related work included repurposed DNA after receiving approval from the Institutional Ethics Committee of School of Tropical Medicine, Kolkata and Institute of Post Graduate Medical Education and Research (IPGME&R), Kolkata. Written informed consent was obtained from all individuals, and for a minor, their legally accepted representative provided the same.


