


INTRODUCTION
Proliferative kidney disease (PKD) is a parasitic disease of salmonid fish (Canning et al. Reference Canning, Curry, Feist, Longshaw and Okamura1999; Okamura et al. Reference Okamura, Anderson, Longshaw, Feist and Canning2001). The aetiological agent of PKD is the myxozoan parasite Tetracapsuloides bryosalmonae (Myxozoa: Malacosporea) (Canning et al. Reference Canning, Curry, Feist, Longshaw and Okamura1999, Reference Canning, Tops, Curry, Wood and Okamura2002). Fish are infected by parasite spores released from bryozoans which are the invertebrate host of the parasite (Feist et al. Reference Feist, Longshaw, Canning and Okamura2001). T. bryosalmonae infects the fish through skin and gills (Longshaw et al. Reference Longshaw, Le Deuff, Harris and Feist2002) and afterwards invades inner organs, with the kidney being the main target organ (Ferguson and Ball, Reference Ferguson and Ball1979; Ferguson, Reference Ferguson1981; Clifton-Hadley et al. Reference Clifton-Hadley, Richards and Bucke1986). Infection of the latter organ can lead to a massive granulomatous infiltration and proliferation of the interstitial tissue, hence the name of the disease (Ferguson and Ball, Reference Ferguson and Ball1979; Ferguson, Reference Ferguson1981; Clifton-Hadley et al. Reference Clifton-Hadley, Richards and Bucke1986; Bettge et al. Reference Bettge, Wahli, Segner and Schmidt-Posthaus2008).
Clinical disease outbreaks occur seasonally during the summer months, and can cause high mortalities in salmonid populations (Ferguson and Ball, Reference Ferguson and Ball1979; Ferguson, Reference Ferguson1981; Clifton-Hadley et al. Reference Clifton-Hadley, Richards and Bucke1986). The seasonality of PKD outbreaks appears to be related to water temperature, as clinical disease signs and mortalities increase at water temperatures above 15°C (Ferguson and Ball, Reference Ferguson and Ball1979; Ferguson, Reference Ferguson1981; Clifton-Hadley et al. Reference Clifton-Hadley, Richards and Bucke1986; Hedrick et al. Reference Hedrick, MacConnell and de Kinkelin1993). The factors causing enhanced disease manifestation and mortalities of the fish host at elevated water temperatures are not understood to date. Increasing water temperature is associated with an increasing release of infective spores from bryozoans (Tops et al. Reference Tops, Lockwood and Okamura2006), which may result in enhanced infection pressure on the fish. At the same time, higher water temperature may promote parasite proliferation in the fish host as suggested by Bettge et al. (Reference Bettge, Wahli, Segner and Schmidt-Posthaus2009) and Gay et al. (Reference Gay, Okamura and de Kinkelin2001), and the resulting increase of infection intensity could then lead to the temperature-related elevation of mortality. Another aspect is that the fish immune system is modulated by water temperature (Le Morvan et al. Reference Le Morvan, Troutaud and Deschaux1997; Köllner and Kotterba, Reference Köllner and Kotterba2002). PKD is known to invoke an immune response to parasites. The nature and intensity of this response might be temperature dependent.
The present study investigates for rainbow trout, Oncorhynchus mykiss, the relation between water temperature, the intensity of parasite infection of the fish kidneys, and fish mortality. Methodologically, we assessed the intensity of kidney infection with parasites by quantifying the concentration of parasite DNA. To this end, we developed a real-time PCR for the 18S rDNA gene of T. bryosalmonae. Experimentally, we assessed the relation between water temperature, parasite intensity and fish mortality through a combination of different incubation and temperature regimes. The fish were infected with T. bryosalmonae in water from a river carrying a PKD-positive salmonid population. Afterwards, the trout were transferred into the laboratory to exclude a further infection by spores from the river water. In the laboratory, the fish were then exposed to different temperature regimes in order to evaluate how these conditions influence parasite proliferation in the kidney and how the latter relates to mortality.
MATERIALS AND METHODS
Experimental design
In a first experiment, started in July 2005, 425 young-of-the year rainbow trout originating from a commercial trout farm without any PKD history were used (infection Exp. I, Table 1). Before exposure, the fish were held in the trout farm at temperatures below 12°C. From this batch, 5 randomly sampled fish were tested negative for the presence of T. bryosalmonae by real-time PCR. The remaining 420 trout were exposed for 14 days to river water, where they experienced a temperature range of 12 to 16°C. In this river, trout infected with T. bryosalmonae had regularly been detected during the last years. After the 14-day exposure in the field, the fish had reached a PKD prevalence of 100% tested by real-time PCR in a sample of 12 fish. Then the fish were transported into the facilities of the Centre for Fish and Wildlife Health (FIWI), where the trout were kept in tanks supplied with tap water. Sixty non-exposed fish (control fish) were cohabitated with the river water-exposed trout in the laboratory in the same tanks. For identification, the adipose fin was cut from these control animals. Cohabitation of infected and non-infected fish is possible since transmission of the parasite from fish to fish does not occur (Ferguson and Ball, Reference Ferguson and Ball1979). As the kinetics of parasite proliferation in the fish host was unknown, we exposed the fish in the first experiment to a uniform temperature (16°C, corresponding to the river water temperature) during the first 2 weeks of laboratory rearing until the appearance of initial disease signs. Then the fish should have been transferred to 2 temperature levels, 14°C and 19°C, respectively, in 2 replicates per temperature. However, due to a technical failure of the cooling system, only 1 of the 2 14°C-replicates could be maintained at the foreseen temperature, while in the other group temperature was 16°C, resulting in 3 different temperature levels, i.e. 14, 16 and 19°C, 2 of them with 1 replicate only (14 and 16°C) which limited the number of fish available for sampling. The temperature transfer was carried out over 1 day. Sampling of fish was done at day 0, at the end of the 14-day exposure period in the river water, after the 14 days acclimation period in the laboratory, and, after temperature transfer, at days 35, 42 and 49 post-exposure (p.e.) at each temperature (Table 1). Mortality was recorded during the experiment and expressed as cumulative mortality.
Table 1. Time and sampling schedule of exposed fish in infection Exp. I
(At day 0 a sample was taken before exposing the fish to river water. From days 0 to 14 the fish were exposed to river water to allow T. bryosalmonae infection, before they were transferred to the laboratory, where they were held at 16°C for the next 14 days. At day 28 the fish were divided into groups and held at different water temperatures (14°C, 16°C or 19°C). The days indicate the sample points. p.e.=post-exposure. IHC=immunohistochemistry.)

In infection Exp. II (Table 2), started in September 2006, 425 young-of-the year rainbow trout were used, which originated from the same commercial trout farm as the trout for Exp. I. Before exposure, 5 randomly sampled fish were tested for the presence of T. bryosalmonae by real-time PCR and found to be negative. The remaining 420 trout were exposed in a tank fed with river water at 12–16°C for 5 days as described above. At the end of the 5-day exposure period in the river water, 15 fish were tested for T. bryosalmonae DNA by means of real-time PCR. All 15 fish were found to be positive. The remaining fish were transferred to the laboratory. In this second experiment, we applied different temperature regimes immediately after transfer into the laboratory in order to examine how this influences parasite proliferation and the maximum levels of parasite DNA. The trout were divided into 2 groups with 200 fish each and kept in tanks supplied with tap water. One group was kept at a water temperature of 18°C, while the second group was kept at 12°C. The temperature transfer was carried out over 1 day. After temperature transfer, samples were taken at days 12, 19, 26, 33 and 47 p.e. at each temperature (Table 2). Over the whole experimental period, mortalities were checked daily and expressed as cumulative mortality.
Table 2. Time and sampling schedule of exposed fish in infection Exp. II
(At day 0 a sample was taken before exposing the fish to river water. From days 0 to 5 the fish were exposed to river water to allow T. bryosalmonae infection. Immediately after transfer to the laboratory, the fish were divided into 2 groups and held at different water temperatures (12°C or 18°C). The days indicate the sample points. p.e.=post-exposure. IHC=immunohistochemistry.)

In both experiments fish were kept in 100 l tanks with a flow through system and constant aeration. Oxygen concentration in all tanks was ⩾8 mg l−1 during the experimental period. Fish were fed commercial trout pellets (HOKOVIT, Bützberg, Switzerland) with a daily food ratio equal to 1–2% of body weight. Animals which died in between the samplings were subjected to necropsy and to a parasitological and bacteriological examination.
For all sampled fish, fresh mounts of skin and gill samples and the intestinal content were examined microscopically for the presence of parasites. Until day 19, the river water-exposed fish in Exp. II showed an infection with Ichthyophthirius multifiliis. The fish were treated with a 3% NaCl bath, eventually leading to a total disappearance of the parasites. During this period no mortality attributable to I. multifiliis was detected.
Sampled fish were euthanized in buffered 3-aminobenzoic acid ethyl ester (MS 222®, Argent Chemical Laboratories, Redmont, USA), dissected and assessed for external and internal signs of the clinical stage of PKD, including darkening, exophthalmia, anaemic gills, kidney swelling or ascites. Since the intensity of kidney swelling goes more or less in parallel with the progression of the disease, each dissected fish was assigned a semiquantitative ‘kidney-swelling index’ to estimate the disease status. The swelling index ranged from 0 to 3, and was based on the index described by Clifton-Hadley et al. (Reference Clifton-Hadley, Bucke and Richards1987) as follows: Grade 1: kidney enlarged along its length, especially at the posterior end; Grade 2: kidney very enlarged with marked corrugation of the kidney surface; Grade 3: kidney, mottled grey, further swollen due to oedema, with clear fluid running from cut surfaces.
After the macroscopical assessment, kidneys were carefully removed, weighed, and cut along the longitudinal axis into 2 equal parts. One half was frozen in liquid nitrogen for real-time PCR analyses, and the other half was fixed in 10% buffered formalin for immunohistochemistry.
DNA preparation
Total DNA of rainbow trout kidneys was extracted from approximately 50–100 mg of frozen kidney tissue of each fish with DNAzol (Lucerna, Luzern, Switzerland) according to the manufacturer's protocol. The extracted DNA was resuspended in 8 mm NaOH and stored at 4°C. The yield was determined by spectrophotometry using the NanoDrop photometer (NanoDrop Technologies, Inc., Wilmington, USA).
Cloning of 18S rDNA gene of T. bryosalmonae
A 435 bp nucleotide sequence of the 18S rDNA gene of T. bryosalmonae was chosen from GenBank (Accession no. AF190669; Canning et al. Reference Canning, Curry, Feist, Longshaw and Okamura1999) and amplified with the use of the primers PKX5f and PKX6r designed by Kent et al. (Reference Kent, Khattra, Hervio and Devlin1998). The PCR product was then cloned into the pCR®-TOPO® vector using the TOPO TA Cloning® Kit (Invitrogen, Basel, Switzerland) following the manufacturer's protocol. The vector plasmid DNA was purified with the QIAprep Miniprep® kit (Qiagen, Basel, Switzerland) and resuspended in 8 mm NaOH. The yield was determined by spectrophotometry using the NanoDrop photometer. The plasmid DNA was amplified and sequenced in order to verify the sequence of the insert.
Real-time PCR primer and probe design
A primer and probe combination for the 18S rDNA was designed using the Primer express software (PE Biosystems, Foster City, CA, USA). Then a BLAST search to identify homology of the primer and probe combination to other genetic sequences was performed to exclude non-specific amplification. Primers and probe were constructed by Microsynth (Balgach, Switzerland). Forward and reverse primers were designed to amplify a 73 base-pair region of the selected 18S rDNA sequence (primer PKDtaqf1: 5′-GCGAGATTTGTTGCATTTAAAAAG-3′ and primer PKDtaqr1: 5′-GCACATGCAGTGTCCAATCG-3′). The length of the real-time PCR products was kept purposely short to enable high amplification efficiencies. The internal probe was labelled at the 5′end with the reporter dye 6-carboxyfluorescein (FAM) and at the 3′end with the quencher dye 6-carboxytetramethyl-rhodamine (TAMRA) (probePKD: 5′-CAAAATTGTGGAACCGTCCGACTACGA-3′). To test the suitability of the primer combination, a conventional PCR according to Kent et al. (Reference Kent, Khattra, Hervio and Devlin1998) was performed with the new primers and the products were checked on an agarose gel for amplification and molecular weight. The quantitative real-time PCR amplification was performed as follows. The reaction volume of 25 μl containing 1× TaqMan universal Master Mix (Applied Biosystems, Rotkreuz, Switzerland), 300 nm forward primer, 300 nm reverse primer, 200 nm fluorescent labelled probe, and 2 μg extracted DNA from the trout kidney as template. Amplification was done in an Mx4000® Multiplex Quantitative PCR System (Stratagene, La Jolla, CA, USA). The amplification conditions consisted of initial denaturation at 95°C for 10 min, followed by 45 cycles of 15 s at 95°C and 1 min at 60°C. All samples were analysed in duplicate.
Preparation of standard curves and data analysis
The cloned region of the 18S rDNA gene of T. bryosalmonae was used for the generation of standard curves. To calculate the copy numbers of the standard curve, nucleotide length and plasmid concentration were used (Yin et al. Reference Yin, Shackel, Zekry, McGuinness, Richards, Van Der Putten, McCaughan, Eris and Bishop2001). A stock solution of 20 pg plasmid DNA was calculated to be equivalent to 3·14×105 copies of the 18S rDNA sequence of the parasite. From this stock solution, a 10-fold serial dilution in buffer (8 mm NaOH) was prepared, subjected to real-time PCR and the obtained threshold cycle values (Ct) were plotted against the quantity of the plasmid DNA. The assay conditions to measure the samples of the standard curve were identical to those used for the fish samples. The regression equation obtained for the standard curve of the 18S rDNA of T. bryosalmonae was then used to convert the measured Ct value of an unknown sample into copy numbers of parasite DNA. A reference sample with known copy numbers of plasmid DNA was measured together with the samples to calibrate each run. The PCR product of the reference sample was sequenced to verify the specificity of the real-time PCR. Additionally all Ct values of 32 and more were excluded from the calculations, because sequencing of PCR products resulting from amplification cycles of 32 and more showed, that under these conditions unspecific sequences were amplified.
Target DNA was normalized against total DNA extracted from the kidney tissue. For comparison, results were normalized against fish weight. To this end, the copy numbers of parasite DNA were converted to copy numbers per fish using the individual fish kidney weights.
Immunohistochemical examination of the kidneys
Immunohistochemical staining of parasites in the kidney was conducted to compare the number of immunohistochemically stained parasites in the kidney with renal copy numbers of parasite DNA determined by real-time PCR. To this end, we performed immunohistochemical staining of T. bryosalmonae on kidney sections with a monoclonal anti-T. bryosalmonae antibody (AquaMAb-P01, Aquatic Diagnostics Ltd, Stirling, UK) and counted the number of stained parasites on the sections. The immunohistochemical staining was performed according to the protocol of Adams et al. (Reference Adams, Richards and De Mateo1992) with minor modifications. Briefly, unstained sections were incubated overnight using an antibody dilution of 1/100. Unspecific background staining was blocked with goat serum. A biotin-streptavidin-horseradish peroxidase staining kit (Kit Dako LSAB 2 System HRP Code Nr. K0675; DakoCytomation, Zug, Switzerland) followed by AEC (Amino-Ethyl-Carbazole) staining (DAKO AEC K3464) was used to visualize antibody-antigen complexes. Counterstaining of these sections was not performed. Kidney tissue of a fish known to be PKD-positive was used as a positive control. Slides incubated without the first antibody were used as negative controls. The immunohistochemical slides were evaluated with a light microscope at a magnification of 400×(high-power field). The number of parasites per high-power field was counted in 3 randomly selected fields per slide. The average number of parasites per fish was compared to the quantity of parasite DNA copies determined by means of real-time PCR for the same individual. This comparison was possible, because the kidneys used for PCR and immunohistochemistry originated from the same fish.
Statistical analysis
The cumulative mortality of the different groups was compared and tested for significant differences using the chi-square-test and a P⩽0·05 significance level. The amounts of parasite DNA as determined by real-time PCR at different time-points were tested for normal distribution with the Skewness, Kurtosis and Omnibus Normality tests, and then compared and tested for significant differences using the Mann-Whitney U or Wilcoxon Rank-Sum test with a P⩽0·05 significance level because the values were not normally distributed. The kidney-swelling index at different time-points was compared between the different temperatures and tested for significant differences using the Mann-Whitney U or Wilcoxon Rank-Sum test and P⩽0·05 significance level as values were not normally distributed. For all statistical tests, NCSS 2001 (Hintze, Reference Hintze2006) was used.
RESULTS
Standard curve/dynamic range of the real-time PCR
The standard curve prepared by a 10-fold serial dilution of the cloned 18S rDNA region was linear over 5 logs of plasmid dilution, when mean Ct values obtained for the standard dilutions were plotted against the calculated quantity of the plasmid. The average slope of the regression equations from 4 independent repetitions of the serial dilution of the DNA standard was −3·4477±0·09 with a correlation coefficient of r2=0·9996 (Fig. 1). The PCR efficiency for a tissue dilution curve obtained by dilution of DNA from the kidney of a fish infected with T. bryosalmonae resulted in a regression of −3·561.
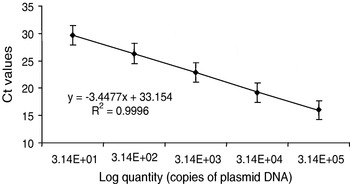
Fig. 1. Real-time PCR standard curve plotted as mean Ct values versus known quantities of a plasmid containing the 435 bp nucleotide sequence of the 18S rDNA region of Tetracapsula bryosalmonae diluted into buffer. The PCR efficiency was 94·9%. Standard deviations show the inter-assay variability (n=4).
To evaluate whether changes of parasite DNA copy numbers as determined by real-time PCR correlate with changes in parasite numbers as seen on immunohistochemical sections, the PCR samples were compared to the corresponding slides prepared from the same individuals as used for the quantitative real-time PCR. This comparison was performed exclusively on fish which had been exposed to river water and therefore were expected to be infected. A linear correlation was observed for fish showing >0–20 parasites per high-power field (magnification 400×) with a correlation coefficient of r2=0·666 (Fig. 2). When fish with immunohistochemically-intense infections (parasite numbers per high-power field of >20) were included in the dataset, no correlation between PCR results and parasite counts was found (r2=0·0172; data not shown). Also no correlation (r2=0·0071; data not shown) was obtained when fish with no immunohistochemical staining of parasites were included in the dataset. In this case, the individuals yielded a positive PCR signal but showed no immunoreactivity for T. bryosalmonae.

Fig. 2. Comparison between quantitative real-time PCR and immunohistochemistry on kidneys with different degrees of infection. No correlation was seen for fish showing no immunodetectable parasites per high-power field and for fish with >20 parasites per high-power field. These fish were excluded from the regression curve.
Infection Experiment I
Infection phase
Naive rainbow trout were exposed for 14 days to river water, in which the resident brown trout population was regularly found to be positive for T. bryosalmonae indicating that the parasite was present endemically. None of 12 fish analysed after the exposure period of 14 days showed any macroscopical signs of a T. bryosalmonae infection (Fig. 3). In contrast, by means of real-time PCR all 12 fish proved to be positive for T. bryosalmonae (Fig. 4).

Fig. 3. Infection Exp. I. – swelling index of kidneys in fish subjected to different temperature treatments. The experiment covers the period from initial infection to the clinical disease phase. Before subjecting fish to different temperatures, n=5, 12 and 20 at days 0, 14 and 28; n=9–10 at 14°C, n=8–10 at 16°C, and n=16–20 at 19°C for sample points after subjecting fish to different temperatures. The asterisks indicate a significant increase of the kidney-swelling index to the previous sample (P⩽0·05.) in all groups (except at day 42, which refers to the 19°C-group).

Fig. 4. Infection Exp. I – copy numbers of parasite DNA per 2 μg of total DNA. The arrow indicates the time-point, when fish were subdivided into 3 groups. The asterisks indicate significant differences to the previous sample (P⩽0·05.), a=14°C, b=16°C.
Acclimation phase
Within the 14 days of acclimation at 16°C, which followed the river exposure period (days 14 to 28 p.e.) the kidney swelling increased only slightly (Fig. 3), while a significant (P⩽0·05) increase in copy numbers of parasite DNA from 2·7×104 to 1·1×106 was evident (Fig. 4).
Exposure phase to different temperatures
After 14 days of river exposure and subsequent 14 days of laboratory adaptation phase, groups of fish were transferred to different temperatures. In animals kept at 14°C and at 16°C, the kidney-swelling index increased significantly until day 35, while in animals kept at 19°C a significant increase was recorded until day 42 (Fig. 3). Regarding development of copy numbers of parasite DNA, in fish kept at 14°C a significant increase was found between days 28 and 35, thereafter no further significant changes occurred (Fig. 4). At 16°C, parasite DNA concentrations showed a slight increase but the differences were not significant when compared to the values measured at day 28 (Fig. 4). At 19°C, parasite DNA concentrations increased significantly until the end of the experiment, although the rate of DNA augmentation was not as pronounced as that seen between days 14 and 28 (Fig. 4). Comparisons of parasite DNA levels between all 3 temperature groups revealed no significant differences between the treatments at any time-point. None of the control fish in any of the temperature regimes showed positive results for parasite DNA.
Mortality
Mortality first occurred at day 31, i.e. 3 days after separation of fish into different temperature groups. Cumulative mortalities varied significantly with water temperature (Fig. 5). Infected fish held at 19°C experienced a cumulative mortality over the experiment of 85·0% (day 49 p.e.). At 16°C, cumulative mortality reached 45·5% and at 14°C cumulative mortality was 35·7%. In the control groups, a total of 5·9% of fish died at 19°C, whereas no mortalities occurred at 16°C and 14°C, respectively.

Fig. 5. Infection Exp. I – cumulative mortality of Tetracapsula bryosalmonae-infected fish kept at different temperatures and uninfected control fish, cohabitated with the infected fish. The arrow indicates the time-point when fish were subdivided into 3 temperature groups.
Infection Experiment II
Considering the short period in the river water needed to achieve 100% prevalence of a T. bryosalmonae infection and the non-significant differences in DNA copy numbers between the different temperature regimes in Exp. I, 3 factors were changed in the second experiment. The exposure time to river water was reduced to 5 days, the adaptation period in the laboratory was omitted and a more pronounced temperature difference was chosen, namely 12°C and 18°C.
Infection phase
After 5 days of exposure to river water, macroscopic signs of infection characterized by slightly enlarged kidneys were observed in 2 out of 20 fish. Real-time PCR confirmed that all 15 fish tested were infected with T. bryosalmonae (Fig. 7). Copy numbers were similar to those observed in Exp. I at the end of the 14-day exposure period (104–105 copies per 2 μg total kidney DNA).
Exposure phase to different temperatures
After transfer of fish to the different temperatures in the laboratory, the kidney-swelling index increased slowly until day 19 p.e., independent of the temperature (Fig. 6). Between days 19 and 26, fish reared at 12°C showed still a moderate, non-significant elevation of kidney swelling, while fish reared at 18°C showed a significant increase in kidney swelling (Fig. 6). From day 26 p.e. onwards, no further increase was recorded, either at 12 or 18°C. Thus, both temperature groups showed a similar time-course of kidney swelling, but differed in the intensity of the response.

Fig. 6. Infection Exp. II – swelling index of kidneys in fish subjected to different temperature treatments. The experiment covers the period from initial infection to the clinical disease phase. Before subjecting fish to different temperatures, n=5, at day 0 and n=20 at day 5; n=10 per temperature group and sampling point from day 12 onwards. The asterisk indicates a significant increase of the kidney swelling index to the previous sample (P⩽0·05.) in the 18°C group.
After transfer of the fish to the laboratory (at day 5) parasite DNA concentrations in the kidney increased in a time- and temperature-dependent manner (Fig. 7). In the 12°C-group, a significant increase of parasite DNA occurred from day 5 to day 12 p.e.. Thereafter, copy numbers continued to increase slightly, but the increase was not significant (Fig. 7). In contrast, in fish reared at 18°C, parasite DNA in the kidneys increased significantly from day 12 until day 26, when it reached a maximum (Fig. 7). Thereafter, parasite DNA levels in fish reared at the high temperature decreased slightly, but not significantly. DNA copy numbers of T. bryosalmonae were significantly (P⩽0·05) higher in 18°C fish than in 12°C fish at days 12, 19 and 26 p.e., but not at days 33 and 47 p.e.

Fig. 7. Infection Exp. II – copy numbers of parasite DNA per 2 μg of total DNA. The arrow indicates the time-point when fish were subdivided into 2 groups. An asterisk indicates a significant difference (P⩽0·05.), a=12°C to the previous sample, b=18°C to the previous sample, c=between both groups.
Since the infection is characterized by a higher level of kidney swelling in the 18°C group than in the 12°C group (Fig. 6), we examined whether the observed differences of parasite DNA contents between the temperature groups are related to the differences of kidney size. To this end, copy numbers of parasite DNA were normalized against a unit fish instead of kidney DNA concentration, i.e. we converted μg 18S rDNA/2 μg total DNA to 18S rDNA/fish. However, this conversion did not result in a different pattern of parasite DNA development in the infected fish (data not shown).
Mortalities of PKD-infected rainbow trout at rearing temperatures of 12°C and 18°C
Cumulative mortalities varied significantly with water temperature (Fig. 8). While 77·1% of the infected fish died at 18°C, cumulative mortality was only 5·6% in the 12°C treatment.

Fig. 8. Infection Exp. II – cumulative mortality of Tetrascapsula bryosalmonae-infected fish kept at different temperatures. The arrow indicates the time-point when fish were subdivided into 2 groups.
DISCUSSION
Quantification of T. bryosalmonae DNA by real-time PCR
We established a real-time PCR to quantify the parasite load of T. bryosalmonae in kidneys of trout using an 18S rDNA sequence of the parasite. Using variable regions of the conserved 18S rDNA has shown to be suitable for species identification and has therefore been widely used for the detection and identification of different myxozoans e.g. Ceratomyxa shasta (Palenzuela et al. Reference Palenzuela, Trobridge and Bartholomew1999; Hallett and Bartholomew, Reference Hallett and Bartholomew2006), Myxobolus cerebralis (Baldwin and Myklebust, Reference Baldwin and Myklebust2002) and also T. bryosalmonae (Saulnier and De Kinkelin, Reference Saulnier and De Kinkelin1997; Kent et al. Reference Kent, Khattra, Hervio and Devlin1998; Morris et al. Reference Morris, Morris and Adams2002; Tops et al. Reference Tops, Curry and Okamura2005). To establish the real-time PCR we cloned a PCR product of the PCR by Kent et al. (Reference Kent, Khattra, Hervio and Devlin1998) into a vector and sequenced the cloned region to verify the specificity for T. bryosalmonae. Forward and reverse primers for the real-time PCR were designed to amplify a 73 base-pair region in the selected 18S rDNA sequence. Alignment using BLAST search (www.blast.ncbi.nlm.nih.gov) was performed to identify homology of the primer and probe combination to other genetic sequences to exclude non-specific amplification. No corresponding sequence was found. Specificity was also underlined by the result that none of the uninfected control fish showed a positive result.
The advantage of amplification of a multicopy gene such as the 18S rDNA of T. bryosalmonae analysed in the present study is that it should provide high sensitivity (Hallett and Bartholomew, Reference Hallett and Bartholomew2006). However, a prerequisite to using a multicopy gene for quantification of parasite numbers is the implicit assumption that the same number of copies of the gene per nucleus is present in all parasites. To estimate whether the real-time PCR indeed reflects changes in parasite numbers – instead of changes in 18S rDNA-copy-numbers per parasite-, we compared the PCR results with the number of immunohistochemically detectable parasites in kidney sections of the same fish. In general, a good correlation was found, supporting the reliability of the PCR quantification method. Exceptions existed for fish with very strong or very low (in terms of DNA concentrations) infection: in both cases, PCR and immunohistochemcial results showed a poor correlation. In histological sections of heavily infected fish, parasites were often found clustering together while areas adjacent to these clusters appeared more or less parasite-free. This results in a rather imprecise estimate of parasite numbers per section when evaluated by immunohistochemistry. Similarly, in fish with very low infection levels and few parasites present in the kidney, histological examination may miss the unevenly distributed parasites. In contrast, PCR methodology, which relies on tissue extracts, is less sensitive to heterogenous micro-spatial distribution of the parasites within the kidney, and therefore is likely to provide a more accurate estimate of parasite intensity than immunohistochemistry in kidneys with very high or very low parasite loads.
Infection phase in the river system
Trout exposed to river water known to be endemic for PKD showed an infection prevalence of 100% after 14 days. This high prevalence of parasite-positive fish after 14 days in the first experiment caused us to shorten the river exposure period in Exp. II. In the latter experiment, 100% prevalence was achieved within the 5-day exposure period. This finding suggests that infection of fish by T. bryosalmonae under natural conditions takes place rather quickly, which has also been shown by Longshaw et al. (Reference Longshaw, Le Deuff, Harris and Feist2002). Interestingly, copy numbers of parasite DNA at termination of the river exposure were comparable in the 2 experiments (104–105 copies per 2 μg total kidney DNA), although the length of exposure was different in the 2 experiments. This result may be explained by a higher infection pressure in the second year of exposure, or it may indicate that the parasite level in the fish host depends less on the accumulation of spores from the environment and more on the parasite proliferation in the fish host.
How do renal concentrations of parasite DNA change with time and water temperature after transfer of fish into the laboratory?
Several publications addressed the question of temperature influence on the proliferation of parasites in fish hosts. Growth and development of other parasites in fish have been shown to be directly correlated to water temperature over a range of 9–25°C, e.g. for Ichthyophthirius multifiliis (Noe and Dickerson, Reference Noe and Dickerson1995). Also monogenean parasites of fish (Tubbs et al. Reference Tubbs, Poortenaar, Sewell and Diggles2005; Lackenby et al. Reference Lackenby, Chambers, Ernst and Whittington2007) or parasitic arthropods like sea lice (Costello, Reference Costello2006) develop faster at higher temperatures. With respect to the proliferation of T. bryosalmonae in the fish host, Kent and Hedrick (Reference Kent and Hedrick1986), Hedrick et al. (Reference Hedrick, MacConnell and de Kinkelin1993) and Bettge et al. (Reference Bettge, Wahli, Segner and Schmidt-Posthaus2009) observed by means of light microscopy and immunohistochemistry that the number of parasites visible in the tissue sections increases during the course of infection. To date, no studies have been published which quantified parasite proliferation in the fish host in relation to the water temperature. However, increasing water temperature has been shown to increase the proliferation of T. bryosalmonae in the invertebrate host, the bryozoans (Tops et al. Reference Tops, Lockwood and Okamura2006).
In the 2 experiments of this study, we observed an initial phase of parasite proliferation that lasted for 20 to 30 days post-infection, independent of the temperature that fish were exposed to. After that phase, parasite augmentation slowed down and tended to achieve a satiation plateau or even showed a slight decrease (18°C treatment). Similar patterns of parasite proliferation were described for Spironucleus barkhanus (Diplomonadida: Hexamitidae) in Salmo salar (Guo and Woo, Reference Guo and Woo2004). In trout suffering from PKD, the phase of the highest parasite intensity coincided with the phase of maximal kidney swelling and with the clinical disease phase.
A major aim of our study was to examine whether and how water temperature modifies the parasite proliferation in the fish kidney. The findings from the 2 experiments suggest that temperature does not so much influence the amount of parasite DNA in the fish during the clinical disease phase, but has its main influence on the kinetics of parasite proliferation. The evidence supporting this interpretation comes from the observation that in Exp. I, when the fish were maintained over an extended period at the same water temperature, the subsequent transfer to different temperatures had no significant effect on the parasite DNA copy numbers in the kidneys. In contrast, in the second experiment, where fish were exposed to different water temperatures immediately after the infection phase in the river, different slopes in the increase of parasite DNA were seen during this proliferation phase. In the 12°C group, the proliferation phase was fairly short, with parasite DNA levels not increasing significantly anymore from day 19 p.e. onwards until the end of the experiment. In the 18°C group, however, parasite DNA levels increased significantly over a longer period until reaching a peak at day 26 p.e., followed by a decline of parasite numbers to levels that were no longer significantly different to the 12°C group. Thus, the low temperature was characterized by an increase in DNA levels until they reached a constant value while at the high water temperature, DNA levels peaked and then declined. The decrease of parasite DNA at the high water temperature is probably not the result of an enhanced elimination of the parasite via urine, but appears to result from an onset of degradation of parasites (Bettge et al. Reference Bettge, Wahli, Segner and Schmidt-Posthaus2009) in the interstitial tissue as well as resident sporogonic parasites in the tubules. This hypothesis is also supported by the high inter-individual variation in copy numbers at the last sampling point of the 18°C group.
What is the relation between temperature and disease-associated mortality?
The aforementioned observation on the influence of temperature on parasite proliferation and intensity leads to the question of how this relates to the temperature influence on mortality of PKD-infected fish. Our results show that PKD-induced mortality was significantly different between all temperature groups, both in Exp. I and Exp. II (Fig. 9). Our findings are well in agreement with published data showing that PKD evokes highest mortalities at temperatures of 15°C or above (Ferguson, Reference Ferguson1981; Clifton-Hadley et al. Reference Clifton-Hadley, Richards and Bucke1986; Hedrick et al. Reference Hedrick, MacConnell and de Kinkelin1993). The pronounced effect of temperature on mortality is in contrast to the less pronounced temperature effect on parasite DNA in the fish kidney. These findings suggest that it is not the mere number of parasites in the host kidney that is the main causative factor for the PKD-induced mortality.

Fig. 9. Comparison of the copy numbers of parasite DNA per 2 μg of total DNA with the cumulative mortality at the end of the experiment. Data are plotted for day 47 for 12 and 18°C and day 49 for 14, 16 and 19°C.
If temperature-related differences of mortality show no direct correlation with renal parasite loads other, probably more indirect factors, appear to be responsible. An important factor could be the intensity of kidney lesions, which are, more pronounced at 18°C than at 12°C (Bettge et al. Reference Bettge, Wahli, Segner and Schmidt-Posthaus2009). The advanced pathological reaction of the kidney might be related to an enforced immune reaction of the fish kept at 18°C as reported for other fish diseases as well (Le Morvan et al. Reference Le Morvan, Troutaud and Deschaux1997; Köllner and Kotterba, Reference Köllner and Kotterba2002; Nikoskelainen et al. Reference Nikoskelainen, Bylund and Lilius2004; Pérez-Casanova et al. Reference Pérez-Casanova, Rise, Dixon, Afonso, Hall, Johnson and Gamperl2008). The immune response then would lead to a proliferation of the interstitial tissue and to a regression or displacement of glomeruli and tubules. These pathological changes are likely to cause kidney dysfunction and could thereby compromise the capability of the fish for osmoregulation, and/or haematopoiesis. This might be fatal as the higher water temperatures impose increased functional demands on both osmoregulation and respiration. Osmotic water inflow into the fish is probably elevated at the higher water temperature, which challenges the damaged kidney with an increased need for water excretion. Similarly, high water temperature leads to an increased oxygen demand due to the combination of elevated metabolism and reduced ambient oxygen levels. This demand can possibly not be met due to the reduced haematopoietic capacity of the damaged kidney tissue as evidenced by the marked anaemia in the clinical phase of the PKD.
In conclusion, this study provides evidence that the parasite undergoes its main proliferation phase during the first 20 to 30 days after infection. Temperature modulates parasite proliferation particularly during this phase. At a later phase, the amount of parasite DNA in all temperature groups approached similar levels except at 12°C. The main proliferation of parasite DNA occurred before the onset of mortalities due to PKD. While the present study confirms the temperature dependency of PKD-induced mortalities, the results of this study argue against a direct relationship between parasite intensity and fish mortality. It appears that a combination of parasite induced renal dysfunction – due to a strongly enhanced host response at higher water temperatures – together with temperature related increasing demands on kidney function may ultimately cause the death of T. bryosalmonae-infected fish.
We thank Ursula Forster for performing the immunohistochemisty, Ursula Sattler for assisting with the real-time PCR, and the staff of the histology laboratory of the institute for preparation of the histological sections. Patricia Holm is acknowledged for helpful comments and discussion.


