INTRODUCTION
Dictyocaulus viviparus (Nematoda: Dictyocaulidae) is a rather common trichostrongylid nematode parasite in the lungs of grazing cattle in temperate climates (Eysker, 1994). In a recent Swedish survey 40% of the herds were found to be infected (Höglund et al. 2004b). Cattle are infected by ingesting grass contaminated with larvae through faecal transmission, and this might induce a very pathogenic respiratory disease, dictyocaulosis (Schnieder et al. 1991). Although outbreaks of dictyocaulosis are sporadic, they have an economic impact due to production losses both in dairy and beef herds in Europe. The cost of control of a moderate outbreak in a dairy herd with 100 cows in the UK has been calculated at 30000–35000 € (Woolley, 1997). Unlike the situation in other trichstrongylids of veterinary importance, development of resistance to anthelmintics has not yet been reported.
The dispersal of the bovine lungworm D. viviparus has received attention in recent years in Sweden, in order to better understand and predict the risk of spread. With increased knowledge about the transmission biology it is possible to target weak points in the life-cycle and hence to improve current control methods. Clearly, a better understanding of the transmission patterns of D. viviparus could assist in the effective control of this important parasite. Ultimately this should lead to a reduction in the number of outbreaks of disease.
Although wildlife ruminants sometimes are infected by Dictyocaulus lungworms, both moose and roe deer are infected solely with different species closely related to D. viviparus but that are not infective to cattle (Divina et al. 2000; Divina and Höglund, 2002; Höglund et al. 2003). Thus, wildlife do not serve as reservoirs and are not involved in the transmission cycle of D. viviparus in Sweden. We are therefore now concentrating on how D. viviparus is transmitted both within and among cattle herds. Interestingly, dictyocaulosis in Sweden is sometimes encountered in relation to livestock movements between farms. There is then usually considerable confusion as to whether an outbreak is a result of the sudden introduction of the parasite into a susceptible (i.e. immunologically naive) herd, or introduction of susceptible stock into an immune herd with a low (subclinical) infection level. This is an issue of great practical importance to farmers that needs to be clarified.
Knowledge about the population genetic structure has previously been used to address questions regarding the dispersal of nematode parasites of livestock. For example, Blouin et al. (1995) showed, using mitochondrial DNA (mtDNA) sequence data, that nematode parasites of domestic livestock exhibited a low degree of population genetic structure compared to those of wildlife ruminants in the USA, attributing this to gene flow influenced by host movements. Alternatively, Leignel and Humbert (2001) found considerable gene flow in French trichostrongylid nematode populations in the absence of any obvious host movements. However, it can be hypothesized that if D. viviparus is transported frequently between herds together with infected hosts then a high rate of gene flow between different populations would be expected, and multiple introductions of nematodes into farms may be occurring. For this reason it is important to have a detailed understanding of the genetic diversity and structure of bovine lungworm populations.
Recent advances in molecular technologies have provided several DNA-based markers capable of revealing patterns of sequence variation among nematode populations. Amplified fragment length polymorphism (AFLP) is an example of a rather new multiple-locus (i.e. whole-genome) fingerprinting technique (Vos et al. 1995) that, because of high replicability and ease of use, has been used to study the structure of genetic diversity in a range of organisms, including parasitic nematodes. In a previous study of the population genetics of D. viviparus using AFLP (Höglund et al. 2004a), we demonstrated that there is considerable genetic variation within this species characterized by a high degree of structure and a high FST value (which measures the proportion of variation within populations compared to that between populations). However, this dominant whole-genome marker showed a great deal of variability, which made it difficult to discern the overall pattern of genetic relationships between farms (Morrison, 2005). It is thus necessary to compare these results to those from alternative genetic markers, which may be more appropriate for our purposes.
Preliminary results show that the AFLP patterns are in agreement with those from a study based on sequence variation in the cox1 gene of mtDNA, as revealed by single-strand conformation polymorphism (SSCP) (Hu et al. 2002c). However, although the patterns in the population genetic structure are basically the same, the population estimates are considerably different between the two methods, presumably at least partly due to the different inheritance patterns (predominantly maternal for the mtDNA and predominantly bi-parental for the AFLP). This suggests that a detailed comparison of the whole-genome AFLP and mitochondrial sequence data is warranted.
In the present study we thus compared the genetic variation and structure of D. viviparus in Sweden by using different molecular markers applied to exactly the same set of worms. Since different rates of evolution often occur in different regions of nematode mtDNA genomes (Blouin, 1998), and because mitochondrial data derived from a single locus can lead to ambiguous conclusions (Anderson, 2001), we collected new data for 4 separate genes of the mitochondrial genome (cox3, nad5, rrnL, trna). This allowed us to both qualitatively and quantitatively compare the use of dominant DNA fingerprints (i.e. AFLP) and replicated mtDNA sequences for estimating the genetic diversity and population structure in a nematode parasite, which has not been done before for any such species. In particular, we were interested (i) in assessing which of the markers is most informative about the most recent history of the lungworm populations and (ii) in elucidating the pattern of recent introductions of this parasite onto Swedish farms. We have also compared our results with published results from other nematodes of veterinary interest, in order to place these findings into a broader context.
MATERIALS AND METHODS
Genotypes
A total of 72 worms was sampled, representing 8 worms from each of 8 geographically separated farms from south-central Sweden plus 1 strain that has been maintained in the laboratory for several decades, as described by Höglund et al. (2004a). Each of these 9 isolates represents a different population. Total DNA was isolated mainly using the QIAamp DNA Mini kit (Qiagen), and was then prepared both for analysis of amplified fragment length polymorphism (AFLP) patterns and for direct sequencing of 4 genes from mitochondrial DNA (mtDNA). The AFLP techniques and data have been described by Höglund et al. (2004a), whereas all of the mtDNA data are newly reported here.
Mitochondrial DNA
Long-PCR according to the protocol of the Expand Long Template PCR System™ (Roche) was conducted with primers described by Hu et al. (2002b) and the products were sequenced in order to design the primer combinations listed in Table 1. These were then used to produce polymerase chain reaction (PCR) amplicons. The 25 μl reaction used 10 pmol of each primer, 0·2 mM of each dNTP, 10 mM Tris-HCl pH 8·3, 50 mM KCl, 1·5 mM MgCl2, 0·001% gelatin, 0·5 U AmpliTaq polymerase, and 3 μl of DNA template. The reactions were run on a PTC-200 DNA engine (MJ Research), at 94 °C for 2 min, 30×[94 °C for 45 sec, 40 °C (nad5); 48·4 °C (cox3); 40·5 °C (trna); 41·7 °C (rrnL) for 45 sec, 72 °C for 1 min], 72 °C for 7 min. Before cleanup, 3 μl of the PCR-product was loaded onto a 1% agarose gel containing ethidium bromide to control the PCR reactions. The PCR products were then purified using Montage PCR96 Cleanup Kit™ (Millipore) according to the manual, and resuspended in 30 μl of nuclease-free water.
Table 1. Primers used in this study to amplify individual genes and a tRNA region from mitochondrial DNA (All primer designs were based on sequence data originating from Long-PCR products of the mitochondrial genome of Dictyocaulus viviparus.)

The purified PCR-products were sequenced using the same primers as for the PCR-reaction, and in both directions. One μl of Big Dye Terminator v. 3.1 (Applied Biosystems, ABI), 5 pmol primer, 0·5 μl of sequencing buffer (ABI's 5× solution) were mixed and 1·5 μl of PCR-product (approximately 20–40 ng) was added. Sequence reactions were carried out at: 96 °C for 1 min, 25×[96 °C for 10 sec, 50 °C for 5 sec, 60 °C for 4 min]. The sequencing products were purified using Montage Seq96 Sequencing Reaction Cleanup Kit (Millipore) as above. The samples were injected and separated on an ABI Prism 3100 Genetic Analyzer (ABI).
Data analysis
The (AFLP) patterns were generated using 4 primer combinations (A–D), as described by Höglund et al. (2004a). The data analyses for the degree of polymorphism of each population, determined as haplotype diversity (H), and the estimates of genetic structures (FST and GST) are also reported by Höglund et al. (2004a). As an estimate of the genetic relationships among the haplotypes, a neighbour-net network was generated (Morrison, 2005), based on the pairwise distances provided by Höglund et al. (2004a).
Sequence data from the mtDNA were processed using ContigExpress in the Vector NTI Advance™ 9.0 (Informax™) suite of programs, aligned using the default options of ClustalW 1.83 (Higgins and Sharp, 1988), and manually edited using MacClade 4.06 (Maddison and Maddison, 2000). Descriptive statistics for mtDNA sequence polymorphism and structure estimates were calculated using DnaSP 4.10 (Rozas and Rozas, 1999). We estimated nucleotide diversity (Pi) within and between isolates, and this was calculated for each of the 4 genes separately and when all sequences were combined. Various estimates of the average levels of gene flow between the isolates were computed: FST, Wright's fixation index, and the associated Nm value for the migration rate (Hudson et al. 1992); GST, based on haplotype diversity (Nei, 1973); and NST, based on nucleotide diversity (Lynch and Crease, 1990). Separate analyses were conducted both when sequences for the laboratory isolate were included and excluded. Fu's Fs (Fu and Li, 1993) and Tajima's D (Hudson et al. 1987) were also computed as tests of selective neutrality. As an estimate of the genetic relationships among the haplotypes, a minimum spanning network was generated using Arlequin 2.0 (Schneider et al. 2000), based on the uncorrected pairwise differences.
All of these analyses assume genetic equilibrium and free interbreeding, which are untestable with our data. Furthermore, the assumption that the AFLP data are dominant markers makes it difficult to assess Fis, the interbreeding coefficient, which would be a valuable adjunct to the interpretation of the results.
RESULTS
Mitochondrial DNA analysis
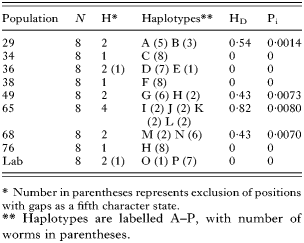
A total of 16 mtDNA haplotypes was identified among the 72 worms, with all sequence data combined and alignment gaps included as a fifth character state (Table 2). An average of 1·9 haplotypes were found per farm, with a maximum of 4 haplotypes in farm 65 which had a haplotype diversity of 0·82. Only one haplotype was found on more than one farm (farms 49 and 76), which shared haplotype H. Three farms (34, 38, 76) were each infected only with worms representing a single haplotype.
Table 2. Genetic diversity estimates of Dictyocaulus viviparus populations based on mtDNA sequences (Number of individuals (N), number of unique haplotypes (H), haplotype diversity/heterozygosity (HD) and nucleotide diversity (Pi), for all worms in 9 populations.)
A total of 1542 nucleotides were sequenced across the four genes (Table 3), with no length variation amongst individuals for the protein coding genes and only minor variation for the RNA genes. However, only 52 aligned sites (3·4%) were variable, leading to overall haplotype and nucleotide diversities of 0·91 and 0·0090, respectively. There was more nucleotide variability within the protein-coding genes (cox3 and nad5) than in the structural RNA genes (rrnL and trna) (chi-square test, P<0·001). Thus, the nucleotide diversity was also higher in the protein-coding genes (Table 3). However, the number of haplotypes was similar across all of the genes, in the range 6–10. The base composition was heavily biased towards A and T in all genes (Table 3), with a slightly higher bias in the third codon position for the protein-coding genes. Tajima's D did not differ significantly from 0, suggesting selective neutrality of the observed mitochondrial nucleotide polymorphism. Fu's Fs statistic varied a lot depending on the gene, with a large positive value for cox3 but a negative value for trna (Table 3).
Table 3. Analysis of DNA polymorphism for mitochondrial genes of Dictyocaulus viviparus (Number of nucleotides and variable sites, total number of unique haplotypes (H), variable sites and haplotype diversity (HD) and nucleotide diversity (Pi) per site, as well as Fu's neutrality statistic (Fs) and Tajima's D.)

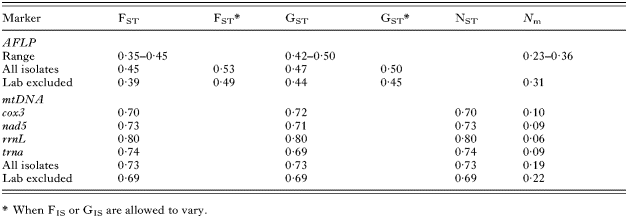
Overall genetic structure was strong, with population estimates of FST, GST and NST, consistently in the range 0·7–0·8 (Table 4). All of these genetic structure estimates were highly correlated, and in most instances they showed the same values. The estimates of structure decreased only slightly when the laboratory isolate was excluded (Table 4), indicating that it is the field isolates that are strongly structured. These observations were supported by very low estimates of gene flow (Nm) among the field isolates (Table 4), indicating that there is effective genetic isolation among these populations.
Table 4. Gene flow estimates from nuclear (AFLP) and mitochondrial sequence (mtDNA) data of Dictyocaulus viviparus (Wright's fixation index (FST), allele/haplotype diversity (GST), nucleotide diversity (NST), and the effective number of migrants (Nm). For both markers the results are shown for all isolates and when the laboratory isolate is excluded. The range for the AFLP marker is for all primer combinations. For the AFLP data we also show alternative structure estimates based on different population assumptions.)
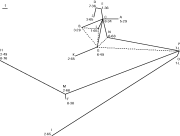
The hypothesized genetic relationships among the 16 mtDNA haplotypes are illustrated in Fig. 1. This shows that the Swedish samples formed at least 3 genetic groups that were no more similar to each other than they were to the laboratory sample (which came originally from the Netherlands). One genetic group contained the majority of the field-sampled worms (42 out of 64), which presumably represents differentiation among worms from a common genetic source. Within this group, only 1 farm (34) had a single worm haplotype, with 2 of the farms (29, 36) each having 2 haplotypes. However, each haplotype in this group was restricted to a single farm, which is what creates the strong genetic structure observed in the summary statistics.

Fig. 1. Minimum spanning network of the Dictyocaulus viviparus mitochondrial haplotypes based on the uncorrected pairwise nucleotide differences. The haplotypes are lettered as in Table 2, along with a pair of numbers, the first number representing the number of individual worms with that haplotype and the second representing the source farm (or L for the laboratory strain). The length of the lines represents the amount of genetic difference between the haplotypes, with the scale indicating one nucleotide difference. The dashed lines represent alternative genetic relationships among the haplotypes.
The second genetic group had 2 distinct subgroups of haplotypes. One of these (labelled H) was the only haplotype to occur on more than one farm (farms 49, 76), and this may thus indicate a recent movement of the worms between these farms. Two of the farms within this group (38, 76) had worms with a single haplotype, which may indicate a relatively recent introduction of these worms into these farms. The third genetic group had a single haplotype (labelled I), with only 2 worms. Both the second and third groups contained worms that came from farms (49, 65, 68) that also had haplotypes from the first group, which suggests that these 3 farms have had multiple introductions of D. viviparus. Indeed, even the 3 haplotypes from group 1 found on farm 65 were quite different from each other, making this farm very unusual.
Comparison with AFLP analysis
The genetic diversity values for the AFLP data were much higher (0·12) than were the values for the mtDNA data (0·01). Furthermore, the estimates of population structure from the mtDNA contrasted markedly with the results from the analysis of the AFLP data (Table 4). The structure estimates from the AFLP data were much smaller (0·4–0·5) than were the estimates from the mtDNA (0·7–0·8), and the migration estimates were consequently much higher. Thus, the whole-genome AFLP data suggest that there was much less differentiation of D. viviparus among the Swedish farms than in the mitochondrial sequence data.
This result is at least partly predictable from theoretical considerations, as the mtDNA values are expected to be greater than those for nuclear genes because mtDNA is haploid and usually maternally inherited, so that the effective population size is only one-quarter that of the nuclear DNA. However, the difference between our whole-genome AFLP data and our mtDNA data is not what would be expected from these considerations. In particular, the structure values (FST and GST) for the mtDNA are smaller than would be predicted from the AFLP data and the migration values (Nm) are consequently larger than would be expected (Table 4). We thus conclude that the two markers are providing quantitatively different estimates of the genetic diversity and structure of the D. viviparus populations, even after correcting for the difference in inheritance patterns.
This contrast between the results from the two marker types was confirmed by the network analysis, which is shown in Fig. 2b of Morrison (2005) for the AFLP data. This showed reasonably clear differentiation among the 9 isolates, representing the genetic isolation of each population, but it also emphasized the complexity in the pattern of shared AFLP characters among the samples, with an anastomosing plexus of interconnections among the worms. This presumably represents inter-relationships among the populations due to gene flow. Moreover, there were clearly individual worms from several of the farms that shared genetic characters in common with several of the worms from other sources. For example, there were 2 worms from farm 65 that were linked to all of the worms on farms 49 and 68 while the other farm-65 worms were not, and there was one individual from farm 34 that was genetically linked to the worms from the laboratory isolate. There were thus much stronger genetic inter-relationships among farms shown by the whole-genome AFLP data than by the mtDNA sequence data. This makes it much more difficult to discern the patterns of the most recent history of the parasite haplotypes, and the relationships between farms are basically unresolved.
DISCUSSION
We have assessed the population genetic structure of D. viviparus by analysing 2 different sets of genetic markers, using exactly the same set of 72 worms from 1 laboratory-maintained strain and 8 Swedish field isolates. There is qualitative agreement between the two markers, indicating relatively strong genetic differentiation among the Swedish farms. However, there are quantitative differences in the diversity and structure estimates, with the whole-genome AFLP data suggesting that there is less differentiation than in the mitochondrial sequence data. That is, the summary structure statistics from the mtDNA data have values that are not simply products of those from the AFLP data (e.g. predictable from the assumed inheritance patterns). The AFLP data thus seem to be of less practical use for studying the most recent population history of these parasites, with clearer patterns of recent transmission being deducible from the mtDNA data.
The 4 gene sequences from the mitochondrial genome showed consistent patterns, although there was more genetic variation detected in the protein-coding genes than the non-coding genes. Furthermore, the detailed analysis of the mtDNA data indicates some interesting patterns of variation among the Swedish farms. First, there appear to be at least 3 distinct genetic groups of D. viviparus infecting Swedish cattle, 1 of which is predominant and shows considerable differentiation between farms but not necessarily within farms. Second, the 2 smaller genetic groups occur on farms where the predominant group also occurs, suggesting that these farms have had multiple introductions of D. viviparus.
Although recently there has been a dramatic increase in the number of comparative studies of the genetic variation within populations of parasitic nematodes based on molecular approaches, the information available is still limited. Most studies are restricted to results from mitochondrial sequences, as there are several distinct advantages (Hu et al. 2004). First, mtDNA is usually considered to be inherited maternally without recombination. Second, mitochondrial genomes of nematodes are neutral markers that evolve quickly and that normally exhibit greater population differentiation than do nuclear genes (Thomas and Wilson, 1991). Although there are differences in mutation rates between disparate species (Blouin et al. 1997; Denver et al. 2000), sequence variation between closely related nematodes has been estimated to be in the range of 10–20% among individuals of different species, whereas the variation within individuals of inbreeding populations is typically 1–3% (Blouin, 1998). This is of the same magnitude as for the mtDNA genes of D. viviparus in the present study (2–6%).
However, there is also rate heterogeneity among different mitochondrial loci (Blouin, 2002). This somewhat complicates a direct comparison between our results and those from previous studies. Nevertheless, we were able to show that the rate of nucleotide substitution was different among the mitochondrial loci studied here. In accordance with previous results from the human hookworm (Hawdon et al. 2001), both of the protein-coding mtDNA genes of D. viviparus (cox3 and nad5) evolve more quickly than do the structural genes (rrnL and trna). The protein-coding genes are thus the most useful for studying the recent history of the parasites.
Our mitochondrial results agree with those from a previous study of polymorphism in the cox1 gene alone (Hu et al. 2002c), based on a sample of 252 worms from 17 populations in Sweden. The HD (0·77), Pi (0·01) and NST (0·66) values re-estimated from their data are very similar to those from our 2 protein-coding sequences. Our results thus extend this previous result, as well as providing a direct comparison with the AFLP data. We thus conclude that our results are general for the mitochondrial genes of this parasite species, at least in Sweden. The different genetic structure observed in D. viviparus in Sweden compared to parasites of livestock elsewhere (see below) thus requires explanation.
The protein-coding gene cox1 is one of the most conserved mitochondrial genes in nematodes (Okimoto et al. 1992; Hu et al. 2002a). This facilitates the use of universal primers, and it is probably also the major reason why most previous studies of genetic variation within natural populations of nematodes have been confined to the 3′ end of the cox1 or nad4 genes (Table 5). Considerable degrees of variation have been detected, but there are considerable differences between the two genes (Morrison and Höglund, 2005). For most domesticated species the polymorphism observed has been associated only with moderate to low levels of genetic structure (summarized in Table 5). In particular, the genetic structure of trichostrongylids of ruminants is characterized by ultralow structure (NST≈0·02). Blouin et al. (1998) showed that some trichostrongylid taxa of domestic ruminants were less structured than those from wildlife because of extremely large effective population sizes (Ne), which in combination with extensive livestock movements created a situation where all worms formed one large panmictic population. From this it seems likely that livestock movements may be major determinants of the population genetic structure of nematode parasites of domestic livestock. This contrasts sharply with our present findings on the genetic variability and structure of D. viviparus, which is highly structured irrespective of whether the whole genome (AFLP) or just the mitochondrial genome is examined.
It is unlikely that a simple explanation will uncover the mechanism(s) generating the pattern of genetic structure observed in this paper. It has been suggested that haplotype and nucleotide diversity can be considered as a function of effective population size (Ne), which in turn is proportional to the number of breeding females (Birky et al. 1983). Indeed the population genetic differences between D. viviparus and many of the parasitic nematodes that have been studied so far have been attributed to major differences in Ne (Höglund et al. 2004a). However, as pointed out by Hawdon et al. (2001) and reviewed by Criscione et al. (2005), Nes are often difficult to predict. This was the reason why we decided to increase the number of mitochondrial genes that we sampled in the present study, which has not been done before for field samples of strongylid nematodes (cf. Table 5).
Table 5. Genetic diversity and structure estimates for mitochondrial gene sequences mainly of strongylid nematode parasites of animals (Number of samples (N), populations (Pops) and haplotypes, along with estimates of genetic diversity (HD and Pi) and genetic structure (GST and NST). In most cases the statistics have been re-calculated from the original data using the DnaSP program.)

Although it has been pointed out that life-history traits such as the mating system determine and shape the genetic structure of free-living nematode populations (Graustein et al. 2002), most life-cycle details other than dispersal ability have been largely ignored when it comes to nematode parasites of animals. It is well known that extreme bottlenecks result in loss of genetic variation (Nei and Tateno, 1975). Unlike many other parasitic nematodes of humans and livestock, D. viviparus has poor survival on pasture (Borgsteede et al. 1994). Thus, very high mortality rates especially during winter allow for strong selection. This will probably maintain genetic differences among populations, and may explain the reduced diversity and unusual structure observed in D. vivparus in Sweden. However, we found no consistent evidence of selection acting on the mtDNA sequences; and it remains to be tested whether the patterns we have observed are unique to Sweden or also occur in D. viviparus in other geographical areas.
Although data on genotypic variation in nematodes still are limited to a few species, Wakelin et al. (2002) suggested that polymorphism is likely to be less in laboratory isolates of a restricted origin that are maintained by routine passages. Interestingly, we could find no support for this in the present study. This result is in accordance with that of Roos et al. (1990), who studied the variability in several generations of Haemonchus contortus following selection with increasing doses of anthelmintics. Similarly, no apparent loss of variability was observed in laboratory-maintained populations of the parasitic nematodes Trichostrongylus colubriformis (Grant and Whitington, 1994), Cooperia oncophora (van der Veer et al. 2003), and Heligmosomoides polygurus (Abu-Madi et al. 2000). Although these observations do not exclude the possibility of genetic drift, they show that the consequences of selection of laboratory-maintained isolates are no different in practice from what these parasites experience in the field.
The genetic marker that has offered the most insight into the evolutionary history of a wide variety of animal taxa is the mtDNA molecule (Avise et al. 1998). However, one disadvantage associated with mtDNA is that it constitutes a single genetic locus that represents only an infinitesimal percentage of the overall genome, which may lead to misleading conclusions. Recent advances in the application of molecular technology have greatly increased the number of DNA-based markers capable of disclosing genetic patterns within nematode parasite populations. AFLP is one such approach that has been used to assay molecular variation for population genetic studies in many different organisms. However, there are no guarantees that different molecular markers will yield the same view of the population structure, even within the same species. Therefore, we decided to compare the outcome based on information from different marker techniques, i.e. mtDNA sequences and whole-genome AFLP patterns, based on DNA samples from the same individuals.
A direct comparison of whole-genome AFLP markers and mitochondrial sequences is not always straightforward. This is partly due to differences in the inheritance patterns and mutation rates between the nuclear and mitochondrial genomes (Buonaccorsi et al. 2001), but it also occurs because AFLP data are limited by the lack of complete genotypic information resulting from dominance (Yan et al. 1999). If the difference between our AFLP and mtDNA data was due entirely to the different inheritance patterns (maternal vs bi-parental, haploid vs diploid), for example, then there would be a simple mathematical relationship between the two markers, such as might be predicted from Wright's island model (Page and Holmes, 1998). Since no such relationship is obvious, we conclude that some other factor is operating, such as unequal sex ratios, unequal migration rates for the sexes, assortative mating, or confounding effects due to dominance of the AFLP markers, or perhaps the fact that AFLP bands do not necessarily encode functional gene products (Vos et al. 1995).
Although AFLP yield highly variable molecular fingerprints, for our identical D. viviparus DNA samples the AFLP data revealed much more genetic variability than did the mtDNA data. Thus, there were 281 variable ‘loci’ for the AFLP data but only 52 such ‘loci’ for the sequence data. However, there is no doubt that nucleotide-based sequences assess molecular variation at the highest level of detail. For example, the results from the mtDNA analysis revealed evidence of genetic exchange between different populations, and indicated that some of the farms (e.g. farms 49 and 65) must have been infected on repeated occasions since they harboured worms from different haplotype clusters. This result is in agreement with Creer et al. (2004), who found that in spite of a high degree of similarity between generic datasets from the bamboo viper, the AFLP phylogenetic analysis did not support the mtDNA phylogenetic tree.
Taken together, the observed patterns of high genetic structure between various isolates of D. viviparus indicate that there is little genetic interchange between populations. Based on information from the genetic analysis we can make predictions about the dispersal patterns of the parasite, which is a useful tool and of great help in the overall management and control of D. viviparus. However, there is no doubt that the information should be treated with care as somewhat different patterns were obtained using different methods. Still, the increased knowledge about the population genetic structure has provided us with some ideas on how D. viviparus is spread and maintained in the host populations. We are addressing these in our ongoing research.
Project funding was provided to J. Höglund by FORMAS 22.0/2004-0432.