INTRODUCTION
Phylogeographical research has shown that species are composed of geographically structured populations (Avise et al. 1987; Avise, 1994). However, few studies have compared the genetic structure of hosts and parasites in a phylogeographical framework (e.g. Nadler et al. 1990; Althoff & Thompson, 1999). In this paper, we explore the population structure of 2 species of mice from the genus Peromyscus (Rodentia: Muridae) and their respective parasites from the genus Cuterebra (Diptera: Oestridae).
Flies of the genus Cuterebra are distributed throughout most of the temperate and tropical parts of the New World (Wood, 1981; Sabrosky, 1986). Their larvae infest the skin of living rodents, lagomorphs and monkeys, and perhaps other mammals as well, causing in turn myiasis. The female Cuterebra lays its eggs on the vegetation or the soil. When a potential host passes nearby, the heat of its body stimulates the hatching of the eggs. The small larva then enters the body of its host through any moist natural openings (i.e. nostrils, eyes, mouth, anus, and urogenital orifices) or skin lacerations. After a short internal migration, the parasite reaches its final development site under the skin, where it will complete its growth in a warble, breathing via a small opening in the skin and feeding on the host's dead or living tissue, liquid body-substance, or ingested food (Zumpt, 1965). Three weeks later, the larva reaches full maturity, exits the host through the breathing hole and crawls into the soil where it will pupate over winter. The adults then emerge in the following spring (Catts, 1982).
Cuterebra fontinella and Cuterebra grisea are sister-species (Hunter & Webster, 1973) with partially overlapping geographical distributions. Whereas C. fontinella is distributed from Southern Canada to Mexico, the range of C. grisea covers all of Canada and Northern USA (Sabrosky, 1986). When found in sympatry, it is quite difficult to tell them apart using morphological characters alone (Sabrosky, 1986). Cuterebra fontinella and C. grisea are believed to parasitize the White-footed Mouse (Peromyscus leucopus) and the Deer Mouse (P. maniculatus), respectively (Sabrosky, 1986). However, this presumed host-specificity is poorly documented, partly because of the extreme difficulty of identification of Cuterebra larvae. The mice species P. leucopus and P. maniculatus live in sympatry in Eastern Canada and are also very difficult to discriminate with morphological characters, such that electrophoresis of salivary enzymes (Aquadro & Patton, 1980) or DNA analyses (Tessier, Noël & Lapointe, 2005) is often required to tell them apart.
Because the genetic structure of parasites should reflect associations with their hosts when dispersal and population extinction occur jointly (Mulvey et al. 1991; Parker & Spoerke, 1998; Jerome & Ford, 2002), we postulate that the phylogeographical structure of Peromyscus and Cuterebra parasite should be congruent. Indeed, dispersal of parasitized mice necessarily implies dispersal of Cuterebra. Moreover, because mice represent the vital ressource for Cuterebra, the extinction of parasite populations is necessarily correlated with the extinction of corresponding host populations. To examine the parasitic relationship among species of Peromyscus and Cuterebra in Eastern Canada, we have addressed the following questions in a phylogeographical framework. (1) Is there population differentiation? (2) Is there isolation-by-distance? (3) Are the population structures of Peromyscus and Cuterebra congruent or not?
MATERIALS AND METHODS
Samples
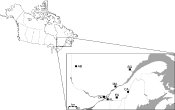
Samples were collected throughout Québec (Canada) in areas covering the distribution ranges of Deer Mice and White-footed Mice (Fig. 1). All mice were captured using Havahart live traps or snap traps. The specimens were then preserved in 95% ethanol or frozen until further use. Immature Cuterebra larvae were recovered from underneath the skin of preserved mice, whereas a small number of mature larvae were collected in the field when they exited dead mice.
Fig. 1. Map of Québec showing the seven populations where Cuterebra were sampled. AB: Abitibi, DM: Deux-Montagnes, ES: Estrie, CA: Chaudière-Appalaches, HL: Haut St-Laurent, MA: Mauricie, SG: Saguenay.
Other rodents accidentally trapped such as the Woodland Jumping Mouse (Napaeozapus insignis) and the Southern Red-backed Vole (Clethrionomys gapperi) were also found to harbour Cuterebra. These parasites were thus included in the study to determine host specificity, as was a specimen of Cuterebra extracted from a domesticated Eastern Chipmunk (Tamias striatus).
Dermatobia hominis is the only species found in the sister genus of Cuterebra. Since no sequences were available for other species of Cuterebra, it was thus included as the closest possible outgroup to root the parasite tree. For hosts, the outgroup selected was the Cactus Mouse (Peromyscus eremicus), a member of the subgenus Haplomylomys that lies just outside the P. maniculatus/P. leucopus clade.
Molecular analysis
DNA was extracted from liver samples of the parasitized mice and from the Cuterebra larvae using a standard phenol-chloroform protocol (Sambrook, Fritsch & Maniatis, 1989). Species identification of Cuterebra and Peromyscus was performed using species-specific primers in multiplex PCR (Noël et al. 2004; Tessier et al. 2005).
A portion of the cytochrome oxidase III (COIII) mitochondrial gene used in previous Peromyscus studies (Riddle, 1995; Riddle, Hafner & Alexander, 2000a,b) was selected to study the phylogeography of hosts. A 705 bp fragment was amplified using primers L8618 and H9323 (Riddle, 1995). Amplifications were carried out in 25 μl volumes including 4 μl of 10×reaction buffer, 0·2 mM of each dNTP, 0·15 μM of each primer, 0·5 U of Taq DNA polymerase and 50–300 ng of template DNA. PCR conditions were as followed: after an initial denaturation at 94 °C for 2 min, cycling was performed for 34 cycles of 1 min at 94 °C, 1 min 45 sec at 54 °C and 2 min 30 sec at 72 °C, with a final extension of 10 min at 72 °C.
For valuable comparisons, the markers used for parasites should have about the same mutation rate as those selected for hosts (Jarne & Theron, 2001). Consequently, the COIII gene was also selected to study the phylogeography of Cuterebra. To do so, the primers C3-J-5014 and C3-N-5460 were used to amplify a 446 bp fragment (Simon et al. 1994). Two other mitochondrial genes were also used; 476 bp of cytochrome oxidase I (COI) was amplified using primers C1-J-2183 in conjunction with C1-N-2659, and 523 bp of cytochrome oxidase II (COII) was amplified using primers C2-J-3138 and C2-N-3661 (Simon et al. 1994). Amplification reactions were carried out in 25 μl volumes with the same reaction mix as for Peromyscus. PCR conditions for COI were an initial denaturation of 2 min at 94 °C followed by 35 cycles of 45 sec at 94 °C, 45 sec at 42 °C, 1 min at 72 °C, with a final elongation of 5 min at 72 °C. PCR conditions for COII were the same as COI, with an annealing temperature of 40 °C. For COIII, cycling conditions were the same as for Peromyscus, with an annealing temperature of 42 °C, and for 32 cycles.
Amplification success was checked by running PCR products on 2% agarose gels stained with ethidium bromide and by revealing bands under UV light. The PCR products were then purified using Qiaquick purification kit (Qiagen), and directly sequenced in both directions with a CEQ 2000 sequencer (Beckman Coulter) using the same primers as for amplifications.
Data analysis
Sequences were aligned using Clustal X (Thompson et al. 1997) and manually edited. The number of variable sites, informative sites, and base composition for each gene were calculated using PAUP* (Swofford, 2002). The extent of genetic variation within each species was estimated with the nucleotide diversity (θπ) and allelic diversity (θs) (Tajima, 1989) and their standard deviation (S.D.) was computed using Arlequin (Schneider, Roessli & Excoffier, 2000).
Neighbour-joining trees (Saitou & Nei, 1987) based on Jukes-Cantor corrected distances (Jukes & Cantor, 1969) were estimated for each gene separately using PAUP*. A test of congruence among distance matrices (CADM) (Legendre & Lapointe, 2004) was then computed to assess whether the different genes could be combined in a total-evidence analysis. Bootstrap support values were calculated for all trees using 1000 replicates.
Population differentiation was assessed by a goodness-of-fit Mantel permutation test relating genetic distances to a binary matrix containing null distances (0) between individuals from the same population and unit distances (1) between individuals from different populations (Douglas & Endler, 1982). The isolation-by-distance model (Wright, 1943), which states that genetic distances are correlated with geographical distances, was also tested with a Mantel test (Mantel, 1967). To evaluate the effect of an important geographical barrier, namely the St Lawrence River, genetic distances of hosts and parasites were related to a second binary matrix containing null distances between individuals coming from the same shore of the River, and unit distances between individuals from opposite shores. All Mantel tests were computed using the R package (Casgrain & Legendre, 2001), with 999 permutations.
Congruence between the genetic structure of host and parasite populations was tested separately for each host–parasite association by measuring the correlation between the genetic distance matrices, or the corresponding phylogenetic trees. To begin with, corrected genetic distances (Jukes & Cantor, 1969) for hosts and parasites were directly compared using a Mantel test. A partial Mantel test (Smouse, Long & Sokal, 1986) was then performed to account for the effect of geographical distances when comparing matrices of genetic distances. Finally, the path-length distance matrices associated with the neighbour-joining trees were compared using a triple permutation test (Lapointe & Legendre, 1992) and their critical values were determined using Permute! (Casgrain & Legendre, 2000).
RESULTS
Prevalence
Only 49 Cuterebra larvae were found in the 1331 mice that were collected (Table 1), for a total prevalence of 3·6%. These Cuterebra come from 7 different regions, which will hereafter be called populations, separated by geographical distances ranging from 35 to 735 km (Fig. 1).
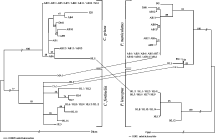
Peromyscus and Cuterebra species were genetically identified with species-specific primers. Among the 33 C. grisea larvae sampled from Peromyscus, 32 (97%) were associated with their expected host, the Deer Mouse, and only 1 (3%) was sampled from the White-footed Mouse. In the case of C. fontinella, 13 of the 16 larvae (81%) were associated with their typical host, the White-footed Mouse, and 3 (19%) were associated with Deer Mice (Table 1, Fig. 2).
Fig. 2. (A) Neighbour-joining tree of Cuterebra based on the total-evidence analysis of COI, COII and COIII sequences. (B) Neighbour-joining tree of Peromyscus estimated from COIII sequences. Numbers above branches indicate bootstrap support values (nodes with <50% bootstrap support and incompatible with haplotypes were collapsed). A line between host and parasite is indicative of a mismatch according to the host-specificity hypothesis. Names of specimens refer to the population they are sampled from (see abbreviations in Fig. 1) and each number refers to a different individual.
Cuterebra larvae extracted from the Woodland Jumping Mouse, the Southern Red-backed Vole and the Eastern Chipmunk were also sequenced for identification purposes, and sequences have been deposited in GenBank under Accession numbers AY507163–AY507165, AY507224–AY507228. All specimens grouped either with C. grisea or C. fontinella, and were thus identified accordingly. Among the 4 larvae sampled from voles, 3 have been identified as C. grisea and 1 as C. fontinella. The larva collected from the chipmunk was a C. fontinella, whereas that associated with the jumping mouse was C. grisea.
Cuterebra sequences
Sequences were obtained for 34 of the 49 Cuterebra specimens extracted from Peromyscus. Amplification failure may be explained by the degradation of DNA extracted from dead specimens that were collected with snap traps and live traps. Moreover, first and second instar larvae contain enzymes that could impair DNA extraction (Otranto et al. 2003). COI, COII and COIII sequences were obtained for 32, 26 and 34 individuals, respectively. The vast majority of the sequences were complete, except for some individuals (less than 10%) for which not enough material was available. All sequences were consistent with previous identification made with species-specific primers and have been deposited in GenBank under Accession numbers AY507157–AY507193, AY507196–AY507221, AY507223–AY507262.
Total sequence length for the 3 genes combined was 1445 bp. For C. grisea, 17 sites defining ten haplotypes were polymorphic (1·2%), and a single position was parsimony informative (0·1%). For C. fontinella 27 sites defining 10 haplotypes were polymorphic (1·8%), including 8 parsimony informative positions (0·5%). Details on the sequences for the different genes are presented in Table 2.
Estimations of θs and θπ for all genes combined were higher in C. fontinella (θs=8·30, S.D.=3·34; θπ=5·04, S.D.=2·91) than in C. grisea (θs=4·86, S.D.=1·99; θπ=1·51, S.D.=1·06). The number of fixed differences between species for COI, COII and COIII was 6, 1 and 6 respectively, for a total of 13 fixed differences (0·9%). Base composition was similar in all genes, with a proportion of A–T ranging from 67 to 73%, which is consistent with values obtained for other species of Diptera (Lessinger & Azeredo-Espin, 2000).
Peromyscus sequences
Host sequences were obtained for the 34 mice corresponding with the sequenced parasites. These sequences have been deposited in GenBank under Accession numbers AY513970–AY514004. Unambiguous sequences ranged in length from 500 bp to 688 bp. For P. maniculatus, 32 sites were polymorphic (4·7%), defining 12 haplotypes, and 17 were parsimony informative (2·5%). For P. leucopus, 10 sites were polymorphic (1·5%), defining 4 haplotypes, and only 2 positions were parsimony informative (0·3%) (Table 2).
Estimation of θs and θπ were higher for P. maniculatus (θs=8·89, S.D.=3·30; θπ=5·95, S.D.=3·30) than for P. leucopus (θs=3·22, S.D.=1·53; θπ=2·17, S.D.=1·44). A total of 57 fixed differences were observed between species of Peromyscus (4·7%). The proportion of A–T in Peromyscus (60%) was significantly lower than in Cuterebra (t=9·79, P=0·037).
Population differentiation and isolation-by-distance tests
The Mantel test relating genetic distances to a binary population matrix was significant for P. maniculatus (r=0·72, P=0·001, n=210) and C. grisea (r=0·51, P=0·027, n=171). The isolation-by-distance model was also significant for P. maniculatus (r=0·70, P=0·001, n=210) and C. grisea populations (r=0·43, P=0·022, n=171). The tests for C. fontinella (n=105) were not significant, probably because most of the specimens were sampled from the same population. These tests could not be performed for P. leucopus because all individuals were sampled from the same population.
Effect of the St Lawrence River
The St Lawrence River represents a significant factor shaping population structure of P. maniculatus (r=0·94, P=0·002, n=210) and C. grisea (r=0·77, P=0·008, n=171). This test was also significant for C. fontinella (r=0·73, P=0·014, n=105) but result relies on a single specimen coming from the North shore. This test could not be performed for P. leucopus, because all specimens were sampled from the South shore.
Host–parasite relationships among populations
The neighbour-joining trees for the parasites, estimated separately for the COI, COII and COIII sequences, were very similar and clearly split the two species identified a priori with species-specific primers (trees not shown). However, resolution within each species clade was very poor. The CADM test revealed that the distance matrices representing the three different genes were significantly similar and may be combined (W=0·86 P=0·0001). The resulting total-evidence tree, based on COI, COII and COIII sequences, shows a clear separation between C. grisea and C. fontinella, with high bootstrap support values (Fig. 2A). However, combining the genes did not increase the resolution within each species clade.
The neighbour-joining tree of hosts species, estimated from COIII sequences, is presented in Fig. 2B. The dichotomy corresponding to the two species of mice identified by species-specific primers is supported by high bootstrap values. Interestingly, the tree also separates Deer Mice sampled from the North and South (CA1, ES1 and HL3) shores of the St Lawrence River.
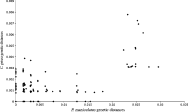
A significant correlation of genetic distance matrices was observed between P. maniculatus and C. grisea (r=0·57, P=0·039, n=153) (Fig. 3). This relationship remained significant after controlling for geographical distances in a partial Mantel test (r=0·52, P=0·037, n=153). The comparison of path-length distances corresponding to the neighbour-joining trees was also significant for this species pair (r=0·68, P=0·001, n=153). All tests involving P. leucopus and C. fontinella were not significant.
Fig. 3. Correlation of Jukes-Cantor corrected genetic distances of Peromyscus maniculatus and its associated parasite Cuterebra grisea.
DISCUSSION
Parasitism of mice by botflies of the genus Cuterebra is quite common, and as much as 66% of the individuals in natural populations can be parasitized (Wolf & Batzli, 2001). However, the average prevalence observed for the populations under study was much lower. As a result, a smaller number of parasites than expected was sampled from mice. Because adult parasites are rarely seen in nature apart from aggregation sites where the males assemble for mating purposes (Wood, 1981), and because these sites are unknown in Québec, a limited number of specimens were available for the analysis.
Although the vast majority of the collected larvae were associated with their expected host, a few specimens were sampled from other species of Peromyscus, or from other rodents. For example, C. grisea larvae were found in the Southern Red-backed Vole and the Woodland Jumping Mouse, whereas C. fontinella were extracted from the Southern Red-backed Vole and the Eastern Chipmunk. In all cases, these observations represent the first record of such hosts for these species of Cuterebra. However, because no Cuterebra specimens were allowed to complete their full development, it remains unclear whether the collected larvae can reach maturity in these species, or if they represent aberrant hosts. Shiffer (1983) reported an experiment in which C. fontinella eggs were artificially introduced in the Deer Mouse, the White-footed Mouse, the Southern Red-backed Vole and the Meadow Vole (Microtus pennsylvanicus). The only larvae to reach maturity were those in P. leucopus, suggesting that all other species represent aberrant hosts for C. fontinella. Although, the sample size of these experiments was rather small, it strongly suggests that Cuterebra are highly host-specific.
In the present study, a significant correlation of genetic distances was observed for P. maniculatus and C. grisea. On the other hand, the genetic distances for P. leucopus and C. fontinella were not significantly correlated, probably because limited sample sizes precluded a robust analysis of this host–parasite species group. When genetic distances are correlated among the populations of a host and its parasite, the geographical constraints can be more important than the host structure in determining the genetic distances of parasites (Dybdahl & Lively, 1996). In the present study, genetic distances of both P. maniculatus and C. grisea could be explained by an isolation-by-distance model. However, the partial Mantel test revealed that the correlation of host and parasite genetic distances remains significant when controlling for geographical distances. Consequently, the genetic distances of C. grisea are more likely to be driven by the population structure of hosts, rather than by geographical distances.
Similar relationships among populations of hosts and parasites are not necessarily an indication of co-evolution since the influence of biogeography may produce congruent patterns (Huelsenbeck, Rannala & Larget, 2003). Indeed, host and parasite may have been affected by the same biogeographical history, and their genetic structure could be explained by vicariant events rather than by ecological association (see Humphries, Cox & Nielsen, 1985). Populations of Deer Mouse and C. grisea located on the North shore of the St Lawrence River were shown to be significantly different from populations located on the South shore. A proposed explanation is the post-glacial colonization of areas separated by a dispersal barrier by founders coming from different refugia; a similar pattern as that observed in the rainbow smelt (Osmerus mordax) (Bernatchez, 1997). The St Lawrence River could still represent an important barrier maintaining this North/South dichotomy.
Deer Mice can swim across aquatic barriers for up to 230 m, in the absence of swirl, if they can see land on the other side (Sheppe, 1965). Because the St Lawrence River represents a fast, large, and choppy river, it seems improbable that Deer Mice can cross this barrier. Moreover, winter dispersal over the frozen river is unlikely since dispersal rarely occurs in winter months (Fairbain, 1978). On the other hand, Cuterebra are large flies with a powerful flight (Wood, 1981). Dispersal distances of Cuterebra are still unknown, but a related species of Oestridae (Hypoderma tarandi) can fly up to 900 km and travel 40 km in a period of 35 hours (Nilssen & Anderson, 1995). However, this high dispersal ability is probably a specific adaptation to the migratory behaviour of their host, the reindeer (Rangifer tarandus). Because adults of C. grisea live only for a few days devoted to reproduction (Wood, 1981), it is more reasonable to assume that C. grisea do not disperse over a long distance. Still, it may be possible for C. grisea to cross the St Lawrence River in some area. In this case, the North/South population differentiation of the parasites in the absence of a dispersal barrier could be explained by local adaptation of parasites to host populations. To test this hypothesis, further analysis involving many populations sampled from both shores would be needed. Moreover, the conclusions of this study are drawn only from mtDNA, which is maternally inherited. Because Peromyscus are known to have sex-biased dispersal (Van Horne, 1981), a different pattern may be observed from nuclear markers like microsatellites.
We would like to thank R. Charest, J. Jutras, G. Lupien and D. St-Hilaire from the Société de la faune et des parcs du Québec (FAPAQ) for providing mice and P.-A. Landry and P. Girard for collecting Cuterebra larvae in wild mice. Thanks also to Guy Fitzgerald from the Clinique des oiseaux de proie de la Faculté de Médecine Vétérinaire de l'Université de Montréal for providing a Cuterebra specimen extracted from a domestic chipmunk. We would also like to thank members of the Laboratoire d'écologie moléculaire et évolution (LEMEE) for technical support in the field and the lab. This work was supported by scholarships from the Conseil de Recherches en Sciences Naturelles et en Génie (CRSNG) and from the Fonds Québécois de la Recherche sur la Nature et les Technologies (FQRNT) to S. Noël and by CRSNG grants to B. Angers and F.-J. Lapointe.