INTRODUCTION
In recent decades parasitology research has moved on from the one host – one parasite paradigm towards studying systems composed of multiple hosts and parasites. While traditional DNA sequencing is used to identify individual parasites (e.g. Jenkins et al. Reference Jenkins, Appleyard, Hoberg, Rosenthal, Kutz, Veitch, Schwantje, Elkin and Polley2005; Asmundsson et al. Reference Asmundsson, Mortenson and Hoberg2008; Kutz et al. Reference Kutz, Checkley, Verocai, Dumond, Hoberg, Peacock, Wu, Orsel, Seegers, Warren and Abrams2013; Budischak et al. Reference Budischak, Hoberg, Abrams, Jolles and Ezenwa2015; papers in this issue), high-throughput sequencing, when combined with universal primers, can screen for multiple parasites concurrently (Tanaka et al. Reference Tanaka, Hino, Tsai, Palomares-Rius, Yoshida, Ogura, Hayashi, Maruyama and Kikuchi2014; Aivelo et al. Reference Aivelo, Medlar, Löytynoja, Laakkonen and Jernvall2015; Avramenko et al. Reference Avramenko, Redman, Lewis, Yazwinski, Wasmuth and Gilleard2015; Lott et al. Reference Lott, Hose and Power2015). Such approaches collectively referred to as metabarcoding, can interrogate parasite communities faster, cheaper and more accurately than traditional methods (Bik et al. Reference Bik, Porazinska, Creer, Caporaso, Knight and Thomas2012).
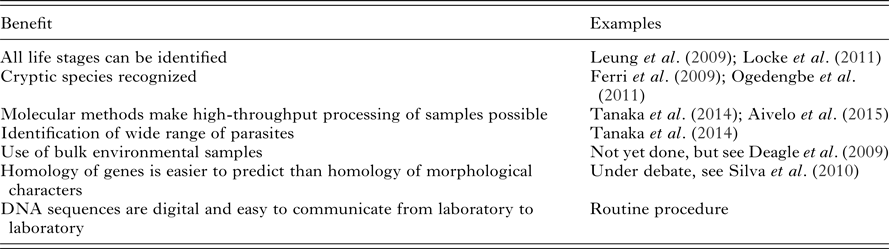
Traditionally, the identification of parasite species has relied on adult individuals. In the case of helminth taxa, for example, it is difficult to distinguish between species from their egg, cyst or larval forms and in some cases, identification relies on sex-specific traits (Gasser, Reference Gasser2006). This poses a problem, as in many research settings adult individuals are unavailable and therefore assessments can only be made at higher taxonomical levels (Floyd et al. Reference Floyd, Abebe, Papert and Blaxter2002). For example, non-invasive parasite assessment relies on egg and larvae samples. While it is sometimes possible to grow adult worms from eggs and larvae, coproculture is laborious and works with only a limited number of parasite species (Gasser, Reference Gasser2006). This problem is exacerbated by the ever-growing specialization necessary to distinguish between intestinal helminths. It is therefore practically impossible to perform exhaustive research projects on component communities of parasites based solely on morphology. In comparison, in a well-designed metabarcoding study, assigning amplicons to putative species is straightforward and does not need taxon-specific knowledge. Metabarcoding therefore opens up new avenues for parasitological research in, for example, longitudinal studies or studies in host animals, which cannot be killed due to endangerment or other ethical reasons (Table 1).
Table 1. A partial list of proposed benefits of the metabarcoding approach to the parasite identification, adapted from Aivelo (Reference Aivelo2015)

Intestinal helminths have different life cycles and modes of dispersal. Different protocols are therefore required to survey different taxa, with even sample collection requiring specialist knowledge. In comparison, metabarcoding is relatively straightforward irrespective of taxa studied and helminths at all life cycle stages could, in theory, be identified using the same workflow (Goldstein and DeSalle, Reference Goldstein and DeSalle2011).
As with any scientific endeavour, metabarcoding is not without its challenges or critics; mostly related to the perceived disadvantages versus ‘traditional taxonomy’ (Ebach and Holdrege, Reference Ebach and Holdrege2005; Mitchell, Reference Mitchell2011). We sidestep this debate, instead focusing exclusively on practical issues. The debate has been covered extensively elsewhere and we point the interested reader to Casiraghi et al. (Reference Casiraghi, Labra, Ferri, Galimberti and De Mattia2010); Taylor and Harris (Reference Taylor and Harris2012) and Collins and Cruickshank (Reference Collins and Cruickshank2013). Furthermore, much of the criticism against metabarcoding has been directed towards ‘DNA taxonomy’ – a method of building a new taxonomic framework. Delimitation of new species based on DNA is a highly contentious issue, whereas DNA identification of described species is more widely accepted (Lee, Reference Lee2004; DeSalle et al. Reference DeSalle, Egan and Siddall2005).
In this review we discuss a generic workflow for metabarcoding studies (Fig. 1), identify challenges and discuss the options for sample processing, choice of barcode regions and bioinformatics analysis. We conclude with a critical analysis of metabarcoding, outlining the limitations and identifying future advancements necessary for better and more effective studies. While metabarcoding can involve both environmental samples and bulk processing of isolated samples (Bik et al. Reference Bik, Porazinska, Creer, Caporaso, Knight and Thomas2012), we will focus on identification of parasites from fecal samples.

Fig. 1. Metabarcoding workflow. First DNA needs to be isolated from the collected samples, then the desired gene region is amplified with PCR and the amplicons sequenced. The resulting sequences need to be processed to deal with sequencing errors and assign sequences to reliable taxonomic identifications. This data can then be used for community analysis. Figure adapted from Aivelo (Reference Aivelo2015). PCR, polymerase chain reaction.
METABARCODING IN PRACTICE
While metabarcoding has not been used in many parasitological studies so far, high-throughput sequencing has had a major impact on the study of helminth phyla, e.g. nematodes and cestodes. Indeed, DNA has been successfully isolated from a majority of parasitic groups (Caron, Reference Caron2009). Moreover, identification of human and domestic animal pathogens is routinely performed using molecular methods (Ferri et al. Reference Ferri, Barbuto, Bain, Galimberti, Uni, Guerrero, Ferté, Bandi, Martin and Casiraghi2009). Genetic parasite identification is generally based on polymerase chain reaction (PCR) amplification using either species- or group-specific primers, but other methods, e.g. restriction fragment length polymorphisms (RFLP), are also used (Lott et al. Reference Lott, Hose and Power2015). At the moment, DNA sequencing is the preferred method for molecular biodiversity studies (Gasser et al. Reference Gasser, Bott, Chilton, Hunt and Beveridge2008; Valentini et al. Reference Valentini, Pompanon and Taberlet2009; Creer et al. Reference Creer, Fonseca, Porazinska, Giblin-Davis, Sung, Power, Packer, Carvalho, Blaxter, Lambshead and Thomas2010; Bik et al. Reference Bik, Porazinska, Creer, Caporaso, Knight and Thomas2012) and it is therefore expected to become more common in parasitological studies.
Non-parasitological fecal analysis methods have also been developed, for example, there have been many more studies in diet analysis (Symondson, Reference Symondson2002; King et al. Reference King, Read, Traugott and Symondson2008; Deagle et al. Reference Deagle, Kirkwood and Jarman2009). For many vertebrate and invertebrate groups, diet analysis can be performed by amplification with universal primers and high-throughput sequencing. Some of the diet analyses have also detected parasites as non-target identifications, demonstrating that parasites can be readily amplified from fecal samples (Srivathsan et al. Reference Srivathsan, Sha, Vogler and Meier2015, Reference Srivathsan, Ang, Vogler and Meier2016).
As only a limited number of parasitological studies have used the metabarcoding approach so far, it implies that either there is limited interest in high-throughput community analysis of intestinal parasites or that there are impediments to its use. The former is probably untrue, as the paradigm of parasitological research is moving towards considering multiple species parasite communities (Archie and Ezenwa, Reference Archie and Ezenwa2011; Bordes and Morand, Reference Bordes and Morand2011; Viney and Graham, Reference Viney and Graham2013). To better understand the problems associated with helminth metabarcoding, we are going to review the four studies performed to date: helminths in rats by Tanaka et al. (Reference Tanaka, Hino, Tsai, Palomares-Rius, Yoshida, Ogura, Hayashi, Maruyama and Kikuchi2014); strongylids in wallabies by Lott et al. (Reference Lott, Hose and Power2015); nematodes in ruminants by Avramenko et al. (Reference Avramenko, Redman, Lewis, Yazwinski, Wasmuth and Gilleard2015) and our study of nematodes in mouse lemurs, which is the only study performed on free-living animals (Aivelo et al. Reference Aivelo, Medlar, Löytynoja, Laakkonen and Jernvall2015).
Sample collection in the field
Genetic studies in the field are fraught with difficulties related to facilities and limited supplies. In spite of conditions, it is crucial that contamination be kept to a minimum and that samples are stored appropriately to simplify downstream processing.
While contamination is less abundant in helminth samples than bacterial samples, caution must still be observed. General rules for reducing cross-contamination also apply to parasite DNA studies: equipment should be sterilized between samples and negative controls (feces known to be uninfected) should be collected for validation purposes. Sterilization is not always possible in field conditions, but, for example, drying traps in direct sunlight provides sufficient ultraviolet radiation to kill many parasite taxa (Gaugler et al. Reference Gaugler, Bednarek and Campbell1992). Other equipment can be washed with ethanol to minimize the risk of contamination.
Aivelo et al. (Reference Aivelo, Medlar, Löytynoja, Laakkonen and Jernvall2015) encountered several groups of nematodes, which were unlikely to be mouse lemur parasites. First, there were high levels of contamination from soil nematodes. As soil nematodes are ubiquitous, they can be transferred by the host, e.g. from their feet, to their feces. Second, the host could simply have consumed nematodes along with food or nematode-infected prey. Especially in the case of carnivorous hosts, this could prove to be an important source of contamination, though it has not been studied systematically. This was not the case, however, as only living nematodes were isolated with Baermann's method. Unfortunately, this resulted in contamination from flies that laid eggs on the samples, with some amplicons identified as intestinal parasites of arthropods. Luckily, this contamination always coincided with dipteran sequences which were also amplified by the universal primers. During the first year this contamination was abundant, whereas during the second year the laboratory had a door and contamination was much rarer (Aivelo, in preperation)
Presence-absence studies need to assess false negatives and false positives. While it is generally difficult to assess the probability of false negatives, there are several ways to do this. The most straightforward approach is to validate the presence of helminths with other methods, e.g. morphologically. This is easy to do in bulk samples, where helminths are isolated prior to DNA isolation. A similar approach can be used to assess false positives: negative controls from fecal samples known not to contain any helminths should be processed alongside other samples. Also, replicates of samples from different processing points (duplicate sampling, duplicate DNA isolation, duplicate PCR reactions) can be used to decrease of chances of false negatives.
While the best option is to process the samples when they are fresh, this is often not possible in field conditions and they need to be preserved. There is a trade-off between different end-uses of samples: parasitological samples are routinely fixed in formaldehyde for morphological examination, making DNA extraction very difficult. Likewise, 96% ethanol prevents sample degradation, but quickly fixates the DNA. Samples for metabarcoding should be stored in 70% ethanol, and if they are being stored for long periods of time, should be kept in a freezer at least at −18 °C. If samples need to be stored indefinitely or very high quality material is required, RNAlater (Ambion, Austin, USA) provides sufficient quality for downstream processing as it quickly permeates and stabilizes tissues, preventing DNA degradation.
For many wild mammals, the amount of available fecal matter can be substantially greater than required and, therefore, a sample must be extracted. The aggregation of parasite eggs is poorly studied, but it seems that in humans, helminth eggs are distributed without clear patterns either from front to back (Martin and Beaver, Reference Martin and Beaver1968; Yu et al., Reference Yu, de Vlas, Yuan and Gryseels1998; Krauth et al., Reference Krauth, Coulibaly, Knopp, Traoré, N'Goran and Utzinger2012; or surface to centre of the fecal pellet (Woodstock et al., Reference Woodstock, Cook, Peters and Warren1971; Ye et al., Reference Ye, Donnelly, Anderson, Fu and Agnew1998; Krauth et al., Reference Krauth, Coulibaly, Knopp, Traoré, N'Goran and Utzinger2012). Thus, we would recommend sampling large fecal pellets from several locations or first homogenizing fecal pellets before sampling.
Sample processing in the laboratory
In comparison with bacteria, helminth DNA contamination in the laboratory is expected to be lower as it is less prevalent in general. If other nematodes are being handled in same laboratory as high-throughput sequencing samples, extra care should be taken to avoid contamination. Separate areas for pre-PCR work (DNA isolation, PCR set up) and post-PCR (preparing potential second PCR reaction or sequencing libraries) to reduce contamination substantially. Positive controls can be amplified preferably after all metabarcoding samples have been amplified.
DNA isolation and contaminations
Linking gene sequences to actual taxa is easier when known specimens are processed alongside collected samples. Preferably these are the same as in the studied host population, as positive controls or by partially matching fecal samples to examination of respective intestines. If actual species identifications can be attached to sequences, it also allows the resolution of the marker genes to be assessed. These validation steps should be performed in a pilot study, as in this way the DNA isolation and amplification strategies can be optimized for the studied communities (Cowart et al. Reference Cowart, Pinheiro, Mouchel, Maguer, Grall, Miné and Arnaud-Haond2015).
In comparison with other particles in fecal matter, intestinal parasites are generally abundant and in good condition. Eggs, cysts and larvae are living material and not degraded in comparison with other fecal matter like diet contents. Nevertheless, if genetic material is rare, fecal samples need to be treated carefully, as the first steps of PCR can easily lose rare material (Jarman et al. Reference Jarman, Deagle and Gales2004). Conventional barcoding uses relatively long sequences (~300 bp) but environmental samples can contain degraded DNA where the average length could be closer to 150 bp (Valentini et al. Reference Valentini, Pompanon and Taberlet2009). Obviously, high quality DNA amplifies better than degraded DNA and in fecal matter, the host DNA tends to be higher quality than other material.
It has become commonplace to perform two technical PCR replicates on bacterial DNA, as this has led to more reliable estimation of the community composition. With helminths, the required number of replicates depends on the rarity of the species present (Ficetola et al. Reference Ficetola, Pansu, Bonin, Coissac, Giguet-Covex, De Barba, Gielly, Lopes, Boyer, Pompanon, Rayé and Taberlet2015). Sequencing depth is also an important factor for similar reasons (Smith and Peay, Reference Smith and Peay2014). Replication levels should always be considered in relation to the study design. In fresh samples, the technical replicability is generally good (Ficetola et al. Reference Ficetola, Pansu, Bonin, Coissac, Giguet-Covex, De Barba, Gielly, Lopes, Boyer, Pompanon, Rayé and Taberlet2015), so resources should be directed to collection of multiple samples in the field. In cases where some phases of sample processing, e.g. DNA isolation or PCR amplification, have lower success rates and therefore higher chance of bias, technical replicates should also be performed.
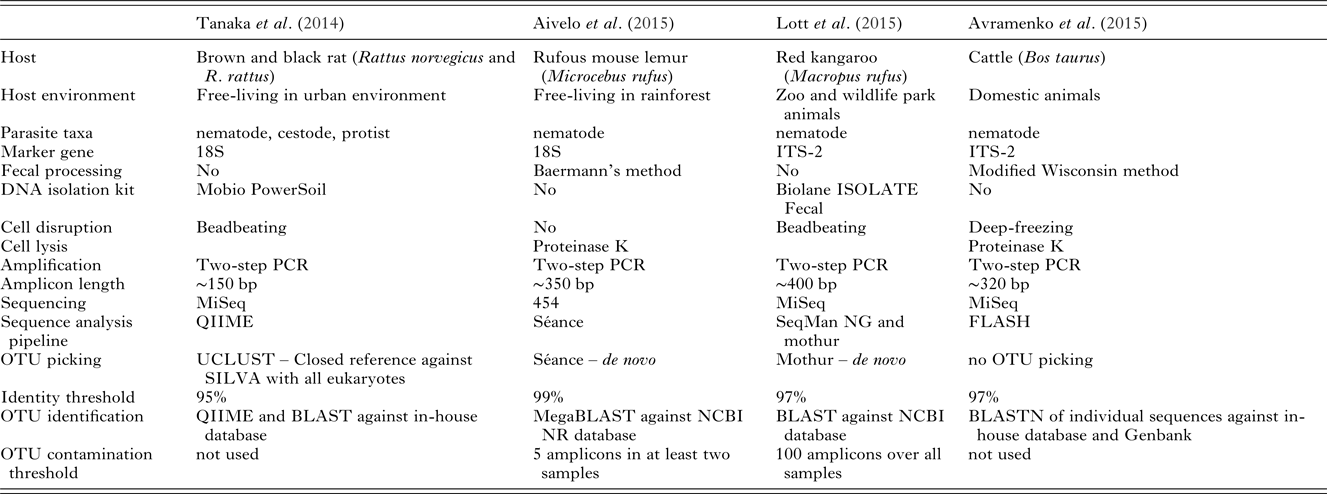
In the four previous helminth metabarcoding studies, intestinal parasite DNA has been successfully isolated from fecal samples using different methods: by beadbeating with different kits and by using proteinase K with and without flash-freezing to rupture cell structure (Table 2). Using kits in general gives high-quality isolated DNA, but have lower yield than traditional methods. Different kits have differential isolation success rates in different groups. Therefore, depending on the kit, different kinds of bias can be introduced. Again, this should be a less significant problem when studying presence and absence of helminths. In quantitative analysis, as the number of species will be lower compared with bacterial metabarcoding , the bias should be easier to account for (see the section ‘Quantitative vs qualitative’). Nevertheless, the success of DNA extraction should be assessed beforehand from all targeted parasite taxa. While half of the studies used the fecal pellets for DNA isolation, the other two separated helminths first from the fecal matter (Table 2). First separating the parasite larvae and using those for DNA isolation leads to comparatively clean samples with high quantities of target taxa and limited amounts of fecal bacteria DNA.
Table 2. Comparison of the different metabarcoding studies performed on helminths of mammals.

Fecal samples have a high concentration of inhibitors that make amplification prone to failure. Again, fecal isolation kits are adapted to offset the effect of these inhibitors, but there are differences in fecal composition from species to species and thus optimal isolation kits can only be found by trial and error. Also, in cases where special isolation methods are used, these DNA isolates can then be further cleaned with suitable kits.
Each helminth phyla has unique problems related to DNA isolation from the life stages present in feces (Hu et al. Reference Hu, Jex, Campbell and Gasser2007). DNA isolation in nematodes is more difficult than in other helminth phyla as the cuticle is resistant to some isolation methods and the adult specimens have a low number of cells, resulting in small quantities of genetic material (Dawkins and Spencer, Reference Dawkins and Spencer1989; Gasser et al. Reference Gasser, Chilton, Hoste and Beveridge1993; Harmon et al. Reference Harmon, Zarlenga and Hildreth2006). Nevertheless, nematodes are usually excreted in high numbers and some species hatch before defecation, meaning that there are live multicellular larvae available for sequencing (Stear et al., Reference Stear, Bishop, Duncan, Mckellar and Murray1995, Reference Stear, Abuagob, Benothman, Bishop, Innocent, Kerr and Mitchell2006; Mes, Reference Mes2003). In comparison, other helminths are excreted as highly resistant eggs, which contain small amounts of DNA and from which DNA isolation is more challenging (Bretagne et al. Reference Bretagne, Guillou, Morand and Houin1993; Mathis and Deplazes, Reference Mathis and Deplazes2006).
Amplification of barcode genes
The barcode region of choice for metazoans is cytochrome oxidase I (COI or coxI) (Hebert et al. Reference Hebert, Cywinska, Ball and DeWaard2003a, Reference Hebert, Ratnasingham and DeWaardb). COI has been widely successful, although it does not work for every phylum. Standardization is progressing slowly in the difficult phyla (Frézal and Leblois, Reference Frézal and Leblois2008) and there are also difficulties within otherwise well-functioning phyla (Santos et al. Reference Santos, Besnard and Quicke2011). The length of the amplified region is also affected by sequencing method (see the section ‘Sequencing’), but as a general rule, the targeted regions should be shorter if the amount of DNA is low or otherwise degraded.
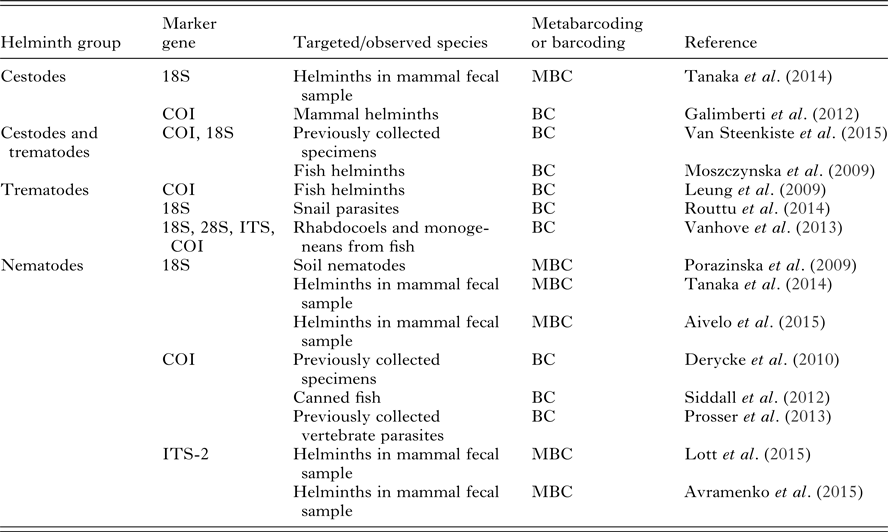
To illustrate the diversity of marker genes used in the literature, we have collected a non-exhaustive list of studies that barcoded cestodes, trematodes and nematodes in Table 3 along with the different marker genes used. In comparison with other helminth groups, there is currently a lack of barcoding studies targeting the helminths in phylum Acantocephala. As metabarcoding is still rarely applied in this domain, we included both regular barcoding of helminths and metabarcoding performed on closely related non-parasite groups. 18S rRNA gene databases have the highest coverage of described species in helminth groups, though COI is becoming more common due to BOLD (Barcode of Life Database) efforts. 18S can be used when there is interest in higher taxonomical groups, whereas species-level identification requires use of COI or ITS (Blasco-Costa et al. Reference Blasco-Costa, Cutmore, Miller and Nolan2016).
Table 3. A selection of studies, which have either used Sanger sequencing barcoding for parasite identification or have used metabarcoding approaches to identify parasites or closely related taxa

Sequencing
We will not extensively review different sequencing platforms in this paper. Shokralla et al. (Reference Shokralla, Spall, Gibson and Hajibabaei2012) have a good, though already quite old, overview of the different sequencing platforms. The most widely used sequencing platforms for metabarcoding are the Roche 454, which has already been phased-out of production, and the Illumina MiSeq. Roche was one of the early adopters of next-generation sequencing technology and provided quite long (150–1000 bp) reads, which could be utilized for species identification. Lately, the 300 bp read pairs provided by MiSeq are not only faster and cheaper than the 454, but has become the method for choice for metabarcode studies. While MiSeq sequencing has a high error rate compared with traditional Sanger sequencing, it provides paired-end sequences, which can be merged into a consensus sequence. All sequencing platforms exhibit different kinds of bias. For example, 454 suffers from homopolymer errors (Quince et al. Reference Quince, Lanzen, Davenport and Turnbaugh2011) and Ion PGM is biased by high GC content (Quail et al. Reference Quail, Smith, Coupland, Otto, Harris, Connor, Bertoni, Swerdlow, Gu, Rothberg, Hinz, Rearick, Schultz, Mileski, Davey, Leamon, Johnson, Milgrew, Edwards, Eid, Fehr, Gray, Luong, Lyle, Otto, Peluso, Rank, Baybayan, Bettman and Bentley2012). These differences make it more difficult to compare community analyses performed on different sequencing platforms.
Bioinformatics
There is a wide range of software available for processing sequence data and performing statistical analysis on the resulting observations. Many programs used for metabarcoding have been integrated into pipelines; the best supported being Mothur (Schloss et al. Reference Schloss, Westcott, Ryabin, Hall, Hartmann, Hollister, Lesniewski, Oakley, Parks, Robinson, Sahl, Stres, Thallinger, Van Horn and Weber2009) and QIIME (Caporaso et al. Reference Caporaso, Kuczynski, Stombaugh, Bittinger, Bushman, Costello, Fierer, Gonzalez Peña, Goodrich, Gordon, Huttley, Kelley, Knights, Koenig, Ley, Lozupone, McDonald, Muegge, Pirrung, Reeder, Sevinsky, Turnbaugh, Walters, Widmann, Yatsunenko, Zaneveld and Knight2011). While both integrate software together, they have differing philosophies: Mothur includes optimized re-implementations of existing methods, whereas QIIME does not implement these functions itself, but provides many ‘wrapper’ scripts designed to interoperate with one another. Both are frequently updated.
In general, bioinformatics for metabarcoding follows three basic steps: quality control, clustering and classification. While these broad steps are not always clearly demarcated, it will serve as a conceptual framework to contrast each method.
Quality control
Quality control is highly dependent on sequencing platform, for example, Roche 454 data must be denoised to remove homopolymer errors (Quince et al. Reference Quince, Lanzen, Davenport and Turnbaugh2011) and, analogously, paired-end data from Illumina MiSeq should be merged into longer contigs if they overlap. Irrespective of platform, sequencing involves many artificial oligonucleotide sequences, including PCR primers, adapters and multiplexing barcodes; all of which must be removed. As different library preparation kits use different adapters, it is crucial to know precisely what was used as their inclusion can lead to the identification of spurious species (Schloss et al. Reference Schloss, Gevers and Westcott2011). From the perspective of quality control, however, the inclusion of adapter sequences in the raw data is beneficial as sequences known a priori are quality controls that are independent of the quality metrics output by the sequencer. As a result, high numbers of mismatches in the primer or barcode sequences are assumed to indicate low quality reads, which are discarded. After removing adapter sequences, the resulting amplicons must be filtered for quality: trimming low quality bases from the 3’ end and then rejecting sequences that are either too short or noisy. Sequences that are exact duplicates are removed and a count kept in their place. Finally, chimeric sequences formed during PCR amplification need to be identified and removed as their inclusion leads to an inflation of species diversity. Chimera detection operates on the principle that putative chimeras must have sufficient similarity to two parent sequences, both of which are found in higher abundance than the child sequence (Haas et al. Reference Haas, Gevers, Earl, Feldgarden, Ward, Giannoukos, Ciulla, Tabbaa, Highlander, Sodergren, Methé, DeSantis, Petrosino, Knight and Birren2011).
Clustering
Estimation of species diversity requires de-duplicating data to summarise intra-species variation, reduce the computational effort needed to perform downstream analysis and respect operational definitions (for example, 3% dissimilarity delimiting bacterial species). Unique sequences are clustered, with the clusters termed operational taxonomic units (OTUs) (Blaxter et al. Reference Blaxter, Mann, Chapman, Thomas, Whitton, Floyd and Abebe2005; Bik et al. Reference Bik, Porazinska, Creer, Caporaso, Knight and Thomas2012). The resulting OTUs depend on the similarity threshold provided by the user and which clustering algorithm is used, i.e. how the similarity threshold is interpreted. Commonly used algorithms include: hierarchical clustering (including single-, average- and complete-linkage clustering), centroid-based and closed-reference clustering that we will cover in turn.
Hierarchical clustering requires a distance matrix between all sequence pairs as input; building up clusters by agglomeration. In this way all data points start out as independent clusters, but are combined if the distance between clusters is less than the similarity threshold. Where approaches differ is how the distance between clusters is calculated. In single-linkage clustering the distance between two clusters is the minimum distance between all pairs of data points, each data point coming from a different cluster. In average-linkage clustering, the distance is defined as the average distance between all pairs of data points, one from each cluster. Highly abundant sequences are more likely to be error-free, so a weighted average can be used instead. Unfortunately, hierarchical clustering can be slow for large datasets as the number of calculations scales quadratically with the number of unique input sequences. Hierarchical clustering is available in the Mothur pipeline (Schloss et al. Reference Schloss, Westcott, Ryabin, Hall, Hartmann, Hollister, Lesniewski, Oakley, Parks, Robinson, Sahl, Stres, Thallinger, Van Horn and Weber2009).
Centroid clustering avoids pre-calculating the full distance matrix and takes advantage of abundance information from exact duplicates. The method considers all sequences in descending order of abundance, comparing each data point with all existing clusters. Each cluster is defined by a representative sequence, the centroid, against which new data points are compared using the similarity threshold. If a sequence is not sufficiently close to an existing cluster, a new one is created with that sequence as the centroid. While the total amount of computation is lower than would be required for a full distance matrix, the procedure can result in a ‘long tail’ of low abundance clusters due to the suboptimal selection of cluster centroids. This approach is used by UCLUST (available in QIIME) (Edgar, Reference Edgar2010) and Séance (Medlar et al. Reference Medlar, Aivelo and Löytynoja2014), among others.
One issue with the clustering methods described so far is the underlying assumption that all sequences are homologous for the same loci, which might not always be the case. In study designs that use multiple libraries, hierarchical and centroid-based clustering would erroneously produce multiple clusters per species. Instead, closed-reference OTU picking finds the closest match for each input sequence from a reference database. Each reference sequence is considered to be a cluster in downstream analysis. Closed-reference OTU picking is only applicable for the most commonly sequenced marker genes and can result in bias in the case of an incomplete database and, as such, can leave sequences that are not sufficiently close to any reference sequence unclassified. Despite these limitations, closed-reference OTU picking is common in barcoding studies and is implemented in QIIME (Caporaso et al. Reference Caporaso, Kuczynski, Stombaugh, Bittinger, Bushman, Costello, Fierer, Gonzalez Peña, Goodrich, Gordon, Huttley, Kelley, Knights, Koenig, Ley, Lozupone, McDonald, Muegge, Pirrung, Reeder, Sevinsky, Turnbaugh, Walters, Widmann, Yatsunenko, Zaneveld and Knight2011).
For helminths, as with other organisms, the most appropriate method is dependent on the study design. As stated previously, the number of helminth species present in a single host is usually quite low, making centroid clustering far more efficient than hierarchical clustering. For similar reasons clustering can be performed using a high similarity threshold, e.g. 99%, however, the optimal value will depend on the marker gene region selected. Closed-reference clustering warrants some consideration too, however, as the specific scientific question may revolve around specific species, the diversity of which are well represented in sequence databases.
Removing potential contaminations
As low level amplicon contamination from non-target sequences is inevitable, some OTUs might be composed entirely of contamination. A majority of contamination can be avoided by filtering out sequences with a low copy number, requiring OTUs to be present in multiple samples (in longitudinal settings) and requiring a minimum number of amplicons before a sample can be said to contain a given OTU (see Table 2 for examples). Any thresholds are dependent not only on the level of contamination, but also sequencing depth, amplification and sequencing biases and the number of amplicons generated by the less abundant helminths.
Classification
Clusters alone are not especially useful and need to be taxonomically classified so results can be contrasted with existing knowledge, to allow for contamination to be removed (for example, clusters derived from host DNA) and to enable comparisons between different samples. Classification is inherently reference-based, so it is important to inspect results critically if there is a possibility of sampling previously undescribed or under represented species.
The RDP classifier uses a naïve Bayes approach to exploit correlations between k-mer frequencies to perform classification (Wang et al. Reference Wang, Garrity, Tiedje and Cole2007). The RDP classifier provides pre-built models for bacterial 16S and fungal ITS genes, but only to the genus level. Uncertainty is quantified with bootstrapping. Unfortunately, it is difficult to recommend for helminth identification: firstly, and most practically to a majority of users, there is no prebuilt model for helminths. To use the RDP classifier, in this context, requires the collection of suitable sequence data and the retraining of the model. This is further complicated as, while there are many sequences in databases, there are few sequences per genus (for example, the median number of nematode sequences per genus in the SILVA database is 7, and per species is 1). This presents a problem because statistical methods work better with more examples per taxon. Secondly, the efficacy of such methods is evaluated using cross-validation and without many sequences per taxon, even our evaluation of the method in artificial settings would be compromised. This is less of an issue for bacteria, where the number of reference sequences for 16S is far greater.
Sequence similarity based methods, e.g. BLAST (Camacho et al. Reference Camacho, Coulouris, Avagyan, Ma, Papadopoulos, Bealer and Madden2009), can give more specific classifications than statistical methods, but the results need to be post-processed to summarise ambiguities. For example, significant BLAST hits may be found for multiple species, so a reasonable summary is the lowest common ancestor (LCA) in the taxonomy (Huson et al. Reference Huson, Auch, Qi, Huson, Auch, Qi and Schuster2007; Medlar et al. Reference Medlar, Aivelo and Löytynoja2014). BLAST-based classification suffers from the same issues as the RDP classifier, in that the lack of reference data can produce spuriously classifications. One final issue with BLAST is that, unless you have a curated database, you need to avoid significant hits from metagenomics and environmental samples found in public databases such as NCBI's NR database as these provide no information, but can crowd out well annotated sequences in the list of results.
We can try to overcome the lack of reference data using phylogenetic methods. Instead of classifying sequences directly based on their similarity to reference sequences, we can instead build a phylogenetic tree using full length gene sequences and extend that tree with short amplicons. The end result shows the evolutionary context of each sequence given an evolutionary model. These methods are implemented in pplacer (available in QIIME), which uses maximum likelihood (Matsen et al. Reference Matsen, Kodner and Armbrust2010) and Séance, which performs evolutionary alignment extension (Medlar et al. Reference Medlar, Aivelo and Löytynoja2014).
All methods for classification come with serious caveats, so we recommend using multiple methods. Aivelo et al. (Reference Aivelo, Medlar, Löytynoja, Laakkonen and Jernvall2015) used both BLAST and phylogenetic placement, the concordance of which provided confidence or prompted further inspection. If in-house databases are used, parasite species identification needs to be based on morphological data and thus voucher samples are imperative, so identifications can be later verified (Janzen et al. Reference Janzen, Hallwachs, Blandin, Burns, Cadiou, Chacon, Dapkey, Deans, Epstein, Espinoza, Franclemont, Haber, Hajibabaei, Hall, Hebert, Gauld, Harvey, Hausmann, Kitching, Lafontaine, Landry, Lemaire, Miller, Miller, Miller, Miller, Montero, Munroe, Green and Ratnasingham2009; Astrin et al. Reference Astrin, Zhou and Misof2013). The same is true for any new sequence data added to the curated databases.
Statistical analysis
In comparison with many other applications of metabarcoding, helminth species richness is generally low: whereas the number of bacterial OTUs in mammals ranges in the hundreds, there is rarely more than 10 helminth species present. This allows for traditional statistical tools, including alpha and beta diversity comparisons, to be used in the analysis (e.g. Lott et al. Reference Lott, Hose and Power2015 and Aivelo et al. Reference Aivelo, Medlar, Löytynoja, Laakkonen and Jernvall2015). While in the early stages, metabarcoding techniques are mostly used to explore the presence or absence of certain taxa. As such, the data are vulnerable to false negatives: species that are present in the host, but due to egg shedding or unsuccessful sampling, went undetected. Previously mentioned replication can be used to reduce false negatives and the limits of detection can be modelled (Ficetola et al. Reference Ficetola, Pansu, Bonin, Coissac, Giguet-Covex, De Barba, Gielly, Lopes, Boyer, Pompanon, Rayé and Taberlet2015; Furlan et al. Reference Furlan, Gleeson, Hardy and Duncan2016). Furthermore, while limits of detection can pose a significant risk with environmental DNA samples (Hunter et al. Reference Hunter, Dorazio, Butterfield, Meigs-Friend, Nico and Ferrante2016), we would expect that the amount of parasite eggs or larvae is always proportionally high. Thus, the threshold for the sensitivity of the assay can be higher than for many environmental DNA applications.
Metabarcoding data can also be well-suited for community ecological analysis. Tools include dissimilarity matrices, which have been used extensively with bacterial 16S studies (Mills et al. Reference Mills, Entry, Voss, Gillevet and Mathee2006), or model-based ordination methods used for comparing sampling events (Warton et al. Reference Warton, Blanchet, O'Hara, Ovaskainen, Taskinen, Walker and Hui2015). The collected metadata can be incorporated into models to see how much of the species associations are accounted for similar habitat requirements or phylogenetic relatedness and how much are accounted by other factors, including species interactions (Aivelo and Norberg, Reference Aivelo and Norberg2016).
Presence-absence analysis (see also ‘Quantitative versus qualitative’ later) also makes helminth metabarcoding studies more comparable, as presence-absence data are expected to vary less than community composition data. Nevertheless, the lack of definite species identification poses a clear problem: the choice of marker region and the parameters used for OTU clustering affect the number of OTUs. Thus, comparisons between metabarcoding studies should be done only when these variables are similar.
LIMITATIONS OF METABARCODING
Metabarcoding is by no means the silver bullet for in-situ species identification as some researchers may have hoped. The most significant limitation is that only a minority of species are described, a subset of which have been reliably sequenced and are present in public sequence databases (Wilson et al. Reference Wilson, Rougerie, Schonfeld, Janzen, Hallwachs, Hajibabaei, Kitching, Haxaire and Hebert2011). Different methods of identifying OTUs, like incorporating evolutionary information, can resolve this problem partially; species can be differentiated even though they are not identified as a specific species. Despite these issues, things will improve over time as the coverage of barcode sequences and primers increases.
The second problem is far more difficult to solve: there are no truly universal primers, but a large number of taxon-specific primers (Deagle et al. Reference Deagle, Jarman, Coissac, Pompanon and Taberlet2014). Optimizing metabarcoding regions is difficult as the failure of some species to amplify is masked by successful amplifications of other species (Deagle et al. Reference Deagle, Jarman, Coissac, Pompanon and Taberlet2014). Furthermore, there is a tradeoff between coverage of species and resolution. For example, while nematode-specific primers can successfully amplify many nematode species, the resolution of the 18S gene region is often too low for differentiation at even the genus level (Aivelo, Reference Aivelo2015). Also, as Deagle et al. (Reference Deagle, Jarman, Coissac, Pompanon and Taberlet2014) points out, the variation quickly becomes saturated, meaning it is difficult to design primers, which are specific for only one phylum. The obvious solution for these problems would be to use longer amplicons or several primers, so called primer cocktails, to sequence several diagnostic gene regions (Prosser et al. Reference Prosser, Velarde-Aguilar, León-Règagnon and Hebert2013). For example, sequencing multiple gene targets might be necessary to successfully barcode all the intestinal nematodes present within one study. This makes the methods much more difficult to design and validate than the original conception of barcoding. Amplification-free approaches may solve the problem of amplification bias (Zhou et al. Reference Zhou, Li, Liu, Yang, Su, Zhou, Tang, Fu, Li and Huang2013), however, these approaches are limited by the quality of DNA required and the general problem of low ratio of DNA from taxa of interest in fecal matter compared with host or diet DNA. Nevertheless, diet analysis using shotgun sequencing seems to identify at least some helminths as a side-catch (Srivathsan et al. Reference Srivathsan, Sha, Vogler and Meier2015, Reference Srivathsan, Ang, Vogler and Meier2016).
The third problem is that sequencing error rates can be high and these errors can inflate diversity estimates (Meyer and Paulay, Reference Meyer and Paulay2005; Quince et al. Reference Quince, Lanzen, Davenport and Turnbaugh2011). Of course, sequencing error profiles are only understood because they are easy to control for, but all stages of the metabarcoding pipeline interact with one another and can negatively impact results. For example, with DNA extraction, low quality DNA can induce downstream errors in amplification. Sequencing is affected by proper amplification, where the choice of region and length of amplicons dictates the chances of success. During sequencing, different platforms have different error profiles and finally in bioinformatics improper data handling will lead to inaccurate statistical inferences.
The fourth problem is that the metabarcoding is still costly and requires expert knowledge from a number of fields. The falling cost of high-throughput sequencing has quickly expanded its use to all areas of biology. Nevertheless, the costs are not trivial as the cost of sequencing 96 samples using the Illumina MiSeq platform, for example, costs approximately 2000 euros at the time of writing, and the costs of building sequencing libraries are much higher. Sequencing is not a trivial process either and the support necessary for planning and executing a metabarcoding study differs between research institutes. Metabarcoding sequence analysis also requires bioinformatics skills, so the researcher must be comfortable with and well-versed in the use of tools to analyse amplicon data, or else be able to collaborate or hire a specialist.
Fecal sampling
Many of the problems encountered during a metabarcoding study are not related to the barcoding approach per se, but to non-invasive surveys of parasites in general. Fecal analysis identifies parasites indirectly, as it can only detect parasites that are laying eggs at the moment or, rather, at a certain time prior to sampling (Stear et al. Reference Stear, Bishop, Duncan, Mckellar and Murray1995, Reference Stear, Abuagob, Benothman, Bishop, Innocent, Kerr and Mitchell2006; Gillespie, Reference Gillespie2006). Fecal analysis is also known to be less sensitive than terminal sampling or surveying intestines for helminth identification (Jorge et al. Reference Jorge, Carretero, Roca, Poulin and Perera2013). Nevertheless, in many situations, invasive sampling is not possible, for example, in longitudinal studies, when studying endangered species or if the value of acquired data is low compared with killing an animal. In these cases, metabarcoding can be an especially valuable method.
Not every amplicon in feces that matches a helminth sequence is actually an intestinal parasite. While other helminth groups are exclusively parasitic, identifying parasitic nematodes can be difficult: potentially contaminating soil nematodes and actual parasitic nematodes can be closely related and they might not be reliably identified if the reference databases are limited. As previously described, contaminations can come from many different sources: from the soil, from the prey, during the sample processing or during the DNA isolation and amplification. Especially in the field, contaminations may be unavoidable, despite researchers’ best efforts.
Identification of species
Metabarcoding does not work directly with species, but with OTUs. As OTUs are defined as clusters of amplicons with high similarity, they can contain multiple species that happen to have sufficient sequence similarity by chance (Creer et al. Reference Creer, Fonseca, Porazinska, Giblin-Davis, Sung, Power, Packer, Carvalho, Blaxter, Lambshead and Thomas2010; Powers et al. Reference Powers, Harris, Higgins, Mullin, Sutton and Powers2011; Clare et al. Reference Clare, Chain, Littlefair and Cristescu2016). OTU composition is therefore affected by the choice of marker gene region (Powers, Reference Powers2004; Tang et al. Reference Tang, Leasi, Obertegger, Kieneke, Barraclough and Fontaneto2012). The difficult relationship between OTUs and species could limit the research questions for which metabarcoding can provide answers. For most of community ecology, though, the species identity is not an essential question. In comparison, when carrying out epidemiological studies, it is important to link OTUs with pathogenic outcomes. Also, it should be noted that sharing the same OTU in two different host species does not necessarily mean that both host species share the same parasite species. Metabarcoding is therefore inappropriate for studies interested in parasite sharing between different host species, unless additional taxon-specific genomic regions with higher resolution for species identification are used.
While metabarcoding approaches have quickly become more common, it has not been widely discussed what community ecology concepts, like diversity or richness means in relation to OTUs. Within microbiota research, these concepts, along with different beta diversity metrics, have been widely used, but critical consideration of the importance of different metrics has been rare (Dethlefsen et al. Reference Dethlefsen, McFall-Ngai and Relman2007; Robinson et al. Reference Robinson, Bohannan and Young2010). Nevertheless, community ecology is becoming more central as there is more and more data on different host-associated systems (Belden and Harris, Reference Belden and Harris2007; Costello et al. Reference Costello, Stagaman, Dethlefsen, Bohannan and Relman2012; De Schryver and Vadstein, Reference De Schryver and Vadstein2014; Trosvik and de Muinck, Reference Trosvik and de Muinck2015)
Quantitative vs qualitative
If contamination and limits of detection are taken into account, metabarcoding can provide reliable presence-absence data on helminth communities. In contrast, using metabarcoding for quantitative assessment of helminth communities within their hosts is more challenging (Gasser, Reference Gasser2006; Deagle et al. Reference Deagle, Thomas, Shaffer, Trites and Jarman2013). For gastrointestinal parasites, parasite load is defined as the number of parasites within a host individual and is therefore measured with invasive techniques such as the dissection of the gastrointestinal tract to count the number of adult parasites (Poulin and Morand, Reference Poulin and Morand2000). Measurement of parasite load non-invasively is bound to encounter the same problems as assessing parasite presence: parasite load can be assessed only indirectly (Jorge et al. Reference Jorge, Carretero, Roca, Poulin and Perera2013). The most commonly used method for non-invasive quantification of gastrointestinal helminth load is to quantify the parasite eggs in fecal matter. Fecal egg count (FEC, or eggs per gram, EPG) is often used as a proxy for parasite load but this is obviously problematic as FEC does not necessarily correlate with the number of parasite individuals within host (Stear et al. Reference Stear, Bishop, Duncan, Mckellar and Murray1995, Reference Stear, Abuagob, Benothman, Bishop, Innocent, Kerr and Mitchell2006; Gillespie, Reference Gillespie2006).
The number of eggs found in feces varies daily and can only be used as an indicator for prolific egg layers (Prichard and Tait, Reference Prichard and Tait2001). Even if we assume that the ratio of egg biomass is equal to adult parasite biomass, different species have different quantities of DNA within their eggs. Amplification success rates differ due to variation in the number of ribosomal and mitochondrial genes and the choice of DNA isolation methods, primers and sequencing affects the resulting community composition (Fouhy et al. Reference Fouhy, Clooney, Stanton, Claesson and Cotter2016). Depending on the amplification or sequencing steps, there can be different error rates within different amplicons leading to quality control discarding proportionally more amplicons from certain species.
Nevertheless, there are similar frustrations in 16S microbial sequencing and the bacterial microbiota research community has applied quantitative methods within these limitations (Brooks et al. Reference Brooks, Edwards, Harwick, Rivera, Fettweis, Serrano, Reris, Sheth, Huang, Girerd, Strauss, Jefferson and Buck2015; de la Cuesta-Zuluaga and Escobar, Reference de la Cuesta-Zuluaga and Escobar2016). We believe that helminth amplicon frequency can be used as a crude measure of abundance and is comparable across samples given appropriate design; ensuring that sample processing is uniform. The veracity of results from different quantitative analysis will wary in different host-parasite systems and depends on both the biology of the system and the amount of methodological validation carried out. There has been some progress in quantitative diet analysis, with well-validated correction factors (Thomas et al. Reference Thomas, Deagle, Eveson, Harsch and Trites2016), but further investigation is necessary to understand whether a similar approach is feasible in helminth metabarcoding.
FUTURE RESEARCH DIRECTIONS
As we have outlined above, metabarcoding provides both opportunities for faster and more extensive community composition analysis, but – like any method – has limitations that need to be taken into consideration. While not all scientific questions about helminth communities can be answered with metabarcoding, some cannot be addressed in any other manner. Indeed, the promise of metabarcoding lies in situations where traditional approaches cannot be used effectively. To summarize the possibilities for parasitology, we outline future research directions where metabarcoding can be employed and identify methodological questions that need to be resolved.
Parasite community analysis in animals that are difficult to capture
There are numerous reasons why some animals are not feasible to capture: they might be large or the act of capture might be unnecessarily disturbing. In these cases researchers might wait patiently nearby while the animal defecates and then collect the sample. Alternately, parasite analysis could be performed using feces found opportunistically on the ground. Metabarcoding could provide more power to fecal analysis.
Nevertheless, there is little data on how different sampling methods compare with each other and how retrievable parasite community structures are. We do not yet know, how fresh feces needs to be and do not know all the circumstances that lead to contamination, for example, when collecting feces from the ground. More methodological studies would hopefully lead to consensus as to what are the optimal methods in relation to work needed, price, yield and quality of DNA, as high-throughput methods rely on the usability of fecal DNA.
Longitudinal analysis of parasite community composition
Invasive sampling is clearly impossible in longitudinal analysis of parasite communities within host individuals. While the modus operandi of parasitological research has been cross-sectional studies by killing and invasively sampling host individuals, the succession of parasite communities within host (component communities) has rarely been studied. This has been very difficult, as the required taxonomic accuracy has not been attainable by morphological methods, whereas genetic methods can be used to link successive parasite samples to the same OTUs. While the repeatability of parasite measures from individual hosts has been low (Stear et al. Reference Stear, Bishop, Duncan, Mckellar and Murray1995), longitudinal sampling provides a more reliable picture of the parasite community. In turn, this longitudinal data on variation in within-host parasite communities can be linked to other measurements of individual hosts, including fitness, body condition, behaviour or genetic data.
Integration with phylogenetic information
One of the benefits of metabarcoding is that it also provides phylogenetic information. If the OTUs are placed in a phylogenetic tree, this could be used to provide a more concise picture on the phylogenetic relationships between metabarcoded parasites. Furthermore, this could be used in statistical analysis by taking phylogenetic distances into account. This is already common in microbiota research, but thus far rarely used in parasitological research (Bordes and Morand, Reference Bordes and Morand2009; Poulin, Reference Poulin2010; Xu et al. Reference Xu, Xu, Yang, Li, Yang, Tang, Mu, Zhou and Huang2013).
Previously unknown parasite communities
Metabarcoding can also be useful in studying host populations, of which we do not know the parasite assemblages. Even if the parasite species have not been described, OTUs can be defined much more accurately than morphospecies (depending on the marker region). This potentially provides far more opportunities in most host species, which are rarely studied and whose parasites are unknown. This could also enable broadening many classical ecological studies, which have not yet looked at the host-related symbionts, to take into account parasite communities.
Concluding remarks
We have outlined several reasons for adopting metabarcoding practices to study helminths in wild mammalian hosts, including faster and more accurate identification of parasites, especially from fecal samples, which have been previously difficult to analyze. Based on our own experiences and the few other helminth metabarcoding studies, we outline challenges and considerations in sampling in the field, laboratory work and data analysis. There are certain limitations with the metabarcoding approach, like the lack of truly universal primers, problems with contamination and the challenges to quantify relative abundances. We also suggest potential future research directions, which could benefit from metabarcoding, especially longitudinally surveying of host individuals or studies on endangered species, which could be done with non-invasive fecal sampling.
ACKNOWLEDGEMENTS
We thank two anonymous reviewers on their comments on the manuscript.
FINANCIAL SUPPORT
This work was supported by the Finnish Cultural Foundation (T.A.) and Oskar Öflunds Stiftelse (T.A.).