


INTRODUCTION
To date, the most comprehensive phylogenetic analyses of Calliphoridae have been based on morphology (Rognes, Reference Rognes1991). Morphological evidence typically supports eight subfamily groupings within Calliphoridae; Calliphorinae, Chrysomyinae, Helicoboscinae, Luciliinae, Melanomyinae, Polliinae, Rhiniinae and Rhinophorinae (Rognes, Reference Rognes1991). Within the key myiasis-causing families, cladistic analysis of morphological characters supports a Calliphorinae-Chrysomyinae grouping (Rognes, Reference Rognes1997), but more recent molecular data instead suggest a Calliphorinae-Luciliinae sister-lineage to Chrysomyinae (Stevens, Reference Stevens2003; Wallman et al. Reference Wallman, Leys and Hogendoorn2005). Moreover, while the monophyly of Calliphorinae and Luciliinae are strongly supported (Stevens, Reference Stevens2003; Wallman et al. Reference Wallman, Leys and Hogendoorn2005), support for monophyly of subfamily Chrysomyinae is less robust.
One of the defining characteristics of blowflies is the necessity to lay eggs on proteinaceous matter, often the tissue of a living vertebrate host; larvae then develop by feeding on the protein-rich substrate, a form of parasitism known as myiasis (Zumpt, Reference Zumpt1965). Within Calliphoridae, a range of larval feeding habits exist, including: coprophagy, saprophagy, sanguinivory and ectoparasitism (both facultative and obligate). Indeed, Calliphoridae represent some of the most economically significant myiasis-causing flies in the world, notorious for their parasitism of livestock. However, despite more than 50 years of research, key taxonomic relationships within Calliphoridae remain ambiguous and understanding the origins of blowfly parasitism is often restricted by the lack of widely agreed theories of evolutionary relationships and taxonomic classification within the family (Stevens, Reference Stevens2003). Consequently, using a multi-gene approach and broad taxon sampling across a range of Calliphoridae subfamilies (Table 1), this study aims to elucidate long-standing ambiguities within the family, including some questions that to date have proved equivocal in single gene studies, together with some issues previously unexplored with molecular methods. Such a robust evolutionary and taxonomic framework is essential to understand fully the evolution of this form of dipteran parasitism.
Table 1. Species list for taxa analysed in this study, including subfamily taxonomy, description of larval feeding behaviour, host type and sources used for classifying larval feeding behaviour (myiasis status)
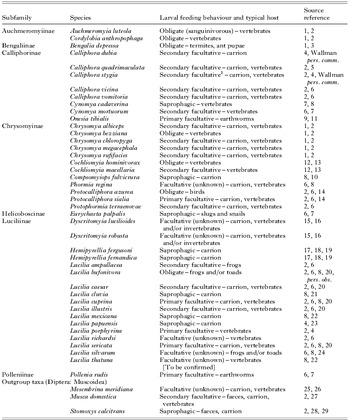
1 Identified by Zumpt (Reference Zumpt1965) as originally a primary myiasis fly, a role it is not now generally recognised as fulfilling (Stevens and Wallman, Reference Stevens and Wallman2006).
[1] Zumpt, Reference Zumpt1956; [2] Zumpt, Reference Zumpt1965; [3] Rognes, Reference Rognes, Papp and Darvas1998; [4] Fuller, Reference Fuller1934; [5] Dear, Reference Dear1985a; [6] Rognes, Reference Rognes1991; [7] van Emden, Reference van Emden1954; [8] Hall, Reference Hall1948; [9] Norris, Reference Norris, Naumann, Carne, Lawrence, Nielsen, Spradberry, Taylor, Whitten and Littlejohn1991; [10] Dear, Reference Dear1985b; [11] Hardy, Reference Hardy1937; [12] James, Reference James1947; [13] Shewell, Reference Shewell, McAlpine, Peterson, Shewell, Teskey, Vockeroth and Wood1987; [14] Sabrosky et al. Reference Sabrosky, Bennett and Whitworth1989; [15] Pollock, Reference Pollock1974; [16] James, Reference James and Hardy1981; [17] So and Dudgeon, Reference So and Dudgeon1989; [18] Chen et al. Reference Chen, Hung and Shiao2004; [19] Sukontason et al. Reference Sukontason, Sribanditmongkol, Chaiwong, Vogtsberger, Piangjai and Sukontason2008; [20] Aubertin, Reference Aubertin1933; [21] Nelder et al., Reference Nelder, McCreadie and Major2009; [22] James, Reference James1955; [23] Shah and Sakhawat, Reference Shah and Sakhawat2004; [24] Eaton et al. Reference Eaton, Moenting, Paszkowski and Shpeley2008; [25] Meier et al. Reference Meier, Kotrba and Ferrar1999; [26] Karpa et al. Reference Karpa, Petrova and Čudare2007; [27] Dogra and Mahajan, Reference Dogra and Mahajan2010; [28] Bishop, Reference Bishop1913; [29] Parr, Reference Parr1962.
Within insect systematics, mitochondrial DNA (mtDNA) and nuclear ribosomal DNA molecular markers have traditionally been favoured (Otranto and Stevens, Reference Otranto and Stevens2002; Shao and Barker, Reference Shao and Barker2007), largely due to the relative ease with which these markers can be amplified (Baker et al. Reference Baker, Wilkinson and DeSalle2001). The vast majority of molecular phylogenetic studies of parasitic arthropods to date have used single protein-coding genes (Shao and Barker, Reference Shao and Barker2007), however, analyses are increasingly combining mitochondrial and nuclear genes, in an attempt to utilize unlinked sets of data that have evolved under essentially different constraints (Stevens, Reference Stevens2003; Lin and Danforth, Reference Lin and Danforth2004). Focusing on molecular markers with different rates of substitution in this way not only improves phylogenetic resolution at different levels of divergence, but also allows comparisons between evolutionary histories of gene trees and species trees to be explored. Accordingly, this study uses nucleotide sequence data from two protein coding genes (mitochondrial COX1 and nuclear EF-1α) and one nuclear rRNA gene (28S). These three genes have been used extensively in insect systematics, including blowfly studies (e.g. Gleeson and Sarre, Reference Gleeson and Sarre1997; Stevens and Wall, Reference Stevens and Wall2001; Stevens et al. Reference Stevens, Wall and Wells2002; Stireman, Reference Stireman2002; Wells et al. Reference Wells, Goff, Tomberlin and Kurahashi2002, Reference Wells, Lunt and Villet2004, 2007; Stevens, Reference Stevens2003; Petersen et al. Reference Petersen, Meier, Kutty and Wiegmann2007; Harvey et al. Reference Harvey, Gaudieri, Villet and Dadour2008; Kutty et al. Reference Kutty, Pape, Pont, Wiegmann and Meier2008; Tourle et al. Reference Tourle, Downie and Villet2009), and as such provide sequences from a broad range of species across multiple genes for inclusion in this study. As a mitochondrial gene, COX1 has several advantages including a lack of recombination during cell division, high copy number, relative ease of isolation, availability of universal primers and the presence of both conserved and variable regions. Mitochondrial genes are also expected to reach reciprocal monophyly before nuclear genes, due to generally higher rates of sequence change (Avise et al. Reference Avise, Giblin-Davidson, Laerm, Patton and Lansman1979; Lunt et al. Reference Lunt, Zhang, Szymura and Hewitt1996; Monteiro and Pierce, Reference Monteiro and Pierce2001; Funk and Omland, Reference Funk and Omland2003; Dowton, Reference Dowton2004; Lin and Danforth, Reference Lin and Danforth2004), making COX1 particularly useful for inferring relationships between recently diverged species and in population genetics (Stevens and Wall, Reference Stevens and Wall1997b; Shao and Barker, Reference Shao and Barker2007). Nuclear genes such as EF-1α also may offer several advantages over mitochondrial genes, for example, by having a generally low level of biased base composition (Friedlander et al. Reference Friedlander, Regier and Mitter1992, Reference Friedlander, Regier and Mitter1994; Brower and DeSalle, Reference Brower and DeSalle1994; Lin and Danforth, Reference Lin and Danforth2004). However, paralogous copies of EF-1α have been identified in some insect species (e.g. Danforth and Ji, Reference Danforth and Ji1998), which may differ by up to 25% of the nucleotide sites in the coding regions. Consequently, multiple sequence alignments and BLAST searching were used across all three gene data sets to ensure that only the correct copies of the target genes were included in this study. The 28S subunit is a popular rRNA gene within insect systematics, as it displays both conserved and highly variable regions (D expansions) suitable for resolving relationships at a range of different hierarchical levels, and even having the ability to distinguish between closely related species (Otranto et al. Reference Otranto, Traversa, Milillo, De Luca and Stevens2005). This study focuses on these D expansions in an attempt to resolve relationships between closely related species, including apparent hybrid specimens.
The sequence data collected from these three genes were then analysed using Bayesian phylogenetic inference, an increasingly popular choice over Maximum Parsimony and Maximum Likelihood methods due to an apparent increased sensitivity to phylogenetic signal (Alfaro et al. Reference Alfaro, Zoller and Lutzoni2003) and better estimates of phylogenetic accuracy in terms of nodal support (Hillis and Bull, Reference Hillis and Bull1993; Wilcox et al. Reference Wilcox, Zwickl, Heath and Hillis2002). In addition to the status of subfamily Chrysomyinae outlined above, a number of, to date, unresolved taxonomic relationships are also addressed. The identity of the genus Bengalia as true blowflies remains ambiguous, with two main hypotheses having been proposed, namely that Bengalia represent either a subfamily, Bengaliinae (Rognes, Reference Rognes2005), or a completely separate sister-family to Calliphoridae (Lehrer, Reference Lehrer2003). The endemic Hawaiian genus Dyscritomyia, on the other hand, while differing from the majority of other blowflies in that it is viviparous (Pollock, Reference Pollock1974), are currently placed within the subfamily Luciliinae. To date, very little molecular research has focused on Dyscritomyia (see Wells et al. Reference Wells, Goff, Tomberlin and Kurahashi2002). Within the Calliphorinae the group Onesia has traditionally been granted genus status but several phylogenetic studies have reported evidence that Onesia is in fact a sub-group within the genus Calliphora (Wallman and Adams, Reference Wallman and Adams1997; Wallman and Donnellan, Reference Wallman and Donnellan2001).
Within the genus Lucilia, the species L. bufonivora represents a specialist parasite which has evolved to feed exclusively on members of Anura (frogs and toads), with a high host specificity for the common toad, Bufo bufo (Brumpt, Reference Brumpt1934; Strijbosch, Reference Strijbosch1980). L. bufonivora is thought to have diverged from its sister taxon, L. silvarum, relatively recently (Stevens and Wall, Reference Stevens and Wall1996a), with some authors, e.g. Townsend (Reference Townsend, Townsend and Filhos1935), grouping both species as a separate subgenus ‘Bufolucilia’. Recent field studies in the German region of North Rhine-Westphalia revealed myiasis infestation rates in frogs and toads of up to 70%, causing significant mortality (Weddeling and Kordges, 2008). Nevertheless, L. bufonivora remains poorly studied (Neumann and Meyer, Reference Neumann and Meyer2008) and the work presented here represents the first molecular phylogenetic study to include L. bufonivora, and includes analysis of larvae collected from a case of nasal myiasis in a toad collected in Suffolk, UK (Fig. 1).

Fig. 1. Toad with nasal myiasis, Suffolk, UK; posterior ends of live larvae are visible within the enlarged wounds at the site of the original nostrils (left nostril shown arrowed). Larvae were collected and preserved in alcohol prior to DNA extraction (photographs courtesy of Mr M. Porter).
Finally, this study provides new insights into the status of cross-species hybridisation between, L. sericata and L. cuprina, which together are the primary causal agents of ‘sheep strike’ in cool temperate (Europe and New Zealand) and sub-tropical/warm temperate regions (Australia and South Africa), respectively (Stevens and Wall, Reference Stevens and Wall1997a), and which represent some of the most well studied of all blowflies. Numerous morphological (Holloway Reference Holloway1991a, Reference Hollowayb; Stevens and Wall, Reference Stevens and Wall1996a) and genetic (Stevens and Wall, Reference Stevens and Wall1996b, Reference Stevens and Wall1997b, Stevens et al. Reference Stevens, Wall and Wells2002; Stevens, Reference Stevens2003; Wallman et al. Reference Wallman, Leys and Hogendoorn2005; Harvey et al. Reference Harvey, Gaudieri, Villet and Dadour2008) studies have focused on trying to separate these ambiguous species, although few have employed a multi-gene approach to exploring the status of hybrid populations (Stevens and Wall, Reference Stevens and Wall1996b, Reference Stevens and Wall1997b; Nelson et al. Reference Nelson, Wallman and Dowton2007; Tourle et al. Reference Tourle, Downie and Villet2009). The work presented here aims to explore the hybridisation between these two economically significant blowflies within a multi-gene framework, and utilises specimens from a variety of geographical locations, including a hybrid from Hawaii (Stevens and Wall, Reference Stevens and Wall1996b), and a recently confirmed L. cuprina×L. sericata hybrid from South Africa (Tourle et al. Reference Tourle, Downie and Villet2009).
MATERIALS AND METHODS
Specimens
A total of 57 Calliphoridae taxa were used in this study, along with 3 outgroup taxa, comprising 90 previously published sequences and 90 new sequences (Table 2). These taxa represent a range of subfamilies, genera, parasitic larval feeding behaviours and, where possible, different geographic populations (Tables 1 and 2).
Table 2. Taxon list, including subfamily taxonomy, country of origin of specimen, collector, sources used for specimen identification and accession numbers for new DNA sequences

I Lucilia bufonivora samples collected from nasal myiasis of a frog (Fig. 1), due to poor condition samples could not be identified morphologically;
II suspected Lucilia cuprina×Lucilia sericata hybrid Stevens and Wall (Reference Stevens and Wall1996b);
III confirmed Lucilia cuprina×Lucilia sericata hybrid (Tourle et al., Reference Tourle, Downie and Villet2009).
Specimen identification: JRS=J.R. Stevens (Exeter, UK), NW=N. Wyatt (NHM, Lond., UK), JFW=J.F. Wallman (Wollongong, Australia), RDN=R.D. Newcomb (Auckland, New Zealand), LD=L. Davies (Durham, UK), RT=R. Tellman (CSIRO, Australia), MJRH=M.J.R. Hall (NHM, Lond., UK), RLW=R.L. Wall (Bristol, UK), AMLAE=A.M.L. Azeredo-Espin (Campinas, Brazil), OAF=O.A. Fischer (Brno, Czech Rep.), SH-B=S. Hurtrez-Boussès (Montpellier, France), TLW=T.L. Whitworth (Washington State, USA), JDW=J.D. Wells (Florida International, USA), AH=Allen Heath (AgResearch, New Zealand), DMB=D.M. Bishop (AgResearch, New Zealand), MHV=M.H. Villet (Rhodes, South Africa).
Sources used for species identification: [1] Zumpt, Reference Zumpt1956; [2] Wallman, Reference Wallman2001; [3] Dear, Reference Dear1985a; [4] Rognes, Reference Rognes1991; [5] Shewell, Reference Shewell, McAlpine, Peterson, Shewell, Teskey, Vockeroth and Wood1987; [6] Hardy, Reference Hardy1937; [7] Spradbery, Reference Spradbery1991; [8] Rognes and Paterson, Reference Rognes and Paterson2005; [9] James, Reference James1947; [10] Sabrosky et al. Reference Sabrosky, Bennett and Whitworth1989; [11] James, Reference James and Hardy1981; [12] Aubertin, Reference Aubertin1933; [13] Holloway, Reference Holloway1991b; [14] D'Assis Fonseca, Reference D'Assis Fonseca1968.
Published sequences: [15] Harvey et al. Reference Harvey, Gaudieri, Villet and Dadour2008; [16] Wallman et al. Reference Wallman, Leys and Hogendoorn2005; [17] Stevens and Wall, Reference Stevens and Wall2001; [18] Wells et al. Reference Wells, Introna, Di Vella, Campobasso, Hayes and Sperling2001; [19] Wells and Sperling, Reference Wells and Sperling1999; [20] Wells and Sperling, Reference Wells and Sperling2001; [21] Harvey et al. Reference Harvey, Mansell, Villet and Dadour2003; [22] Kutty et al. Reference Kutty, Pape, Pont, Wiegmann and Meier2008; [23] Stireman, Reference Stireman2002; [24] Wells et al. Reference Wells, Goff, Tomberlin and Kurahashi2002; [25] Park et al. Reference Park, Zhang, Piao, Yu, Jeong, Yoo, Chung, Jo and Hwang2009; [26] Wells et al. Reference Wells, Wall and Stevens2007; [27] Stevens et al. Reference Stevens, Wall and Wells2002; [28] Collins and Wiegmann, Reference Collins and Wiegmann2002; [29] Iwasa and Ishiguro, Reference Iwasa and Ishiguro2010]; [30] Stevens, Reference Stevens2003; [31] Petersen et al. Reference Petersen, Meier, Kutty and Wiegmann2007.
Specimens used to produce new sequence data came from in-house collections at the University of Exeter, freshly collected samples provided by colleagues, and specimens on loan from external collections. All samples were stored at 4°C, either in 100% ethanol, or as dried pinned specimens.
Molecular analysis
DNA extractions were carried out using a salt extraction method (Aljanabi and Martinez, Reference Aljanabi and Martinez1997), except in instances where only a limited amount of sample was available, for which DNA extraction was carried out using a Qiagen DNeasy® Blood & Tissue Kit (Qiagen GmbH, Germany).
DNA extractions were subject to PCR procedures to amplify regions of the nuclear protein-coding gene elongation factor-1 alpha (EF-1α), the ribosomal DNA 28S (28S rRNA) and the mitochondrial protein-coding gene cytochrome oxidase I (COX1). Published universal insect primers (Table 3) and their corresponding PCR protocols were used to amplify COX1 (Bogdanowicz et al. Reference Bogdanowicz, Wallner, Bell, Odell and Harrison1993; Simon et al. Reference Simon, Frati, Beckenbach, Crespi, Liu and Flook1994; Sperling and Hickey, Reference Sperling and Hickey1994; Sperling et al. Reference Sperling, Landry and Hickey1995; Lunt et al. Reference Lunt, Zhang, Szymura and Hewitt1996; Wells and Sperling, Reference Wells and Sperling1999), EF-1α (McDonagh et al. Reference McDonagh, García and Stevens2009) and the D1–D7 expansion regions and related core elements of the large subunit 28S rRNA (Hoelzel and Green, Reference Hoelzel, Green and Hoelzel1992; Friedrich and Tautz, Reference Friedrich and Tautz1997a, Reference Friedrich and Tautzb); overlapping amplifications were performed according to the primer map shown in Fig. 2. These primers have been shown to work well in a broad range of insect species, including blowflies (e.g. Stevens and Wall, Reference Stevens and Wall2001; Stevens, Reference Stevens2003). Control samples (i.e. no DNA) were included in each set of PCR reactions to ensure no PCR carry-over or reagent contamination had occurred. PCR products were separated by gel electrophoresis and bands of appropriate sizes were cut out and purified. A fragment of ∼2·2 kb spanning the D1–D7 regions of the 28S rRNA gene was amplified in two overlapping sections of approximately 0·8 kb (D1–D2) and 1·45 kb (D3–D7), giving an overlap of ∼50 bp to facilitate sequence assembly. For most taxa, amplification of the 1·6 kb COX1 gene proceeded via a single fragment, though for a number of taxa amplification of a second shorter fragment of 0·68 kb (between primers COI F1 – COI R1) improved sequence read quality. The EF-1α fragment was ∼1·35 kb and was amplified in a single fragment. COX1 fragment sizes were checked against published blowfly mtDNA genomes (Stevens et al. 2008), while 28S rRNA and EF-1α fragments were checked against previously published sequences (Hovemann et al. Reference Hovemann, Richter, Walldorf and Cziepluch1988; Moulton, Reference Moulton2000; Friedrich and Tautz, Reference Friedrich and Tautz1997a, Reference Friedrich and Tautzb; Stevens, Reference Stevens2003). Purified PCR products were then sequenced using a commercial sequencing facility (COGENICS, formally Lark Technologies Inc.).

Fig. 2. Maps showing the arrangement of amplification primers and overlapping internal sequencing primers used to amplify the genes analysed in this study; (a) COX1, (b) EF-1α, (c) 28S rRNA.
Table 3. Amplification and internal sequencing primers used to amplify the three genes studied

* modified from Moulton (Reference Moulton2000) primers: 3PC, 5PC, JOM, ShM.
Sequence alignment and verification of sequence identity
Sequence fragments were checked for quality and edited manually before being assembled into a single consensus sequence, using AutoAssembler 2.0 (Applied Biosystems, Inc.). Any ambiguities in the consensus sequence were resolved or standard IUPAC/IUB codes (Leonard, Reference Leonard2003) used.
All gene sequence identities were checked against GenBank using BLAST. While only a single copy of EF-1α has so far been found in members of Oestroidea, two copies of EF-1α have been identified in bees and Drosophila, where they have been shown to differ in both intron position and in nucleotide sequence (Danforth and Ji, Reference Danforth and Ji1998). As a precaution, BLAST searching and examination of multiple sequence alignments were used to reduce the chance of EF-1α paralogs being included in our analyses. Multiple sequence alignment was carried out using the alignment editor SEAVIEW version 2.4 (Galtier et al., Reference Galtier, Gouy and Gautier1996) implementing the MUSCLE algorithm (Edgar, Reference Edgar2004); see alignments in SEAVIEW format in Supplementary Data files – appendix 1: EF-1a, appendix 2: COX1 and appendix 3: 28S rRNA –Cambridge Journals On-line, Parasitology. Subsequently, manual corrections by eye and amino acid translation were carried out to ensure parity with appropriate published insect protein-coding gene reading frames for COX1 (EMBL translation table 5) and EF-1α (Kutty et al. Reference Kutty, Pape, Pont, Wiegmann and Meier2008). The 28S rRNA sequences were aligned against the framework developed by Stevens (Reference Stevens2003); due to the presumably close taxonomic/evolutionary affinity of the taxa analysed, ribosomal RNA sequences were relatively homogeneous and, whilst some major indels were detected (e.g. Dyscritomyia spp. and several Lucilia spp.), alignment masking was not necessary prior to undertaking phylogenetic analyses.
Phylogenetic analysis
Appropriate nucleotide substitution model parameters were selected by a series of nested hierarchical likelihood-ratio tests using the program MODELTEST Version 3.06, (Posada and Crandall, Reference Posada and Crandall1998). Phylogenetic reconstructions were carried out using the program MrBayes 3.1 (Huelsenbeck and Ronquist, Reference Huelsenbeck and Ronquist2001). All phylogenetic analyses implemented two independent Metropolis Coupled MCMC (MCMCMC) searches starting from different random trees (nruns=2). Each search contained three heated chains (using the default heating temperature, temp=0·2) and one cold chain, with a sampling frequency of 10 generations and selected models and priors applied. The combined-gene analysis implemented a partitioned data set, with model parameters unlinked and variable rate parameters, to allow each gene to evolve under different rates.
Analyses were continued until the convergence diagnostic (standard deviation of split frequencies) fell below the default threshold (stopval=0·01), indicating sufficient convergence between the two samples of the posterior probability (Ronquist et al. Reference Ronquist, Huelsenbeck and van der Mark2005). The default convergence diagnostic burn-in fraction of 0·25 was used (burninfrac=0·25), consequently, a corresponding burn-in of 0·25, relating to the first 25% of samples obtained up until convergence had been reached, was also applied to summarize substitution model parameters (sump) and trees and branch lengths (sumt). Plots of generation versus log probability of the data (log likelihood values) produced by the sump command were also checked to ensure stationarity had been reached (i.e. the plot showed no patterns in the data – data resembled ‘white noise’) (Ronquist et al. Reference Ronquist, Huelsenbeck and van der Mark2005). Tree topology was then calculated from the remaining data, after discarding burn-in samples, by constructing a majority-rule consensus tree. In this way the probability that a monophyletic clade was ‘true’, given the caveats of the model and data, was estimated by the proportion of trees in the MCMC sample in which the clade occurs (Brooks et al. Reference Brooks, Bilewitch, Condy, Evans, Folinsbee, Fröbisch, Halas, Hill, McLennan, Mattern, Tsuji, Ward, Wahlberg, Zamparo and Zanatta2007).
The widely used partition homogeneity test (parsimony-based ILD test) in PAUP* (Swofford, Reference Swofford1998) was used to test phylogenetic congruence between the single gene data sets. The test was implemented under parsimony, with random taxa addition, no swapping and 1000 replicates.
The parasitic status of each taxon was mapped onto the phylogenies to facilitate analysis of patterns of evolution of the differing parasitic traits. The status of each taxon was scored as either obligate, primary facultative, secondary facultative or saprophagic.
RESULTS
Single-gene trees
Of the three genes studied, EF-1α and COX1 appeared to resolve relationships within Calliphoridae with the least conflict with existing taxonomy and contemporary evolutionary thinking relating to the family.
As noted, while only a single copy of EF-1α has so far been found in members of Oestroidea, two copies of EF-1α are known to exist in some insects, including flies (Danforth and Ji, Reference Danforth and Ji1998). As a precaution, BLAST searching and examination of multiple sequence alignments were used to reduce the chance of EF-1α paralogs being included. The BLAST searches revealed that all EF-1α sequences used in this study were of the same origin and not a mixture of different paralogs. Additionally, blowfly sequences were aligned and compared with Drosophila melanogaster sequences for EF-1α (F1) and the paralog EF-1α (F2) described by Hovemann et al. (Reference Hovemann, Richter, Walldorf and Cziepluch1988) (F1, Accession No. X06869; F2, Accession No. X06870). Our sequences showed complete alignment with the F1 sequence (e.g. at positions 2135–3322 for Calliphora dubia), confirming our EF-1α sequences to be homologues; however, when aligned with the paralog copy of EF-1α (F2) a large number of indels were apparent, showing that our sequences were not paralog copies. Similarly, while no evidence for nuclear copies of COX1 have been found within Oestroidea, extensive BLAST searching, examination of amino acid translations for stop codons and comparison of multiple sequence alignments suggest that only mitochondrial orthologs have been included here. Of the three genes analysed, 28S rRNA appeared to contain the least amount of phylogenetic signal. This was reflected by the relative ease with which sequences were aligned with each other, suggesting that the D1–D7 expansion regions were relatively well conserved across these species. The total number of characters in each sequence alignment was as follows: COX1: 1532; EF-1α: 1168; 28S rRNA: 2166.
The best-fit model for all three single-gene data sets was the General Time Reversible model (GTR) with proportion of invariable sites (+I) and gamma distributed rate variation among sites (+Γ). The ILD test revealed a significant difference in topology between the three genealogies (P<0·01; n=1; Fig. 3a–c).

Fig. 3a. EF-1α. For legend see Fig. 3c.

Fig. 3b. 28S rRNA. For legend see Fig. 3c.

Fig. 3c. Phylogenetic relationships within Calliphoridae (ingroup) and representatives of Muscoidea (outgroup), based on a Bayesian analysis of nucleotide data from (a) EF-1α, (b) 28S rRNA and (c) COX1. All branches supported with a Bayesian posterior probability of ⩾0·95 are labelled. • Primary facultative parasite; ○ Secondary facultative parasite; ![]() Obligate parasite; // Saprophagic.
Obligate parasite; // Saprophagic.
Subfamily relationships
Despite incongruence being detected between the three genes, all single-gene trees in this study supported a Calliphorinae-Luciliinae sister-lineage, with respect to Chrysomyinae, although, only one gene (COX1) recovered Chrysomyinae monophyletically, with a posterior probability of just 75% (COX1; Fig. 3c).
Calliphorinae, on the other hand, was recovered monophyletically by both the EF-1α (Fig. 3a) and 28S rRNA (Fig. 3b) gene trees and, despite significant topological differences between single-gene trees, was also recovered by the multi-gene tree. Within Calliphorinae, genus Calliphora was recovered as paraphyletic, with C. vicina and C. vomitoria grouping with the two Cynomya taxa in all three gene trees. Onesia tibialis was also found to group with C. dubia in both the EF-1α (Fig. 3a) and 28S rRNA (Fig. 3b) trees, with the multi-gene tree (Fig. 4) also recovering O. tibialis and C. dubia together with high support.

Fig. 4. Phylogenetic relationships within Calliphoridae (ingroup) and representatives of Muscoidea (outgroup), based on a partitioned Bayesian analysis of the combined gene (EF-1α, 28S rRNA, COX1) data set. All branches supported with a PP ⩾0·95 are labelled. The ILD test indicated significant phylogenetic conflict between the three genes; consequently, this multi-gene-based topology should not be used to represent accurate phylogenetic relationships within Calliphoridae, but instead can be taken as a guide to areas of congruence and conflict between the single gene phylogenies. • Primary facultative parasite; ○ Secondary facultative parasite; ![]() Obligate parasite; // Saprophagic.
Obligate parasite; // Saprophagic.
Subfamily Luciliinae was recovered as monophyletic by all three genes, receiving posterior probability values of 100 in the EF-1α (Fig. 3a) and COX1 (Fig. 3c) single-gene trees, as well as the overall multi-gene tree (Fig. 4).
Minor taxa
Within Luciliinae, Dyscritomyia lucilioides and Dyscritomyia robusta grouped together with high support in the EF-1α and COX1 gene trees, with 28S rRNA recovering Dyscritomyia as a separate sister-lineage to Luciliinae. The multi-gene phylogeny (Fig. 4) also recovered Dyscritomyia as a distinct clade, but failed to confirm the precise nature of their relationship to Lucilia.
Within Luciliinae, the two L. bufonivora specimens were consistently grouped together with high support, being placed in a clade with the UK and USA L. silvarum taxa by EF-1α (Fig. 3a) and 28S rRNA (Fig. 3b), and grouped with the USA L. silvarum and L. richardsii by COX1 (Fig. 3c).
The positioning of Bengalia depressa supports the classification of Bengaliinae as a subfamily within Calliphoridae; in all three single-gene phylogenies B. depressa was placed as a sister lineage to Auchmeromyiinae, and it received strong support for sister-taxon status in the multi-gene tree (Fig. 4).
Finally, L. sericata and L. cuprina were recovered as two distinct clades by EF-1α (Fig. 3a), with posterior probabilities of over 0·95. In contrast, COX1 (Fig. 3c) grouped the South African L. cuprina×L. sericata hybrid and the Hawaiian suspected hybrid taxa together, forming a sister-lineage to the L. sericata clade. The 28S rRNA gene tree (Fig. 3b), however, while grouping the two hybrid taxa within other L. cuprina taxa, failed to recover either L. cuprina or L. sericata monophyletically. Analysing the multi-gene data set (Fig. 4) resulted in a sub-grouping of the South African and Hawaiian hybrid taxa within a monophyletic L. cuprina clade, confirming mixed hybrid signals between genes.
Analysis of inter-gene phylogenetic congruence
The level of phylogenetic congruence between single gene data sets assessed using the partition homogeneity test (ILD test) in PAUP* (Swofford, Reference Swofford1998) revealed a significant difference (P<0·01, n=1) in topology between the three genealogies. Surprisingly, perhaps, subsequent querying of the gene partitions failed to highlight any one gene as being obviously aberrant from the other two, though this could be due to less robust resolution at key upper nodes, rather than any indication that the evolutionary histories described by the three genes are equally different.
Differing forms of parasitism within Calliphoridae
In all single-gene trees (Fig. 3a–c) and the multi-gene phylogeny (Fig. 4), the distribution of taxa demonstrating obligate parasitism, facultative parasitism and saprophagy is approximately equal throughout, probably reflecting both the multiple independent evolution of these life-history traits and the non-random taxonomic sampling effort applied in order to best represent the range of parasitic styles found within Calliphoridae. The blowfly species used in this study include eight saprophagic taxa, representing the subfamilies Luciliinae (L. papuensis, H. fergusoni, H. fernandica), Calliphorinae (C. cadaverina), Chrysomyinae (C. fulvicrura), and Helicoboscinae (E. palpalis). Four of the seven blowfly subfamilies include obligate parasitic species, namely: Auchmeromyiinae (A. luteola and C. anthropophaga), Bengaliinae (B. depressa), Chrysomyinae (C. hominivorax and P. azurea), and Luciliinae (L. bufonivora). The remaining taxa are all facultative parasites, with larvae being capable of feeding on dead or living host tissue. The facultative parasitic taxa were also sub-divided into those capable of initiating myiasis in an otherwise healthy host (primary facultative parasites), and those capable only of infesting existing wounds (secondary facultative parasites). However, a lack of information or conflicting reports, regarding whether a species is capable of initiating myiasis or not, have prevented some taxa from being unequivocally classified in this way (Table 1). While the presence of each of these forms of parasitism in each of the subfamilies within Calliphoridae appear to suggest either multiple origins or multiple losses of parasitism, in reality it is likely that parasitism has both evolved and possibly been lost at several points within the family, and that ancestral larval forms were already pre-disposed to be able to exploit proteinaceous material, e.g. carrion.
DISCUSSION
Of the largest (most taxon-rich) subfamilies included in this study – Calliphorinae, Luciliinae, Chrysomyinae – support for monophyly of each has varied depending on the gene(s) analysed and phylogenetic method employed (Stevens Reference Stevens2003; Wallman et al. Reference Wallman, Leys and Hogendoorn2005; Stevens and Wallman, Reference Stevens and Wallman2006). While the current study found strong support for Calliphorinae and Luciliinae, Chrysomyinae was recovered as a monophyletic grouping by only one of the three genes employed (COX1). This may reflect the differing evolutionary history of these three genes or it may (at least in part) be an artefact of unbalanced sampling; for example, while all Luciliinae and most Calliphorinae genera were represented by two or more taxa, three Chrysomyinae genera were represented each by only a single taxon. While this study has been limited to those taxa available for DNA extraction and to those for which sequence data are published, future detailed sampling effort focusing on Chrysomyinae appears much needed. Similarly, additional Helicoboscinae taxa also need to be analysed to allow the true evolutionary position of this under-studied subfamily to be unequivocally determined.
Multiple-gene phylogenies not only permit the use of genes that have evolved at different rates, but also allow the identification of experimental errors in species identification and sequencing (Monteiro and Pierce, Reference Monteiro and Pierce2001). For example, despite Onesia traditionally being classified as a separate genus within Calliphorinae, two of the three genes included in this study recovered O. tibialis within the genus Calliphora. Whether this incorrect genus classification is true for other, or all, Onesia species is unclear, and to date only a small number of Onesia species have been included in molecular phylogenetic studies.
This study also attempted to resolve the position of the endemic Hawaiian saprophagous group Dyscritomyia within Calliphoridae. While all three genes recovered Dyscritomyia within Luciliinae, the position of the genus within this subfamily differed between phylogenies. While, in agreement with Wells et al. (Reference Wells, Goff, Tomberlin and Kurahashi2002), Dyscritomyia were recovered as a separate sister lineage to Lucilia by nuclear 28S rRNA, COX1 placed Dyscritomyia away from the main clade of Lucilia species, instead grouping it with L. mexicana, L. cluvia (both North American species), and two Hemipyrellia taxa. In contrast, EF-1α recovered Dyscritomyia within the main Lucilia clade. These findings highlight the complicated genetic history of Dyscritomyia, with a nuclear gene phylogeny (28S rRNA) clearly placing Dyscritomyia as a sister-clade to Lucilia, while protein-coding gene phylogenies suggest more recent shared genetic ancestry with Lucilia spp. and, indeed, the possibility that the Dyscritomyia evolved from within genus Lucilia. Such a result accords with examples of phylogenetic incongruence between nuclear and mitochondrial phylogenies seen previously in Calliphoridae (Stevens and Wall, Reference Stevens and Wall1996b; Stevens et al. Reference Stevens, Wall and Wells2002; Nelson et al. Reference Nelson, Wallman and Dowton2007; Toure et al. Reference Tourle, Downie and Villet2009) and highlights the importance of using multiple genes to establish true evolutionary relationships in these Diptera. Clearly, more work using additional nuclear genetic markers will be required to resolve the evolutionary history of this enigmatic Hawaiian genus.
This study also included, for the first time, two L. bufonivora samples from a parasitised common toad. The consistent separation of these taxa from L. silvarum, the only other Lucilia species implicated in toad myiasis (Hall, Reference Hall1948; Zumpt, Reference Zumpt1965), suggests that they are separate sister species. Additionally, two out of three single-gene phylogenies (28S rRNA and COX1) placed the L. bufonivora/L. silvarum clade as a sister group to L. cuprina and L. sericata, suggesting a possible northern Hemisphere origin for these flies and the toad/frog parasitic habit.
The present study also revisited the topic of hybridisation within Calliphoridae, focusing on the two economically significant blowflies, L. cuprina and L. sericata. If hybridization is rare, the few viable hybrids that do occur may still potentially have significant evolutionary consequences; additionally, hybridization between morphologically similar species can often be very cryptic (Mallet, Reference Mallet2005). By comparing molecular data from three different genes, this study has extended the findings of previous studies that have demonstrated the introgression of L. sericata mitochondrial COX1 haplotypes into L. cuprina morphotype specimens. In terms of adult phenotype, L. cuprina seems to be dominant over L. sericata, as previously indicated by the findings of Ullyett (Reference Ullyett1945) and Stevens et al. (Reference Stevens, Wall and Wells2002). Additionally, backcrossing hybrids are often very difficult to distinguish morphologically from parent species, in consequence, rates of backcrossing can easily be underestimated (Mallet, Reference Mallet2005). An important implication of hybridization between L. sericata and L. cuprina is the potential introgression of insecticide resistance (Stevens et al. Reference Stevens, Wall and Wells2002; Tourle et al. Reference Tourle, Downie and Villet2009) which has already been documented between other fly species (Boakye and Meredith, Reference Boakye and Meredith1993). Recent advances towards the development of a female killing (FK) system for the control of L. cuprina in Australia (Scott et al. Reference Scott, Heinrich and Li2004) could also come under threat if hybridization proves more common than expected. In this FK system, modified male L. cuprina carrying wild type alleles on a Y-linked translocation and alleles for a recessive eye colour mutation on a normal set of autosomes, pass the Y-linked translocation onto their male offspring only, and the mutation onto their female offspring. When heterozygous females mate with modified males, half of all female offspring will be homozygous for the mutation, making them functionally blind with white eyes, thereby greatly reducing their chance of surviving to maturity (Whitten et al. Reference Whitten, Foster, Vogt, Kitching, Woodburn and Konovalov1977; Foster et al. Reference Foster, Vogt, Woodburn and Smith1988). Field trials of this FK system have proved to reduce wild L. cuprina populations by both the semi-sterility caused by the translocation itself, and through the eventual increase in proportion of homozygotic individuals through sustained release (Whitten et al. Reference Whitten, Foster, Vogt, Kitching, Woodburn and Konovalov1977; Whitten, Reference Whitten, Hoy and McKelvey1979; Foster et al. Reference Foster, Vogt and Woodburn1985; Foster, Reference Foster1989). While genetic death rates of up to 94% have been obtained using this FK system (Foster, Reference Foster1991) hybridization could potentially affect success rates.
Finally, this study has demonstrated that taxa exhibiting obligate parasitism, facultative parasitism and saprophagy are spread approximately equally across multi-gene phylogenies. Of course, there are many species which have not been included and, despite the breadth and taxon coverage of the current study, taxon coverage remains biased towards those species of veterinary, medical and economic importance. Nonetheless, the study confirms and extends the findings of many previous studies (see Stevens and Wallman, Reference Stevens and Wallman2006; Stevens et al. Reference Stevens, Wallman, Otranto, Wall and Pape2006 for full details) and highlights the multiple and in some cases probably relatively recent origins of the parasitic habit within this group of Diptera (Wiegmann et al. Reference Wiegmann2011). Our findings also indicate that the origins of the group probably lie with an ancestral form that was already pre-adapted to utilise proteinaceous matter as a key resource in its development.
ACKNOWLEDGEMENTS
We thank L. M. Evans (Exeter) for help with additional sequencing, N. Wyatt (Natural History Museum, London) for assistance in confirming the identity of Bengalia depressa and Mr M. Porter (Suffolk) for specimens and photographs of larvae infesting a live toad. We thank also the many colleagues who have helped in providing specimens for this and previous studies which have contributed to this work; chief among these are: R. Wall (Bristol), J. Wallman (Wollongong), R. Newcomb (Auckland), L. Davies (Durham), R. Tellman (CSIRO, Australia), M. Hall (NHM, Lond.), A.M.L. Azeredo-Espin (Campinas), O. A. Fischer (Brno, Czech Rep.), S. Hurtrez-Boussès (Montpellier), T. L. Whitworth (Washington State), J.D. Wells (Florida International), A. Heath (AgResearch, New Zealand), D. M. Bishop (AgResearch, New Zealand), M. H. Villet (Rhodes, S. A.).
FINANCIAL SUPPORT
This work was funded by the University of Exeter and the Natural Environment Research Council, UK (Grant No. NER/M/S/2003/00081).


