


INTRODUCTION
Cestodes of the family Taeniidae are parasitic in mammals and are placed within either of 2 genera, Taenia and Echinococcus (Hoberg et al. Reference Hoberg, Jones, Rausch, Eom and Gardner2000; Kumaratilake and Thompson, Reference Kumaratilake and Thompson1982). The adult tapeworms live in the digestive tract of their definitive hosts, while the bladder-like larvae occur in the internal organs of intermediate hosts. The predator-prey relationships of the mammalian hosts perpetuate the life-cycle of the taeniid cestodes. The tiny adult tapeworms of the genus Echinococcus utilize canids and/or felids as definitive hosts, and their larvae develop into hydatid cysts in intermediate hosts including ungulates, rodents and humans. The 2 main species, E. granulosus and E. multilocularis, cause cystic and alveolar echinococcosis in humans, respectively. The organisms of Echinococcus have a biphasic propagation manner comprising a sexual reproductive phase in the hermaphroditic adults and an asexual proliferation of protoscoleces in the larval stage. The self-fertilization of the adults and the clonal amplification of the larvae are responsible for genetic monomorphism within isolated Echinococcus populations (Lymbery and Thompson, Reference Lymbery and Thompson1996; Haag et al. Reference Haag, Araujo, Gottstein, Siles-Lucas, Thompson and Zaha1999), and may lead, eventually, to the speciation of Echinococcus (Smyth and Smyth, Reference Smyth and Smyth1964).
The classification of Echinococcus has been controversial because of the paucity of phenotypic characters and inadequate taxonomic descriptions. In taxonomic terms, many species and subspecies of Echinococcus were originally described, based mainly on host-parasite specificity characteristics (Ortlepp, Reference Ortlepp1937; Lopez-Neyra and Soler Planas, Reference Lopez-Neyra and Soler Planas1943; Williams and Sweatman, Reference Williams and Sweatman1963; Verster, Reference Verster1965). However, most of these taxa were regarded as synonyms for E. granulosus (Rausch, Reference Rausch1967), and the subsequent reclassification permitted only 4 morphospecies, namely E. granulosus, E. multilocularis, E. oligarthrus and E. vogeli (Rausch and Bernstein, Reference Rausch and Bernstein1972). The biological variants of E. granulosus, which utilize particular ungulates as intermediate hosts, have been designated as strains (Thompson et al. Reference Thompson, Lymbery and Constantine1995). Molecular genetic studies, using mainly mitochondrial DNA (mtDNA) sequences, supported the strain definition and identified 10 genotypes (G1 to G10) within E. granulosus (Bowles et al. Reference Bowles, Blair and McManus1994, Reference Bowles, Blair and McManus1995; Scott et al. Reference Scott, Stefaniak, Pawlowski and McManus1997; Lavikainen et al. Reference Lavikainen, Lehtinen, Meri, Hirvela-Koski and Meri2003). The taxonomic revision of Echinococcus is now required to determine the status of sibling or cryptic species. To date, reviving the names of synonyms, the oversimplified E. granulosus has been split into E. granulosus sensu stricto (genotypes G1 to G3), E. equinus (G4) and E. ortleppi (G5), but the species status of genotypes G6 to G10 is still ambiguous (Thompson and McManus, Reference Thompson and McManus2003). Most recently, a new sibling species, E. shiquicus, whose adult is morphologically similar to E. multilocularis, has been found in Tibet (Xiao et al. Reference Xiao, Qiu, Nakao, Li, Yang, Chen, Schantz, Craig and Ito2005).
Mitochondrial DNA (mtDNA) has more power than nuclear DNA in reconstructing phylogenetic relationships among closely related species because of the rapid sequence evolution (Brown et al. Reference Brown, George and Wilson1979), and large data sets derived from mitochondrial genomes have the potential for resolving problematic issues in taxonomy (Mueller et al. Reference Mueller, Macey, Jaekel, Wake and Boore2004). In this study, the phylogeny of the genus Echinococcus was clarified by using the complete mitochondrial genomes of representative taxa in order to improve the consistency between species status and traditional nomenclatures. The concatenated data sets of nucleotide and amino acid sequences derived from all mitochondrial genes were analysed with an array of phylogenetic methods including maximum likelihood and partitioned Bayesian analyses. In particular, the latter is the only method that can be used to analyse a large data set by incorporating complex substitution models into the statistical process (Ronquist and Huelsenbeck, Reference Ronquist and Huelsenbeck2003; Nylander et al. Reference Nylander, Ronquist, Huelsenbeck and Nieves-Aldrey2004). Also, the ancestral origin of Echinococcus was inferred, based on the phylogeny of Echinococcus and the evolutionary history of mammalian host animals.
MATERIALS AND METHODS
Taxon sampling
Ten taxa of Echinococcus and 1 outgroup (Taenia solium) were used in this study (Table 1). Complete published sequences were available for mitochondrial genomes of E. granulosus sensu stricto, E. equinus, E. multilocularis and T. solium (Le et al. Reference Le, Pearson, Blair, Dai, Zhang and McManus2002; Nakao et al. Reference Nakao, Okamoto, Sako, Yamasaki, Nakaya and Ito2002b, Reference Nakao, Yokoyama, Sako, Fukunaga and Ito2003). In addition, complete mtDNA sequences were obtained for larval isolates of E. oligarthrus (Panama), E. vogeli (Colombia), E. shiquicus (Tibet), E. ortleppi (Argentina), E. granulosus genotype G6 (Kazakhstan), E. granulosus genotype G7 (Poland) and E. granulosus genotype G8 (USA). Previous studies (Bowles et al. Reference Bowles, Blair and McManus1995; Lavikainen et al. Reference Lavikainen, Lehtinen, Meri, Hirvela-Koski and Meri2003) indicate that the taxa of Echinococcus examined in this study cover a range of major sequence variation in mtDNA within the genus.
Table 1. Mitochondrial genomes of Echinococcus and Taenia tapeworms analysed in this study

DNA sequencing
Genomic DNA purified from each of the Echinococcus isolates was used as a template for the polymerase chain reaction (PCR). As reported previously (Nakao et al. Reference Nakao, Sako and Ito2003), DNA fragments (0·7–2·5 kb) covering complete mitochondrial genomes were amplified by PCR, and their DNA sequences were compiled into a total sequence. In brief, the initial amplification of mtDNA was carried out using primers designed from the conserved regions of E. multilocularis mtDNA (Nakao et al. Reference Nakao, Okamoto, Sako, Yamasaki, Nakaya and Ito2002b). The sequences of these amplicons allowed us to design additional primers, whereby the remaining unknown regions were amplified. The cycle sequencing kits, DYEnamic ET terminator (Amersham Biosciences) and BigDye terminator (Applied Biosystems), were used for the direct sequencing of PCR products. After each sequencing reaction, synthesized ladders were run on an ABI PRISM 377 genetic analyser (Applied Biosystems). Large DNA templates were sequenced by primer walking.
Data processing
Mitochondrial genomes were annotated as reported previously (Nakao et al. Reference Nakao, Okamoto, Sako, Yamasaki, Nakaya and Ito2002b). Open reading frames (ORFs) of 12 protein-coding genes for ATPase subunit 6 (atp6), cytochrome b (cob), cytochrome c oxidase subunits 1 to 3 (cox1 to 3) and NADH dehydrogenase subunits 1 to 6 and 4L (nad1 to 6 and nad4L) were determined using the echinoderm mitochondrial genetic code (Nakao et al. Reference Nakao, Sako, Yokoyama, Fukunaga and Ito2000; Telford et al. Reference Telford, Herniou, Russell and Littlewood2000). Large and small subunit rRNA genes (rrnL and rrnS) and 22 tRNA genes (trn) were identified by their sequence similarities and secondary structures. Multiple alignments and basic statistics of nucleotide and amino acid sequences were achieved by ClustalX 1.82 (Thompson et al. Reference Thompson, Gibson, Plewniak, Jeanmougin and Higgins1997) and MacClade 4.08 (Maddison and Maddison, Reference Maddison and Maddison2000). PAUP4.0b10 (Swofford, Reference Swofford2002) was applied to make pairwise distance matrices. The conservative regions of mitochondrial genomes were displayed by the program plotcon of EMBOSS 3.00 (Rice et al. Reference Rice, Longden and Bleasby2000) using the alignment data of complete nucleotide sequences from all Echinococcus taxa. Gene-by-gene alignment was carried out for the 11 taxa (10 Echinococcus and 1 Taenia) to prepare data sets for phylogenetic analyses. Based on the alignments of deduced amino acid sequences, the nucleotide sequences of each protein-coding gene were aligned manually. The alignments of rRNA and tRNA genes were corrected by deleting ambiguous positions, such as loops and indels. The resultant alignments were concatenated into 3 data sets as follows: data set #1 comprising nucleotide sequences for all genes (total 13,130 sites); data set #2 comprising nucleotide sequences for 12 protein-coding genes excluding the third codon position (total 6746 sites); and data set #3 of amino acid sequences for the 12 proteins (total 3361 sites). Non-coding regions were considered unusable for phylogenetic analyses because they contained highly repetitive sequences.
PAUP4.0b10 (Swofford, Reference Swofford2002) was employed for maximum likelihood (ML) analysis using the nucleotide data sets #1 and #2. A suitable nucleotide substitution model and its parameter values were determined by Akaike Information Criterion (AIC) implemented in MODELTEST 3.7 (Posada and Crandall, Reference Posada and Crandall1998). A full heuristic search algorithm was utilized to estimate the ML trees. To conduct ML analysis for proteins, the program proml of PHYLIP 3.6 (Felsenstein, Reference Felsenstein2005) was run using the amino acid data set #3. The Jones-Taylor-Thornton (JTT) model for the substitution of amino acids was used with a gamma-shape parameter estimated from the data. In both analyses, the robustness of inferred trees was tested by non-parametric bootstrapping with 1000 pseudoreplicates. Consensus trees were constructed by the 50% majority rule and rooted with an outgroup taxon.
Partitioned Bayesian analyses were implemented using MrBayes 3.1 (Ronquist and Huelsenbeck, Reference Ronquist and Huelsenbeck2003). The nucleotide data set #1 comprising all genes was divided into 15 partitions. Twelve protein-coding genes and 2 rRNA genes were treated as individual data partitions and all tRNA genes were assigned as a single data partition. The best-fit nucleotide substitution models of each partition were selected by AIC implemented in MrModeltest 2.2 (modified from MODELTEST by J. A. A. Nylander, Uppsala University, Sweden). The amino acid data set #3 comprising all inferred proteins was divided into 12 partitions and their substitution models were selected by AIC in PROTTEST 1.26 (Abascal et al. Reference Abascal, Zardoya and Posada2005). Using each of the partitioned data sets, a Metropolis-coupled Markov chain Monte Carlo analysis was run for 1 million generations to estimate the posterior probabilities of trees. The tree sampling was taken every 1000 generations and all tree samples before the chain reached a stationarity were discarded as burn-in. Two independent analyses were conducted to verify the consistency of results.
RESULTS
Characterization of mitochondrial genomes
All mtDNAs examined in this study were in the form of a covalently closed-circular molecule of ∼14 kilo base pairs (Table 1). The genomes comprised 12 protein-coding genes, 2 rRNA genes, 22 tRNA genes (1 for each of 18 amino acids and 2 each for serine and leucine) and 2 short non-coding regions involved in replication and translation. The gene for ATPase subunit 8 was absent. Most of the genes were separated by a few bases, and the protein-coding genes contained no introns. The gene orders were identical among all of the genomes examined. All genes were located on the same strand, which was strongly biased towards thymine and against cytosine (Table 1). The nucleotide A+T contents of the Echinococcus mtDNAs ranged between 67·1 and 69·3%. The protein-coding genes were initiated by either an ATG or GTG codon and terminated by a TAG or TAA codon. The abbreviated stop codons T and TA, which are modified into a complete TAA codon by polyadenylation, were detected in the Taenia mtDNA (Nakao et al. Reference Nakao, Sako and Ito2003) but not in the Echinococcus mtDNAs.
The similarity scores of complete nucleotide sequences among 10 Echinococcus mtDNAs were plotted for every nucleotide position (Fig. 1). Conservative sequences were demonstrated in cob, nad3, cox1, cox2 and rrnS, while the non-coding region, located upstream from nad5, was highly polymorphic due to the deletion and insertion of repetitive sequences. An extreme imbalance of the similarity scores was observed within the sequences for nad5 and rrnL. Concerning the tRNA genes, the sequences of the anticodon arm (17 bases for each tRNA) were well conserved. However, the loops of the D and TΨC arms were variable (data not shown).

Fig. 1. Similarity of nucleotide sequences among mitochondrial genomes of 10 Echinococcus taxa. The positions of genes and non-coding regions are marked with their abbreviations. Shaded quadrates indicate genes for transfer RNA. Abbreviations: atp6, ATPase subunit 6; cox1 to 3, cytochrome c oxidase subunits 1 to 3; nad1 to 6 and nad4L, NADH dehydrogenase subunits 1 to 6 and 4L; NCR, non-coding region; rrnL and rrnS, large and small subunit ribosomal RNAs.
For all Echinococcus taxa, the number of nucleotide substitutions in all protein-coding genes was counted at every codon position after the alignments of each gene were concatenated. Of a total of 3426 variable sites, the second codon position had the fewest sites (n=426, 12·4%), followed by the first codon position (n=904, 26·4%), whereas the third codon position had the most sites (n=2096, 61·2%). The transition/transversion ratios for the first, second and third codon positions were 2·55, 1·68 and 1·69, respectively. The average frequencies of amino acid replacements are illustrated by MacClade's bubble charts using the amino acid data set #3 of all proteins (Fig. 2). The most frequent amino acid changes among the mitochondrial proteins predicted for the Echinococcus taxa were Val to Ile, Ile to Val, Leu to Phe and Phe to Leu. Most of these changes corresponded directly to the transitional substitutions of the first codon position.
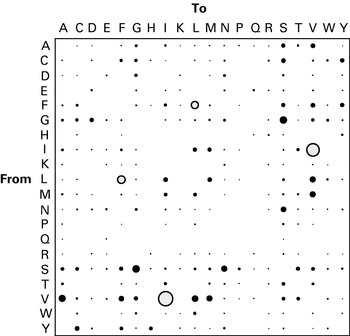
Fig. 2. The average frequencies of amino acid replacements in all mitochondrial proteins among 10 Echinococcus taxa. The diameter of the largest circle corresponds to 278 changes and other circles are scaled in diameter proportionally. Open circles represent the frequent changes more than 70. The values were determined from the alignment of amino acid sequences by MacClade 4.08 using the cladogram obtained by ML analysis.
Phylogenetic analyses
The phylogenetic relationships among 10 Echinococcus taxa were estimated mainly by using the nucleotide data set #1 representing all of the mitochondrial genes. To reduce the influence of saturation at the third codon position, the nucleotide data set #2 of 12 protein-coding genes (without third codon positions) and the amino acid data set #3 of 12 proteins were also used. The substitution models of these data sets for ML and partitioned Bayesian analyses are shown in Table 2. The Tamura-Nei (TrN)+G+I model was selected for ML analysis as the best fit model to describe the data set #1. Parameters for this model included base frequencies (A=0·2114, C=0·0653, G=0·2340 and T=0·4893), substitution rate matrix (AC=1·0000, AG=11·6176, AT=1·0000, CG=1·0000, CT=8·3353 and GT=1·0000), gamma distribution shape (0·9340) and proportion of invariable sites (0·4179). The tree topology inferred from the ML analysis is displayed as a cladogram (Fig. 3A) and as a phylogram (Fig. 3B). Two clades (α and β) were supported with high bootstrap values (98–100%). Clade α included E. ortleppi and genotypes G6, G7 and G8, whereas clade β consisted of E. multilocularis and E. shiquicus. The phylogram depicted a close relationship between the members of clade α. The other taxa, E. oligarthrus, E. vogeli, E. granulosus sensu stricto and E. equinus, were divided deeply into independent branches with moderate bootstrap values (71–89%). Further ML analyses using the data sets #2 and #3 produced phylogenies with unresolved nodes (Fig. 3A). In trees derived from both data sets, the basal positions of E. oligarthrus and E. vogeli were strongly supported, whereas the phylogenetic relationships among E. granulosus sensu stricto, E. equinus and clades α and β were uncertain because their nodes showed low bootstrap values. Partitioned Bayesian analyses using data sets #1 and #3 resulted in a robust phylogeny (Fig. 3A). The posterior probabilities of each node mostly reached 100% for both data sets. The tree topology of the Bayesian analyses was consistent with those of the ML analyses. The Bayesian analyses supported a sister group relationship between clades α and β. Furthermore, the resultant trees clarified the phylogenetic positions of E. granulosus sensu stricto and E. equinus, which remained as uncertain in the ML analyses.

Fig. 3. Phylogenetic trees for members of the genus Echinococcus inferred from mitochondrial genome data. Abbreviations: Eequ, E. equinus; Egra, E. granulosus sensu stricto; Emul, E. multilocularis; Eoli, E. oligarthrus; Eort, E. ortleppi; Eshi, E. shiquicus; Evog, E. vogeli; G6 to G8, Echinococcus genotypes; Tsol, Taenia solium (outgroup). (A) Cladogram obtained through maximum likelihood (ML) and partitioned Bayesian (PB) analyses. ML bootstrap proportions (%) are shown above branches, while Bayesian posterior probabilities (%) are shown below. The confidence values of both analyses using the nucleotide data sets #1 and #2 are shown in boldface. Numbers in italics represent the values obtained from the amino acid data set #3. (B) Phylogram obtained by ML analysis using the data set #1. The scale bar represents the estimated number of nucleotide substitutions per nucleotide site. Bold lines indicate the topology of Echinococcus using Canidae as definitive hosts. The orders of intermediate hosts (Ar, Artiodactyla; La, Lagomorpha; Pe, Perissodactyla; Ro, Rodentia) are mapped to branches.
Table 2. Nucleotide and amino acid substitution models used for maximum likelihood and partitioned Bayesian analyses
(The models of individual genes were applied to partitioned Bayesian analysis, while the models of total sequences were used for maximum likelihood analysis.)

Host-parasite relationships
Mammalian hosts for the members of Echinococcus were mapped to the parasite phylogram to examine host-parasite relationships (Fig. 3B). The definitive hosts were represented by the families Felidae and Canidae. The orders Rodentia, Artiodactyla, Perissodactyla and Lagomorpha were used to simplify an abundance of the intermediate hosts. A switch in definitive hosts might occur in the basal node of the phylogram because only E. oligarthrus utilizes Felidae, but the other monophyletic taxa colonize Canidae including dogs and foxes. Clade β consists of E. multilocularis and E. shiquicus which especially colonize foxes. Ancestral definitive hosts, whether Felidae or Canidae, were uncertain. Concerning intermediate hosts, a coevolutionary relationship was evident in clade α consisting of E. ortleppi and genotypes G6, G7 and G8. The members of the clade colonize Artiodactyla including cattle (E. ortleppi), camels (G6), pigs (G7) and cervids (G8). The basal species of E. oligarthrus and E. vogeli are associated typically with Rodentia, suggesting that rodents might be their ancestral intermediate hosts.
Divergence of closely related taxa
Pairwise divergence values for mtDNA sequences were compared to evaluate the species status of E. ortleppi and genotypes G6, G7 and G8. Within the family Taeniidae, Taenia saginata and Taenia asiatica are recognized as a pair of recently evolved species (Hoberg et al. Reference Hoberg, Alkire, de Queiroz and Jones2001) and are useful as a reference for closely related species. The complete nucleotide sequences of the cob and cox1 genes have been determined for T. saginata and T. asiatica (Nakao et al. Reference Nakao, Okamoto, Sako, Yamasaki, Nakaya and Ito2002a). Therefore, these genes were selected for comparisons of pairwise divergence. The matrix of Kimura's 2-parameter distance was calculated from the concatenated data set for the cob and cox1 sequences (total 2676 sites) using a gamma shape parameter (a=1). The pairwise divergence value between T. saginata and T. asiatica was used as a standard for incipient speciation. As shown in Table 3, the remarkably low value of pairwise divergence between G6 and G7 suggests that these genotypes belong to a single species. On the other hand, the species status of G8 is problematic, because the divergence values between G8 and the other genotypes were close to the threshold value between T. saginata and T. asiatica. The divergence values between E. ortleppi and the 3 genotypes were at interspecific levels.
Table 3. Pairwise divergence values of mtDNA sequences among closely related taxa of Echinococcus (E. ortleppi and genotypes G6, G7, and G8) and between sister species of Taenia (T. saginata and T. asiatica)
(Kimura's 2-parameter distances were computed from concatenated sequences of cob and cox1 (total 2676 sites) using a gamma-shape parameter (a=1).)

DISCUSSION
Concurrent descriptions of species, strains and genotypes have been used to record the biodiversity of Echinococcus in the context of medical and veterinary criteria for diagnosing and controlling echinococcosis in various settings (McManus and Thompson, Reference McManus and Thompson2003; Thompson and McManus, Reference Thompson and McManus2003). As a general rule, strains and genotypes are employed to categorize intraspecific variation. However, previous molecular phylogenetic studies on Echinococcus (Bowles et al. Reference Bowles, Blair and McManus1995; Thompson et al. Reference Thompson, Lymbery and Constantine1995) demonstrated that all strains or genotypes of E. granulosus could not be assembled into a monophyletic group, indicating that E. granulosus sensu lato is a cryptic species complex. Accordingly, the arbitrary use of strains and genotypes without a correction of the old nomenclature causes unnecessary confusion. The taxonomy of the cryptic species should be based entirely on their phylogenetic relationships, and appropriate scientific names should be used instead of strains and genotypes. The present study provides useful information for dividing E. granulosus sensu lato into distinct species.
The phylogeny of Echinococcus presented in this study is the first to be reconstructed from whole mitochondrial genome sequences. Confidence in the proposed topology was increased by the overall support of the nodes with ML and partitioned Bayesian analyses. However, divergence dates cannot be estimated due to the absence of fossil records. The resultant phylogeny included representative genotypes of E. granulosus sensu lato. Genotypes G2 (Tasmanian sheep strain) and G3 (buffalo strain) were not used in this study because they have very similar mtDNA sequences to that of genotype G1 (sheep strain) (Bowles et al. Reference Bowles, Blair and McManus1995). Thompson et al. (Reference Thompson, Lymbery and Constantine1995) regarded the genotypes G1, G2 and G3 as a single species, and these constitute the species E. granulosus sensu stricto. The present phylogeny confirms the validity of E. granulosus sensu stricto and supports the recent revisions of genotypes G4 (horse strain) and G5 (cattle strain) into E. equinus and E. ortleppi, respectively (Thompson and McManus, Reference Thompson and McManus2003). Moreover, the tree depicted a monophyly of E. ortleppi and genotypes G6 (camel strain), G7 (pig strain) and G8 (cervid strain). The other genotypes G9 (Polish human strain) and G10 (Fennoscandian cervid strain) were not analysed in this study. However, close relationships between G7 and G9 and between G8 and G10 have been reported using mtDNA sequences (Scott et al. Reference Scott, Stefaniak, Pawlowski and McManus1997; Lavikainen et al. Reference Lavikainen, Lehtinen, Meri, Hirvela-Koski and Meri2003; Xiao et al. Reference Xiao, Qiu, Nakao, Li, Yang, Chen, Schantz, Craig and Ito2005; Thompson et al. Reference Thompson, Boxell, Ralston, Constantine, Hobbs, Shury and Olson2006). In this study, the values of pairwise divergence among G6, G7 and G8 were lower than a threshold value for speciation estimated from T. saginata and T. asiatica. Using multiple loci of mtDNA (nad1, atp6 and cox1), Lavikainen et al. (Reference Lavikainen, Lehtinen, Laaksonen, Ågren, Oksanen and Meri2006) showed that the camel, pig and cervid strains clustered into a monophyletic group and that the cervid genotypes (G8 and G10) could not be separated out from this group. This result and our data suggest that the camel, pig and cervid strains may belong to a single species. The same suggestion has been made by Xiao et al. (Reference Xiao, Qiu, Nakao, Li, Yang, Chen, Schantz, Craig and Ito2005) and Thompson et al. (Reference Thompson, Boxell, Ralston, Constantine, Hobbs, Shury and Olson2006). The camel and pig strains have not previously been named (Thompson et al. Reference Thompson, Lymbery and Constantine1995), but the cervid strain was formerly named E. granulosus canadensis (Cameron, Reference Cameron1960; Webster and Cameron, Reference Webster and Cameron1961) or E. granulosus borealis (Sweatman and Williams, Reference Sweatman and Williams1963). In terms of priority for nomenclature, E. canadensis is the most suitable for genotypes G6 to G10. Based on the resultant phylogeny, we recommend a taxonomic revision to unify these genotypes into E. canadensis. Lavikainen et al. (Reference Lavikainen, Lehtinen, Ågren and Meri2005) have already made the same proposal. In our recommendation, E. canadensis and E. ortleppi are regarded as ‘sister species’. An alternative revision to this unified classification is to describe a new species for the camel and pig strains (genotypes G6, G7 and G9). In this case, the use of E. canadensis would be limited to the cervid strain (genotypes G8 and G10). The morphological similarities between the camel and pig strains (Eckert et al. Reference Eckert, Thompson, Lymbery, Pawlowski, Gottstein and Morgan1993) provide a significant piece of evidence to support the new species. Further, comprehensive population genetic, morphological and ecological studies are required for a final decision about the taxonomic status of the camel, pig and cervid strains.
A sister species relationship between E. multilocularis and E. shiquicus was demonstrated in this study. The morphological similarities between both adult tapeworms (Xiao et al. Reference Xiao, Qiu, Nakao, Li, Yang, Chen, Schantz, Craig and Ito2005) and the common usage of foxes as definitive hosts support this relationship. The extreme exogenous proliferation of larval cysts is characteristic of E. multilocularis and is responsible for the serious pathological effects associated with alveolar echinococcosis. In contrast, the larval cyst of E. shiquicus is basically unilocular (Xiao et al. Reference Xiao, Qiu, Nakao, Li, Yang, Chen, Schantz, Craig and Ito2005). The relationship between E. multilocularis and E. shiquicus strongly suggests that E. multilocularis only acquired the ability of the exogenous proliferation during the bifurcation of species. Although the larvae of E. oligarthrus and E. vogeli are also polycystic, the present phylogeny indicates that both species are not related to E. multilocularis in the evolutionary process of acquiring exogenous proliferation.
The most striking feature of the present phylogeny is that basal positions are occupied by E. oligarthrus and E. vogeli. A previous study using partial nucleotide sequences of mitochondrial genes (cox1 and nad1) also ranked these species as basal lineages, but the result was not fully supported due to the short sequences examined (Bowles et al. Reference Bowles, Blair and McManus1995). The basal positions of E. oligarthrus and E. vogeli are important in considering phylogeographic patterns because both species are endemic to the Neotropical region and colonize wildlife as definitive and intermediate hosts. As compared with these endemic species, E. granulosus sensu stricto, E. equinus, E. ortleppi and E. canadensis are inadequate for phylogeographical considerations because worldwide livestock movement in historic and prehistoric times seriously disturbed their original distributions. Nevertheless, all mammals, which can serve as definitive and intermediate hosts for Echinococcus, are restricted to members of the superorders Laurasiatheria and Euarchontoglires of the Northern Hemisphere origin (Murphy et al. Reference Murphy, Eizirik, O'Brien, Madsen, Scally, Douady, Teeling, Ryder, Stanhope, de Jong and Springer2001), suggesting that the adaptive radiation of the mammals is linked with the evolution of Echinococcus.
We propose plausible hypotheses for the history of Echinococcus based on geological events and the evolution of felids and canids. Several neotropical felids such as jaguarondi, ocelot and jaguar are definitive hosts for E. oligarthrus, whereas only the bush dog is known to be a definitive host for E. vogeli (D'Alessandro et al. Reference D'Alessandro, Rausch, Morales, Collet and Angel1981; Rausch and Bernstein, Reference Rausch and Bernstein1972). As shown in Fig. 4, these carnivores are derived from immigrants from North America after the formation of the Panamanian land bridge. The immigration of North American felids and canids occurred during the early Pleistocene and these evolved into endemic species in South America (Marshall et al. Reference Marshall, Webb, Sepkoski and Raup1982). Accordingly, it seems likely that the ancestral species of Echinococcus invaded South America together with the immigrants. The present members of Echinococcus usually utilize canids as definitive hosts except for E. oligarthrus. In this study, it was uncertain whether the ancestral definitive hosts were felids or canids. If they were canids, one could speculate that North America was the cradle of Echinococcus, as canids originated in North America (Wayne et al. Reference Wayne, Geffen, Girman, Koepfli, Lau and Marshall1997; Wang et al. Reference Wang, Tedford, van Valkenburgh, Wayne, MacDonald and Sillero-Zubiri2004). Another plausible scenario should be considered in case that the ancestral hosts were felids. Recently, a large-scale molecular phylogenetic study on felids suggested that modern felids arose in Asia (Johnson et al. Reference Johnson, Eizirik, Pecon-Slattery, Murphy, Antunes, Teeling and O'Brien2006), and their lineages migrated repeatedly between Eurasia and North America and invaded Africa. Considering felid evolution, Asia should also be considered as a candidate for the cradle of Echinococcus.

Fig. 4. The proposed movements of ancient definitive hosts of Echinococcus. The double arrows on the Bering Strait show the dispersals of primitive canids and felids during the late Miocene. The single arrow on Central America represents the immigration of carnivores into South America during the early Pleistocene.
In Africa, E. granulosus sensu stricto, E. ortleppi and E. canadensis (genotype G6) prevail in domesticated animals (McManus and Thompson, Reference McManus and Thompson2003), whereas Echinococcus infections of wildlife including lions, zebras, wildebeest and warthogs suggest a distinst species or strain. This parasite was formerly named as E. felidis (Ortlepp, Reference Ortlepp1937; Verster, Reference Verster1965) and now categorized as the lion strain of E. granulosus sensu lato (Thompson and McManus, Reference Thompson and McManus2003). The genetic makeup of this strain is completely unknown because wildlife preservation currently precludes its sampling and molecular analysis. Further studies are required to clarify the taxonomic status of the lion strain of E. granulosus sensu lato. The molecular phylogeny of Echinococcus should be tested further by adding this taxon.
This work was supported by a Grant-in-Aid for Scientific Research from the Japan Society for Promotion of Science (14256001 and 17256002) to Akira Ito and the National Institutes of Health, Ecology of Infectious Diseases Program (1R01 TW01565-01; Principal Investigator, Philip S. Craig). We thank many colleagues and field workers who collected valuable specimens, especially Jiamin Qiu for collecting Tibetan E. shiquicus.
