


INTRODUCTION
Researchers have been using nucleotide sequences to investigate nematode phylogeny for 2 decades (Qu et al. Reference Qu, Hardman, Gill, Chappell, Nicoloso and Bachellerie1986; Gill et al. Reference Gill, Hardman, Chappell, Qu, Nicoloso and Bachellerie1988; Nadler, Reference Nadler1992), and more recent studies have begun to provide the broad phylum-level sampling needed to develop a general molecular phylogenetic framework for nematodes (Blaxter et al. Reference Blaxter, De Ley, Garey, Liu, Scheldeman, Vierstraete, Vanfleteren, Mackey, Dorris, Frisse, Vida and Thomas1998; De Ley and Blaxter, Reference De Ley, Blaxter and Lee2002; Holterman et al. Reference Holterman, Van Der Wurff, Van Den Elsen, Van Megen, Bongers, Holovachov, Bakker and Helder2006). However, taxonomic sampling within the 5 main SSU rDNA-defined clades identified by Blaxter et al. (Reference Blaxter, De Ley, Garey, Liu, Scheldeman, Vierstraete, Vanfleteren, Mackey, Dorris, Frisse, Vida and Thomas1998) has rarely been comprehensive, although some subclades within these major groups have been more thoroughly sampled (Fitch, Reference Fitch1997; Nadler and Hudspeth, Reference Nadler and Hudspeth2000; Carreno and Nadler, Reference Carreno and Nadler2003; Chilton et al. Reference Chilton, Huby-Chilton, Gasser and Beveridge2006; Nadler et al. Reference Nadler, De Ley, Mundo-Ocampo, Smythe, Patricia, Bumbarger, Adams, De Ley, Holovachov and Baldwin2006b; Subbotin et al. Reference Subbotin, Sturhan, Chizhov, Volvas and Baldwin2006). Sampling among members of clade III, which consists of the classical orders Ascaridida, Oxyurida, Rhigonematida and Spirurida (Blaxter et al. Reference Blaxter, De Ley, Garey, Liu, Scheldeman, Vierstraete, Vanfleteren, Mackey, Dorris, Frisse, Vida and Thomas1998), has been particularly sparse in molecular trees, with the exception of some studies with a more narrow taxonomic focus such as Ascaridoidea (Nadler and Hudspeth, Reference Nadler and Hudspeth1998, Reference Nadler and Hudspeth2000; Nadler et al. Reference Nadler, D'Amelio, Fagerholm, Berland and Paggi2000), Filarioidea (Casiraghi et al. Reference Casiraghi, Bain, Guerrero, Martin, Pocacqua, Gardner, Franceschi and Bandi2004) and Dracunculoidea (Wijová et al. Reference Wijová, Moravec, Horák and Lukes2006). For example, in the SSU rDNA phylogeny of Blaxter et al. (Reference Blaxter, De Ley, Garey, Liu, Scheldeman, Vierstraete, Vanfleteren, Mackey, Dorris, Frisse, Vida and Thomas1998), clade III was represented by 8 species, and although the SSU analysis of Holterman et al. (Reference Holterman, Van Der Wurff, Van Den Elsen, Van Megen, Bongers, Holovachov, Bakker and Helder2006) included 32 clade III representatives, 19 of these were from a single superfamily (Ascaridoidea). This under-sampling of clade III diversity also minimizes the usefulness of molecular phylogenetic trees for developing new classifications for Nematoda (De Ley and Blaxter, Reference De Ley, Blaxter and Lee2002).
Clade III taxa, which have also been referred to as the suborder ‘Spirurina’ (De Ley and Blaxter, Reference De Ley, Blaxter and Lee2002), have been strongly supported as a monophyletic group in SSU rDNA phylogenies, with bootstrap support for the clade exceeding 95% (Blaxter et al. Reference Blaxter, De Ley, Garey, Liu, Scheldeman, Vierstraete, Vanfleteren, Mackey, Dorris, Frisse, Vida and Thomas1998; Holterman et al. Reference Holterman, Van Der Wurff, Van Den Elsen, Van Megen, Bongers, Holovachov, Bakker and Helder2006). As far as is known, Spirurina are entirely zooparasitic, however, one recent molecular study suggested the possible loss of parasitism for a member of this group (Bert et al. Reference Bert, Messiaen, Manhout, Houthoofd and Borgonie2006). Definitive (final) hosts of clade III parasites include both arthropods and vertebrates, with 2 orders having either some (Oxyurida) or all (Rhigonematida) species maturing in arthropods. Clade III includes species with a diversity of life-history and life-cycle patterns, ranging from monoxenous life-cycles (e.g. Oxyurida, certain Ascaridida) to species requiring arthropods as intermediate hosts (Spirurida) and using biological vectors for transmission (Filarioidea). Thus, this clade offers many opportunities to explore the evolution of life-cycles in a phylogenetic context. Clade III also includes many important species that negatively impact human health, agricultural production, wild-life and companion animals. Nematode molecular phylogenies provide both a framework for exploring patterns of nematode evolution and sequence datasets that offer the prospect of developing molecular identification methods for all life-cycle stages of these important parasites.
The main goal of the present work was to increase the taxonomic breadth of clade III taxa sampled for SSU rDNA in order to produce a more representative phylogenetic hypothesis. Evolutionary relationships were inferred using parsimony, likelihood and Bayesian methods, and the impact of positional homology ambiguity on phylogenetic tree inference was given special attention, because different approaches to constructing and using multiple alignments have been shown to have substantial effects on nematode phylogenies (Smythe et al. Reference Smythe, Sanderson and Nadler2006). The resulting molecular phylogenetic hypotheses are compared with classical proposals of relationships and previously published hypotheses based on molecular data.
MATERIALS AND METHODS
PCR and sequencing of specimens
Thirty-two taxa were amplified and sequenced for SSU (18S) rDNA, and used along with 81 previously published nematode sequences for phylogenetic analysis (Table 1). Collected specimens were preserved in 95% ethanol and stored at −20°C prior to nucleic acid extraction. Adult nematodes were identified to genus using the CIH keys (Anderson et al. Reference Anderson, Chabaud, Willmott and Hartwich1974; Anderson and Bain, Reference Anderson and Bain1976); species were identified by comparison with published descriptions. DNA was extracted from individual nematodes (or for some larger nematodes, component tissues such as muscle or gonad) using a commercial kit (MasterPure™, Epicentre Technologies).
Table 1. Specimen, taxonomic, host, habitat, and GenBank information for nematodes used in phylogenetic analysis of clade III
(Underlined Accession numbers represent new SSU sequences generated for this investigation. Habitat abbreviations for adult nematode (F=free living, G=gastrointestinal non-invasive, GTD=gastrointestinal tissue-dwelling, T=tissue-dwelling). *Host inferred based on specificity.)

Small subunit (SSU) rDNA was amplified and sequenced using several different methods and PCR strategies (Table 1). In most cases the near-complete SSU rDNA was amplified in a single piece using primers (Table 2) annealing near the 5′ and 3′ termini of the SSU gene. In some cases amplification was more successful (e.g. fewer non-specific products) by targeting 2 overlapping SSU pieces (e.g. primers 18S1A and 647, plus primers 652 and 136). Amplification reactions (25 μl) consisted of 0·5 μm of each primer, 200 μm deoxynucleoside triphosphates, and MgCl2 ranging from 1·5 to 3 mm. Proof-reading polymerase (0·5 units, Finnzymes DyNAzyme EXT, MJ Research) was used for amplification, with PCR cycling parameters including denaturation at 94°C for 3 min, followed by 35 cycles of 94°C for 30 sec, 50–60°C for 30 sec, and 72°C for 80 sec, followed by a post-amplification extension at 72°C for 7 min.
Table 2. Primers used for PCR and sequencing of nematodes completed for this study

Most SSU PCR products were cloned prior to sequencing, although some products were used for direct sequencing following enzymatic treatment using exonuclease I and shrimp alkaline phosphatase (PCR product pre-sequencing kit, USB Corporation). For cloning, PCR products were washed 3× with TE buffer (pH 7·0) by spin filtration (Millipore Ultrafree-MC 30,000 NMWL, Millipore Corporation), ligated into pGEM-T vector (Promega), and cloned into competent JM109 Escherichia coli. Sequencing reactions were performed using dye-terminator sequencing chemistry. All sequences were completely double-stranded for verification using reactions primed from the PCR or vector primers, and 7–10 internal sequencing primers (Table 2). For directly sequenced PCR products, site polymorphisms were recorded only when both alternative nucleotide peaks were present in all sequencing reactions representing both DNA strands. If the heights of the alternative nucleotide peaks at polymorphic sites were not equal, the height of the minor peak was required to significantly exceed background terminations, and comprise ⩾25% of the major peak to be scored as a polymorphism. For cloned rDNA, sequence differences between clones were recorded as polymorphisms. CodonCode Aligner (Version 1.5.1) and Phred base calling were used for assembly of contigs. Sequences produced during this study have been deposited in GenBank (Table 1).
Sequence analysis
Sequences were aligned using ProAlign Version 0.5 (Löytynoja and Milinkovitch, Reference Löytynoja and Milinkovitch2003). A ProAlign guide tree was constructed using corrected (for multiple hits) pairwise distances, and this tree was used to estimate the hidden Markov model parameters (δ and ε) for progressive multiple alignment. The average minimum posterior probability of each site was used as a criterion for either weighting characters or detecting and removing unreliably aligned sequence, since this value is correlated with correctness as determined by simulation studies (Löytynoja and Milinkovitch, Reference Löytynoja and Milinkovitch2003). To reduce the likelihood of excluding correctly aligned sites, the filter threshold was set to 60% minimum posterior probability, a value intermediate between the threshold of posterior probabilities for correctly versus incorrectly aligned sites in most simulation results (Löytynoja and Milinkovitch, Reference Löytynoja and Milinkovitch2003). This approach has proved effective for addressing alignment ambiguity in phylogenetic analysis of nematode rDNA sequences (Nadler et al. Reference Nadler, Bolotin and Stock2006a, Reference Nadler, De Ley, Mundo-Ocampo, Smythe, Patricia, Bumbarger, Adams, De Ley, Holovachov and Baldwinb). As an alternative approach to using all aligned sites without regard to alignment ambiguity (FULL dataset) and completely removing some characters based on a posterior-probability threshold (60FILT dataset), a data matrix was constructed that included all aligned sites, but with each character weighted according to its posterior probability by invoking an assumption block in the program PAUP* (=WHTD dataset).
Phylogenetic trees were rooted by including 10 outgroup species (orders following names in brackets) representing members of clade V (Aduncospiculum halicti [Diplogasterida], Caenorhabditis elegans [Rhabditida], Heterorhabditis hepialus [Rhabditida], Rhabditis myriophila [Rhabditida] and Nematodirus battus [Strongylida]), clade IVb (Zeldia punctata [Rhabditida] and Meloidogyne arenaria [Tylenchida]), and species that are nested deeper in the SSU nematode tree than members of clades III, IV and V (Plectus aquatilis [Araeolaimida] and Tylocephalus auriculatus [Araeolaimida]). These outgroup choices were supported by previous phylogenetic analyses of SSU rDNA (Blaxter et al. Reference Blaxter, De Ley, Garey, Liu, Scheldeman, Vierstraete, Vanfleteren, Mackey, Dorris, Frisse, Vida and Thomas1998; De Ley and Blaxter, Reference De Ley, Blaxter and Lee2002). Phylogenetic trees were inferred using 3 inference methods: maximum parsimony (MP), maximum likelihood (ML) and Bayesian posterior probability (BPP) using PAUP* 4.0b10 for Unix (Swofford, Reference Swofford1998), or MrBayes 3.1.1.p (Ronquist and Huelsenbeck, Reference Ronquist and Huelsenbeck2003) executed on a parallel MacIntosh cluster. A Perl script was used to generate commands to execute parsimony ratchet searches (Nixon, Reference Nixon1999) using PAUP*. Modeltest Version 3.7 (Posada and Crandall, Reference Posada and Crandall1998) was used to compare the fit of nucleotide substitution models using the Akaike information criterion; the best-fit ML models and parameters as determined for the 60FILT and FULL datasets were used for ML analyses. Parsimony analyses of the FULL and 60FILT datasets were performed using 10 independent repetitions of the parsimony ratchet, each with 200 ratchet iterations and perturbing 10% of the parsimony informative characters per replicate. Parsimony analysis of the WHTD dataset was performed using a heuristic search with 500 replicates of random taxon addition and tree-bisection-reconnection (TBR) branch swapping. Bootstrap MP searches were conducted using 1000 pseudoreplicates, each having 10 replicates of random taxon addition, saving a maximum of 10 trees per pseudoreplicate and a search time limit of 2 min per pseudoreplicate.
Maximum likelihood trees were inferred using a neighbour-joining (NJ) starting tree, with the substitution model (GTR+G+I) and model parameters as selected by ModelTest. Heuristic searching of tree space was performed using TBR branch swapping with a 72-h time-limited search. Bootstrap ML inference was conducted using 100 pseudoreplicates of heuristic searches (NJ starting tree with TBR branch-swapping) with the substitution model and parameters set as for the corresponding ML tree search, except each replicate had a search time limit of 90 min.
Bayesian analysis was performed using the GTR+G+I model as selected by ModelTest, but without using the Modeltest estimates for gamma shape or proportion of invariable sites as fixed priors. The standard deviation of split frequencies was used to assess if the number of generations completed was sufficient; the chain was sampled every 100 generations. The FULL and WHTD2 (see below) datasets were run for 1 million generations, whereas 60FILT was run for 2 million generations. Burn-in was determined empirically by examination of the log likelihood values of the chains. A weighted Bayesian analysis was completed by constructing a dataset specific for MrBayes that represented each character in the FULL dataset at a frequency corresponding to the character's estimated minimum posterior probability from ProAlign (dataset WHTD2). To minimize the number of characters in this dataset, integers (1–10 scale) were used as the factor for alignment posterior scaling (3-decimel posteriors were converted to integers by rounding up). The resulting weighted representation of the FULL dataset consisted of 16 514 characters.
Parsimony mapping of character states was performed using MacClade 4.0 (Maddison and Maddison, Reference Maddison and Maddison2000). To investigate the evolution of nematode ‘habitat’ type, species were categorized as free-living, tissue-dwelling, gastrointestinal non-invasive, or gastrointestinal tissue-dwelling (Table 1).
RESULTS
Multiple alignment and sequence model selection
The ProAlign multiple alignment of 113 nematode SSU sequences yielded a dataset of 2302 characters. This FULL dataset included several regions with indels of substantial length, both between outgroups and ingroup, and within the ingroup. Selectively removing (filtering) aligned sites with minimum posterior probabilities of 60% or less excluded 898 SSU characters (sites), yielding the filtered dataset (60FILT) of 1404 characters. The average minimum posterior probability of each site was also used as a criterion for constructing weighted datasets (WHTD and WHTD2) for use with MP, ML, and BPP analyses wherein each character was weighted according to its posterior probability in the alignment, with fractional (MP), integer (ML), or representational (BPP) scaling of the posteriors. The combination of these 4 datasets (FULL, 60FILT, WHTD and WHTD2) and 3 tree inference methods (MP, ML, and BPP) yielded 9 phylogenetic analyses. In addition, to assess the relative reliability of clades, bootstrap resampling was performed using MP and ML inference methods for the FULL, 60FILT, and WHTD datasets.
ModelTest was used to select the best-fit substitution model and parameters (e.g. gamma shape, proportion of invariable sites) for the FULL and 60FILT datasets. Models and parameters were estimated separately for these two datasets because they differ in character composition as a result of character filtering, whereas the FULL and WHTD datasets differ only by how individual characters are weighted. For the FULL and WHTD datasets, ML inference (and bootstrap ML analysis) was conducted using the GTR+G+I model with gamma shape=0·5099 and Pinvar=0·2275. For the 60FILT dataset, ML inference (and bootstrap ML analysis) was conducted using the GTR+G+I model with gamma shape=0·5711 and Pinvar=0·3443. Details concerning inferred trees (e.g. number of most-parsimonious trees, MP tree length, homoplasy indices, likelihood scores) are reported in the figure legends.
Patterns of clade III tree topology and character evolution
The 3 datasets (FULL, WHTD and 60FILT) provided phylogenetic resolution among the main taxonomic groups regardless of inference method. Analyses based on datasets with fewer characters (60FILT MP, ML and BPP) showed reduced resolution and bootstrap support when compared to the FULL or WHTD datasets (MP results Figs 1–3). Approximately 75% of the results concerning monophyly (presence or absence of) for taxonomic groups at the family level or higher did not vary based on dataset choice or inference method (Table 3). Certain major clades were strongly supported in all analyses. These included Camallanoidea and Oxyurida, which each received very strong MP and ML bootstrap support and high BPP (Table 3, Figs 1–6). Similarly, a sister-group relationship between Dracunculoidea and Camallanoidea (“Camallanina” sensuChitwood, Reference Chitwood, Skrjabin, Shults and Gnyedina1937, but note that Chitwood accepted Travassos' 1920 Camallanoidea, which included Cucullanidae) was recovered in all analyses with reliable bootstrap and BPP support (Table 3). Finally, Spirurina was sister to Camallanina in all analyses with levels of bootstrap support that varied (<50–88%) by both dataset and inference method (Table 3).

Fig. 1. Strict consensus of 2 equally parsimonious trees inferred from heuristic analysis (parsimony ratchet) of the SSU rDNA sequence dataset FULL (919 parsimony informative characters, tree length 5344, H.I.=0·64). Results from bootstrap re-sampling are shown above (parsimony) and below (maximum likelihood) internal nodes for clade frequencies exceeding 50%. Numbers within triangles show the number of species of the taxon represented in the clade; the number in parentheses (following a minus sign) indicates the number of species from the taxon that did not group with members of this clade. Asterisks mark taxa representing Ascaridida.

Fig. 2. Strict consensus of 167 equally parsimonious trees inferred from heuristic analysis (PAUP TBR branch swapping) of the SSU rDNA sequence dataset WHTD (919 parsimony informative characters, tree length 2892·28, H.I.=0·62). Results from bootstrap re-sampling are shown above (parsimony) and below (maximum likelihood) internal nodes for clade frequencies exceeding 50%. Numbers within triangles indicate the number of species of the taxon represented in the clade; the number in parentheses (following a minus sign) indicates the number of species from the taxon that did not group with members of this clade. Asterisks mark taxa representing Ascaridida.

Fig. 3. Strict consensus of 4 equally parsimonious trees inferred from heuristic analysis (parsimony ratchet) of the SSU rDNA sequence dataset 60FILT (479 parsimony informative characters, tree length 2206, H.I.=0·60). Results from bootstrap re-sampling are shown above (parsimony) and below (maximum likelihood) internal nodes for clade frequencies values exceeding 50%. Numbers within triangles indicate the number of species of the taxon represented in the clade; the number in parentheses (following a minus sign) indicates the number of species from the taxon that did not group with members of this clade. Asterisks mark taxa representing Ascaridida.
Table 3. Monophyly of selected groups based on 9 combinations of datasets and inference methods
(Numerical values indicate that the group was monophyletic in the individual analysis with the number representing the clade frequency in the corresponding bootstrap or Bayesian tree. A plus sign indicates the group was monophyletic in the individual analysis, but did not have a frequency of ⩾50% in the corresponding bootstrap tree. A negative sign indicates the group was not monophyletic in the analysis. Quotes for “Dracunculoidea”, “Heterakoidea”, and “Spirurina” refer to the consistent inclusion of most species from these groups, excepting certain rogue taxa (see Discussion). FULL, 60FILT, WHTD and WHTD2 refer to datasets (see Materials and Methods). BPP=Bayesian posterior probability, ML=maximum likelihood, MP=maximum parsimony.)

Some taxonomic groups (e.g. Heterakoidea, Spirurina, Dracunculoidea) were not exclusively monophyletic due to the consistent behaviour of 1–3 ‘rogue’ taxa. For example, the 3 Gnathostoma spp. were never included in the clade containing the remaining 24 Spirurina, but instead were always nested deep in the tree, typically as sister to Anguillicola crassus (Dracunculoidea) and with moderate bootstrap support. Clade support for the group consisting of the remaining 24 Spirurina ranged from moderate (71% by MP in the 60FILT dataset) to high (99% by MP and ML in the FULL dataset). As a consequence of the ‘rogue’ behavior of A. crassus, Dracunculoidea was not monophyletic, although the remaining 17 dracunculoid species were strongly supported as a clade in all analyses (Table 3; Figs 1–6). Similarly, Clade III taxa were not strictly monophyletic in any analysis due to the grouping of Truttaedacnitis truttae (Ascaridida, Seuratoidea) with the outgroup clade represented by Diplogasterida, Rhabditida, ‘Strongylida’, and Tylenchida. Among the 3 datasets, MP and ML bootstrap support for this unexpected grouping of T. truttae (Figs 1–3) was generally moderate to strong (76–89%), with the exception of MP inference using the FULL dataset (53%). The remaining 102 ingroup taxa were monophyletic in all 9 phylogenetic analyses (Table 3), and this result was strongly supported by MP and ML bootstrap re-sampling (95–100%) and Bayesian posterior probabilities (100%).
Trees (Figs 4–6) representing the 3 datasets (WHTD2, FULL, and 60FILT) and inferred using Bayesian, ML, and MP methods encompass the range of variation in topology and resolution observed among the nine trees produced using the full combination of datasets and inference methods. Similarly, bootstrap measures of clade support mapped on these ML and MP trees (Figs 5 and 6) generally represent the range of reliability values (Table 3). The Bayesian hypothesis for the weighted dataset (Fig. 4) is highly resolved with 99 of 105 BPP node values exceeding 95%; the lowest BPP values were recovered within Ascaridoidea. For relationships among the major clades, the topology of the Bayesian hypothesis is highly resolved and distinct from the MP trees (Figs 1–3). For example, Fig. 4 depicts a clade of Heterakoidea plus Oxyurida that is the sister group of certain Ascaridida (Ascaridoidea, certain Cosmocercoidea, Paraspidodera) plus the rhigonematid species. In turn, this large clade is sister to ‘Camallanina’ plus Spirurina. The species composition of the clades Dracunculoidea, Camallanoidea, Spirurina and Camallanina in the Bayesian hypothesis is the same as in all other analyses, with the same ‘rogue’ taxa (A. crassus, Gnathostoma spp.) resulting in non-monophyly for Dracunculoidea and Spirurina. The ML tree representing the FULL dataset (Fig. 5) depicts the same clade composition (but not necessarily within-clade relationships) as the Bayesian hypothesis (Fig. 4) for Heterakoidea, Oxyurida, Dracunculoidea, Camallanoidea, Spirurina and Camallanina. Relationships among these major clades in this ML tree are very similar to the MP result for the FULL dataset (Fig. 1), except that the 4 Heterakoidea are depicted as sister to Ascaridoidea, certain Cosmocercoidea, plus rhigonematids rather than the oxyurids (Fig. 5), but without reliable bootstrap support.
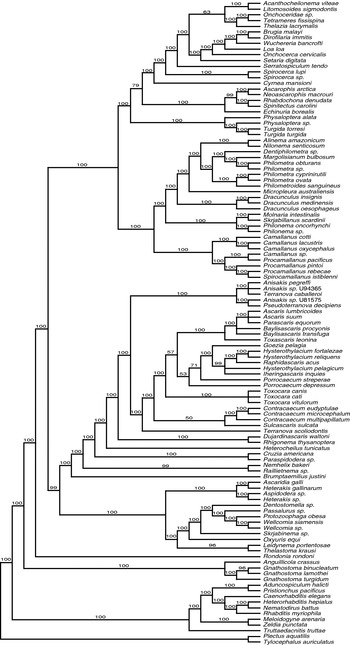
Fig. 4. Bayesian tree with MCMC posterior probabilities (above internal nodes) inferred from analysis of the SSU rDNA sequence dataset WHTD2.

Fig. 5. Maximum likelihood tree inferred from analysis of the SSU rDNA sequence dataset FULL. Heuristic search (TBR branch swapping) on neighbour-joining starting tree with 19 412 rearrangements tested. Tree score −ln likelihood 28 456·54. Results from bootstrap re-sampling and maximum likelihood inference are shown above internal nodes when values exceed 50%.

Fig. 6. Strict consensus of 4 equally parsimonious trees inferred from analysis of the SSU rDNA sequence dataset 60FILT. Parsimony tree searching was performed heuristically using the parsimony ratchet.
Resolution of species-level relationships was much greater in analyses of the FULL and WHTD datasets (e.g. Figs 4 and 5) than for the 60FILT dataset (Fig. 6). Ascaridoidea, Spirurina, and Dracunculoidea each contained some traditional superfamilies and families that were monophyletic and others that were not, although differential taxon sampling within groups is an important caveat to interpreting these results. Spirurina, Physalopteroidea and Spiruroidea were monophyletic in all analyses whereas Habronematoidea and Thelazioidea were not. In contrast, the monophyly of Filarioidea varied depending on dataset and inference method (Table 3). Similarly, within Dracunculoidea, Skrjabillanidae was always monophyletic whereas Philometridae was not; the monophyly of Dracunculidae was recovered only by MP analysis of the 60FILT dataset (Table 3). For Ascaridoidea, only Raphidascarididae was always monophyletic; Anisakidae, Ascarididae and Heterocheilidae were consistently non-monophyletic. Certain congeners were not monophyletic (Philometra, Heterakis, Hysterothylacium, Camallanus, Procamallanus, Terranova, Physaloptera), and this result was most evident in analyses of the FULL and WHTD datasets (Figs 4 and 5).
Ascaridida was among the best-sampled orders in the Clade III analysis, however, it was not monophyletic in any analysis. Some ascaridid taxa were poorly resolved in most analyses (e.g. Cruzia americana, Paraspidodera sp., Nemhelix bakeri), however, the consistent position of other ‘rogue’ Ascaridida (e.g., Rondonia rondoni, T. truttae) indicated that non-monophyly of Ascaridida was not simply the result of poor resolution. Similarly, Ascaridoidea was well sampled, but monophyletic in only 4 of 9 analyses (Table 3), usually without reliable bootstrap support or high BPP.
Certain groups showed substantial variation in their relationship to other clades in MP trees for the 3 different datasets (Figs 1–3). These taxa included the Oxyurida, Heterakoidea (minus Paraspidodera), and the 2 rhigonematids; the latter were not monophyletic in any analyses and typically were part of an unresolved polytomy (Figs 1–3). Similarly, a clade consisting of Oxyurida plus 4 of 5 Heterakoidea was recovered in 6 of the analyses (Table 3) including all analyses of 60FILT and WHTD datasets (e.g. Figs 2, 4 and 6), but was not reliably supported by bootstrap re-sampling. In contrast, with Bayesian analyses of the 60FILT and WHTD2 datasets, a sister-group relationship between the Oxyurida and the clade representing 4 of the 5 Heterakoidea received high BPP values (96–100%; Table 3, Fig. 4).
Parsimony mapping of ‘habitat’ utilization by nematodes was investigated relative to the weighted Bayesian topology (Fig. 4). Tissue parasitism among clade III taxa was derived independently at least 3 times (Fig. 7) according to this phylogenetic hypothesis. Parsimony based character reconstruction suggests that in Dracunculoidea, tissue parasitism arose directly from ancestors that were non-invasive gastrointestinal dwelling species. The other large group of 15 tissue parasites (Filarioidea and sister groups) includes both tissue-dwelling and gastrointestinal tissue-invasive species. The ancestral ‘habitat’ state for this clade and its sister clade (Ascarophis, Echinuria, Neoascarophis, Rhabdochona, Spinitectus) is equivocal (Fig. 7), and thus parsimony mapping does not reveal whether these tissue-dwelling parasites arose directly from gastrointestinal non-invasive ancestors or if such parasites gave rise to gastrointestinal tissue invasive species prior to the parasitism of non-intestinal tissues. Reversion from tissue dwelling to gastrointestinal tissue-invasive parasitism is supported in one case (Tetrameres fissispina). There was no instance of tissue-dwelling nematodes giving rise to gastrointestinal non-invasive species in the tree.

Fig. 7. Parsimony mapping of adult nematode habitat (site) on the topology inferred from Bayesian analysis of the WHTD2 dataset (Fig. 4). Outgroups clades (and T. truttae) not shown.
DISCUSSION
Relatively few hypotheses concerning the evolutionary relationships of taxa belonging to clade III have been proposed, in part because many pre-molecular concepts of nematode relationships entirely excluded zooparasitic species (Micoletzky, Reference Micoletzky1922; Maggenti, Reference Maggenti and Dougherty1963; Andrássy, Reference Andrássy1976; Lorenzen, Reference Lorenzen1981, Reference Lorenzen1994). Hypotheses including animal parasites but proposed without formal phylogenetic analysis of data did not recognize taxa belonging to clade III as a monophyletic group. For example, both Chitwood (Reference Chitwood, Chitwood and Chitwood1950) and Maggenti (Reference Maggenti, Stone, Platt and Khalil1983) suggested that Ascaridida were more closely related to Strongylida and Rhabditia than to Spirurida. Phylogenetic analysis of amino acid data representing complete mitochondrial genomes supports this hypothesis (Kim et al. Reference Kim, Eom and Park2006). Similarly, Anderson (Reference Anderson1988, Reference Anderson2000) proposed that Ascaridida and Spirurida were sister groups that in turn were more closely related to Strongylida than either was to a group consisting of Oxyurida plus Rhigonematida. Inglis (Reference Inglis and Taylor1965) depicted groupings of superfamilies rendering clade III members non-monophyletic by virtue of a sister group relationship between Oxyurida and Strongylida (in a subclass Rhabditia), with Ascaridida and Spirurida (plus Drilonematida) as members of the subclass Diplogasteria (Inglis, Reference Inglis1983). For the most part, each of these major groups (Ascaridida, Oxyurida, Rhigonematida, Spirurida) has been presumed monophyletic and ranked at ordinal level (but see Yamaguti, Reference Yamaguti1961), with the morphologically diverse order Spirurida divided into the suborders Camallanina and Spirurina (Chabaud, Reference Chabaud1974), and containing a total of 25 (Anderson, Reference Anderson2000) or 28 (Moravec et al. Reference Moravec, Molnar and Szekely1998) families.
Phylogenetic hypotheses based on nuclear small-subunit ribosomal DNA (SSU rDNA) sequences have revealed that nematodes from the orders Ascaridida, Oxyurida, Rhigonematida, and Spirurida belong to a monophyletic group, first discovered and referred to as “clade III” by Blaxter et al. (Reference Blaxter, De Ley, Garey, Liu, Scheldeman, Vierstraete, Vanfleteren, Mackey, Dorris, Frisse, Vida and Thomas1998). Subsequent analyses of SSU rDNA sequences have strongly supported the monophyly of clade III taxa (De Ley and Blaxter, Reference De Ley, Blaxter and Lee2002; Bert et al. Reference Bert, Messiaen, Manhout, Houthoofd and Borgonie2006; Holterman et al. Reference Holterman, Van Der Wurff, Van Den Elsen, Van Megen, Bongers, Holovachov, Bakker and Helder2006; Wijová et al. Reference Wijová, Moravec, Horák and Lukes2006), although published studies have been very limited in their taxonomic sampling. In an overview and re-analysis of SSU data, De Ley and Blaxter (Reference De Ley, Blaxter and Lee2002) presented a revised phylogenetic tree and classification scheme introducing 5 infraorders for clade III taxa (Ascaridomorpha, Spiruromorpha, Rhigonematomorpha, Oxyuridomorpha and Gnathostomatomorpha) and representing Dracunculoidea as incertae sedis. In this SSU-based hypothesis (De Ley and Blaxter, Reference De Ley, Blaxter and Lee2002), Oxyuridomorpha was sister to a clade consisting of Ascaridomorpha, Spiruromorpha and Rhigonematomorpha, whereas Gnathostomatomorpha and Dracunculoidea were unresolved within clade III. These clade III infraorders were collectively ranked as suborder Spirurina, although this usage is not followed herein and instead Spirurina is used in the traditional sense for spirurid taxa excluding Dracunculoidea and Camallanoidea. In the current study we used published and new SSU sequences representing clade III species to increase the number and taxonomic diversity represented in the phylogenetic hypothesis. These analyses of 103 clade III taxa include 39 Ascaridida, 9 Oxyurida, 2 Rhigonematida, and 53 Spirurida. Although this diversity is a substantial improvement over previous studies, several groups of particular interest (e.g. Aproctoidea, Pharyngodonidae, Rictularioidea, Spiroxyinae, and Subuluroidea) are not yet represented by SSU sequences, and some groups are represented by few species.
In cases where taxon sampling is poor (e.g. families within Spirurida), it is unwarranted to interpret small clades in the SSU tree as supporting the monophyly of the larger group (e.g. family). In contrast, robustly supported evidence of paraphyly or polyphyly for poorly sampled groups is unlikely to change with additional sampling, and such results provide evidence of discordance between SSU phylogenies and taxonomy. Interpreting discordance between SSU trees and taxonomy as evidence of the need for systematic revision is subject to caveats involved in interpreting a phylogeny inferred from a single gene as representing nematode evolutionary history. Therefore, confirmation of these results with data from independent genes (and more taxa) seems prudent prior to initiating substantial taxonomic revision. Some published molecular phylogenies of clade III taxa have focused more narrowly on questions involving specific groups such as Ascaridoidea (Nadler and Hudspeth, Reference Nadler and Hudspeth1998, Reference Nadler and Hudspeth2000), Dracunculoidea (Wijová et al. Reference Wijová, Moravec, Horák, Modry and Lukes2005, Reference Wijová, Moravec, Horák and Lukes2006) and Filarioidea (Casiraghi et al. Reference Casiraghi, Bain, Guerrero, Martin, Pocacqua, Gardner, Franceschi and Bandi2004). A few such studies have resolved relationships among closely related taxa using more rapidly evolving genes (than SSU rDNA); these studies should be consulted when relationships among closely related species are at issue.
For most of the higher taxonomic groups analysed, topological results of phylogenetic analyses of SSU rDNA were robust to differences among tree inference methods; most taxonomic groups were consistently either monophyletic or non-monophyletic in MP, ML and BPP analyses. For groups that were monophyletic in some analyses but not others, no consistent patterns were evident relative to the 3 inference methods used. Many phylogenetic results were also robust to different datasets (FULL, WHTD, WHTD2 or 60FILT) that reflected different approaches to dealing with variation in positional homology confidence. Exceptions included Filarioidea, which was monophyletic in all 60FILT analyses (and the WHTD MP analysis), but not with other dataset and analysis combinations. In this case, only the most conservative approach to treating alignment ambiguity (exclusion of sites with low posterior probabilities) regularly recovered a monophyletic Filarioidea.
Phylogenetic groups that were recovered in all trees representing 9 combinations of datasets and inference methods were robust to these treatments of data, including different assumptions of the inference methods (e.g. parsimony versus explicit model-based methods). Taxa representing Camallanoidea, Oxyurida, Physalopteroidea, Raphidascarididae, and Skrjabillanidae were each monophyletic in all analyses. Certain sister-group relationships were also recovered in all 9 analyses. These included the relationship of ‘Dracunculoidea’ and Camallanoidea; a clade that has been previously recognized based on morphological and life-cycle features and referred to as Camallanina (Chitwood, Reference Chitwood, Skrjabin, Shults and Gnyedina1937). This clade was strongly supported as assessed by bootstrap re-sampling and BPP. A sister-group relationship between Dracunculoidea and 3 camallanids was previously reported (Wijová et al. Reference Wijová, Moravec, Horák and Lukes2006). Spirurina (except Gnathostoma) was always recovered as the sister group of Camallanina, with moderate to high reliability. Interestingly, the 2 skrjabillanids (Molnaria intestinalis and Skrjabillanus scardinii), taxa that have larvae carried in the blood stream and transmitted by ectoparasitic crustaceans, are strongly supported as nested within dracunculoids. This topological result supports previous interpretations of convergence in transmission patterns between skrjabillanids and certain filarioids (Anderson, Reference Anderson2000). Finally, a monophyletic Thelastomatoidea was the sister group to Oxyuroidea in most analyses of the FULL and WHTD datasets, but not in analyses of the 60FILT data. Thus, informative characters excluded from the 60FILT dataset are key to recovering reciprocal monophyly between pinworms parasitizing arthropods and mammals. Although recovering a sister group relationship between Oxyuroidea and Thelastomatoidea was data-set dependent, this relationship is not consistent with evolutionary scenarios wherein oxyurid parasites of vertebrates were derived from ancestors parasitizing arthropods (Chitwood, Reference Chitwood, Chitwood and Chitwood1950), or from insects early in the evolution of tetrapods (Anderson, Reference Anderson1984).
Some additional clades that were recovered in all analyses included the vast majority of sampled species from taxonomic groups that were otherwise non-monophyletic due to the consistent misplacement of one or few ‘rogue’ taxa. This complicates referring to these large clades using conventional taxonomic names, because these names do not strictly make reference to monophyletic groups. For example, 17 of 18 Dracunculoidea were recovered as monophyletic in all analyses; the paraphyly of this superfamily was due to the consistent position of A. crassus as sister to Gnathostoma spp., a result reported previously (Wijová et al. Reference Wijová, Moravec, Horák and Lukes2006) based on SSU rDNA. Wijová et al. (Reference Wijová, Moravec, Horák and Lukes2006) accepted De Ley and Blaxter's (Reference De Ley, Blaxter and Lee2002) phylogenetically based recognition of Gnathostomatomorpha for the Gnathostoma spp. that did not group with other Spirurida, and interpreted the rogue behaviour of A. crassus as supporting removal of this species from Dracunculoidea and recognition of the superfamily Anguillicoloidea Sobolev, Ivaschkin, Tichomirova and Khromova 1971. The monophyly of Dracunculoidea has also been suggested based on morphological characters, notably the putatively derived condition of the cephalic papillae (Chabaud and Bain, Reference Chabaud and Bain1994). Rogue taxa were also responsible for the non-monophyly of Spirurina, with 24 (of 27 total) Spirurina always monophyletic, with paraphyly again caused by rogue behaviour of the 3 Gnathostoma species. This ‘unexpected’ position of Gnathostoma has also been reported previously (De Ley and Blaxter, Reference De Ley, Blaxter and Lee2002; Blaxter, Reference Blaxter2003; Holterman et al. Reference Holterman, Van Der Wurff, Van Den Elsen, Van Megen, Bongers, Holovachov, Bakker and Helder2006; Wijová et al. Reference Wijová, Moravec, Horák and Lukes2006). Although gnathostomes have traditionally been included in Spirurida, Chabaud and Bain (Reference Chabaud and Bain1994) suggested that they were not only “one of the most archaic” Spirurida, but that it was “difficult to propose a precise hypothesis for their origin”. Given the morphological diversity of Gnathostomatoidea, representatives of other genera should be sampled to more thoroughly test this result and the monophyly of the superfamily.
Other clades recovered in all 9 analyses included 4 of 5 heterakoids, with a fifth rogue taxon, Paraspidodera, typically recovered as sister to C. americana (Cosmocercoidea). This clade of 4 Heterakoidea was sister to Oxyurida in all analyses except those using the FULL dataset. Finally, the uniform recovery of T. truttae (Ascaridida, Seuratoidea) with one of the outgroup clades rendered clade III paraphyletic; however, there was strong support for monophyly of the remaining 102 ingroup taxa. The most common explanations for rogue taxa do not appear to account for these particular instances (see below), and thus these results are provisionally accepted as the working SSU-based phylogenetic hypothesis. To simplify referencing these clades that contain most (but not all) of the members of a taxonomic group, they are subsequently referred to with the group name in quotation marks (e.g. “Dracunculoidea” refers to the clade of 17 taxa).
Rogue taxa that have unexpected yet strongly supported relationships in phylogenetic analyses can result from several causes. Errors in multiple sequence alignment are one source of potential error; however, clade III rogue taxa also occur in analyses of the 60FILT dataset, suggesting that alignment is not a likely cause. Long-branch attraction (LBA) is the most frequently cited explanation for erroneous phylogenetic results, including rogue taxa. The attraction between “long branches” was first documented for MP (Felsenstein, Reference Felsenstein1978), but is also known to effect parametric methods such as ML when the model assumptions are violated (Sanderson and Shaffer, Reference Sanderson and Shaffer2002). Documenting individual cases of LBA can be difficult (Huelsenbeck, Reference Huelsenbeck1997) since the attraction depends on the number of characters, their heterogeneity, and the length of the branches involved. In some cases this artifact can be rectified by sampling additional taxa that ‘break’ the branch, which argues for increased taxon sampling generally (and for more species belonging to the rogue lineage specifically). Another strategy to test for LBA is to use different inference methods, including approaches such as ML that are less susceptible to LBA if the model is correct. However, for the most glaring clade III rogue taxa (T. truttae, Gnathostoma spp., A. crassus), ML inference yields the same results as MP. Some other causes of unexpected relationships include errors in organism identification and pitfalls with molecular methods, including potential PCR artifacts that can occur with mixed (contaminated) DNA templates. Whereas misidentifications can be discovered by re-examination of voucher specimens, sequence artifacts are more likely to be revealed by sampling of additional congeners and comparative analysis. Likely errors in some SSU sequences were evident as a result of comparisons of data in this study, leading to the exclusion of a few sequences from the multiple alignment and analyses. For example, Dracunculus medinensis GenBank AY852268 differs from D. medinensis GenBank AY947720 at 16 SSU sites in pair-wise alignment (4 mismatches, 12 indels) and AY852268 also shows sequence differences at SSU sites that are invariant among other published Dracunculus spp. sequences. Finally, an alternative explanation for rogue taxa is that the conventional viewpoint is wrong and that a new phylogenetic paradigm is justified. Such new findings may be more common in cases where nematode relationships have been constructed from plesiomorphic or highly homoplastic characters (Nadler et al. Reference Nadler, De Ley, Mundo-Ocampo, Smythe, Patricia, Bumbarger, Adams, De Ley, Holovachov and Baldwin2006b; Smythe and Nadler, Reference Smythe and Nadler2006).
Both the dataset (FULL, WHTD or 60FILT) and the inference method influenced the relative reliability of clades as estimated by bootstrap re-sampling and Bayesian posterior probabilities. Analyses based on the dataset with fewer characters (60FILT) had lower clade support in most cases, and Bayesian posteriors were higher than bootstrap clade frequencies (MP and ML) in most cases, a result previously documented in analyses of other taxa (Alfaro et al. Reference Alfaro, Zoller and Lutzoni2003; Erixon et al. Reference Erixon, Svennblad, Britton and Oxelman2003; Lemmon and Moriarty, Reference Lemmon and Moriarty2004; Taylor and Piel, Reference Taylor and Piel2004). However, Bayesian posteriors and bootstrap clade frequencies are not equivalent measures of confidence (Alfaro et al. Reference Alfaro, Zoller and Lutzoni2003). A clade with a high bootstrap frequency is expected to be recovered in other analyses of datasets generated by the same fundamental process (Felsenstein, Reference Felsenstein1985); bootstrap re-sampling measures repeatability (Berry and Gascuel, Reference Berry and Gascuel1996). In contrast, Bayesian Markov Chain Monte Carlo (MCMC) posterior probability sampling is useful for assessing how well data support results of a fully probabilistic model of character evolution; Bayesian posterior probabilities are results conditioned on the observed data and models employed. Whether the difference between BPP and bootstrap frequencies of clades is due to overestimation when using posterior probabilities (Taylor and Piel, Reference Taylor and Piel2004) or an underestimation in the case of nonparametric bootstrap values (Soltis and Soltis, Reference Soltis and Soltis2003) appears to be model-dependent (Wilcox et al. Reference Wilcox, Zwickl, Heath and Hillis2002; Taylor and Piel, Reference Taylor and Piel2004). Although having an accurate assessment of clade reliability is important, differences between BPP and other inference methods is of greater concern where clade composition is conflicting, which was generally not the case in analyses of SSU data for clade III.
Within Spirurina and Camallanina, clade membership in these SSU trees generally reflected patterns of host habitat utilization (gastrointestinal non-invasive versus tissue localization) rather than taxonomy. Within Camallanidae, results strongly supporting paraphyly of camallanid genera, a finding consistent with the call for broad taxonomic revision of this family (Wijová et al. Reference Wijová, Moravec, Horák and Lukes2006). Of 3 main clades resolved within Spirurina, 1 contains gastrointestinal non-invasive nematodes only (Physalopteroidea), another contains a clade of 4 intestinal parasites of fishes representing 2 superfamilies and including 1 species (Neoascarophis macrouri) that is tissue invasive within the intestine. The fifth member of this clade (Echinuria borealis) is also tissue invasive in the proventriculus of birds. The third main clade of Spirurina includes 14 species representing several superfamilies, all of which have various degrees of tissue invasiveness, localizing in sites ranging from within lymphatics (Wuchereria bancrofti), to within the body cavities (Litomosoides), to tissue-dwelling within the gastrointestinal tract (T. fissispina, Cyrnea mansioni). Other tissue-dwelling species in clade III include Dracunculoidea, which have an intestinal (non-invasive) sister group in SSU trees (Camallanoidea), and A. crassus, which has an intestinal tissue-dwelling sister group (Gnathostoma). Parsimony character mapping of host ‘habitat’ reveals that tissue dwelling has evolved independently at least 3 times within clade III, a result consistent with what Chabaud and Bain (Reference Chabaud and Bain1994) referred to as the “strong organotropism” of the Spirurida. The variety and pattern of different host habitats used by tissue-dwelling spirurids (e.g. “Spirurina” or “Dracunculoidea”) suggests that there is substantial evolutionary plasticity in site predilection among tissue-dwelling lineages. For the large clade of ingroup taxa in Fig. 4 (but excluding Gnathostoma spp., A. crassus, and T. truttae for simplicity), non-invasive gastrointestinal dwelling is the inferred ancestral state. Therefore, subject to caveats of taxon sampling, the phylogenetic hypothesis indicates that tissue dwelling in Dracunculoidea arose directly from a non-invasive gastrointestinal dwelling ancestor. Although non-invasive gastrointestinal dwelling is also the ancestral state for ‘Spirurina’, parsimony mapping is ambiguous with respect to whether tissue-dwelling Spirurina arose directly from non-invasive gastrointestinal ancestors or if such parasites gave rise to gastrointestinal tissue-dwelling species prior to the parasitism of non-intestinal tissues. Additional taxon sampling might be valuable for resolving this issue. Reversion from the tissue-dwelling state to gastrointestinal tissue-invasive parasitism is supported in one case (T. fissispina). There was no instance of gastrointestinal non-invasive species evolving from tissue-dwelling ancestors in the tree, although this could change with additional sampling of clade III species. This result appears to support (and extend to adults) the hypothesis of Read and Skorping (Reference Read and Skorping1995) regarding the selective advantages of tissue dwelling for nematodes. Similarly, analysis of predilection site evolution in Strongylida also shows a strong phylogenetic component (Chilton et al. Reference Chilton, Huby-Chilton, Gasser and Beveridge2006) and some degree of evolutionary plasticity, with 1 lineage from ungulates living in the lungs (Dictyocaulus), a second clade occurring in the gastrointestinal tract and pulmonary system of mammals and birds (Trichostrongyloidea, Strongyloidea, and Ancylostomatoidea), and a third lineage (Metastrongyloidea) mainly inhabiting the pulmonary system of mammals, but also utilizing other tissue types (central nervous system, circulatory system, frontal sinuses, and musculature) within certain definitive hosts (Carreno and Nadler, Reference Carreno and Nadler2003).
In all analyses, an unidentified “onchocercid” (labelled Onchocercidae sp. in trees) was sister to T. fissispina with 100% bootstrap or BPP frequency. Based on an analysis of SSU sequences and their unusual tail morphology, Bert et al. (Reference Bert, Messiaen, Manhout, Houthoofd and Borgonie2006) hypothesized that these unidentified “onchocercid” larval specimens isolated from the bottom sediment of a drinking pool for cattle were free-living Filarioidea, and suggested that this was a possible example of the loss of parasitism. However, re-analysis with additional SSU sequences shows that these unusual larvae are more closely related to Tetrameres, which also have unusual tail structures in larval stages (Anderson, Reference Anderson2000). Given that Tetrameres spp. parasitize the proventriculus of various birds, an alternative explanation for these persistent cattle pool larvae is that they have been regularly introduced from infected birds visiting the water sources.
Some taxonomic groups were not monophyletic in any of the 9 analyses. In these cases some taxa were non-monophyletic because members were robustly resolved as belonging to different clades (Habronematoidea, Philometridae, Thelazioidea). For other groups, non-monophyly resulted from poor resolution in some analyses whereas in other analyses members of the same groups appeared reliably resolved as components of different clades (Heterocheilidae, Rhigonematida). For Thelazioidea, it has been argued that the morphological characters used for group membership (involving the mouth opening shape) are shared ancestral characters that are inappropriate for indicating evolutionary relationships (Chabaud and Bain, Reference Chabaud and Bain1994). In addition, some of the ‘deeper’ clade III nodes representing relationships among certain major groups of interest (Oxyurida, Ascaridida, Heterakoidea, Spirurida) showed substantial variation among the 9 analyses, with sister-group relationships among major clades dependent on both dataset and method of analysis. For example, when resolved, ‘Heterakoidea’ was most often sister to Oxyurida, although more rarely heterakoids were sister to a group consisting of Ascaridoidea plus assorted cosmocercoids and rhigonematids (Ascaridoidea plus ‘stem taxa’). Strong support for the heterakoid plus oxyurid sister group relationship was only recovered in Bayesian analysis of 2 datasets (WHTD2 and 60FILT), but this indicates that this hypothesized relationship is not an artifact of including alignment-ambiguous SSU characters in the analysis. The clade consisting of Ascaridoidea plus assorted ‘stem taxa’ was another group showing variation in sister group relationships. In this case, results varied by both dataset and inference method. Some analyses supported a sister group relationship between Ascaridoidea plus stem taxa and Oxyurida plus ‘Heterakoidea’ (WHTD2 Bayesian analysis; WHTD ML not shown), whereas most analyses recovered a closer relationship between Ascaridoidea plus stem taxa and ‘Spirurida’ with variation in the position of ‘Heterakoidea’. Most 60FILT analyses lacked resolution concerning sister group relationships for Ascaridoidea plus stem taxa, indicating that alternative resolutions of sister-group relationships in this case are dependent on including characters that are more subjective with respect to positional homology inference. Bayesian trees provided the highest support for resolution of these ‘deep’ relationships among major clades; however, Bayesian results from different datasets were not always in agreement. For example, unlike the result for WHTD Bayesian analysis, analysis of the FULL dataset supported a sister group relationship (92% BPP) between Ascaridoidea plus stem taxa and a group consisting of ‘Heterakoidea’ plus ‘Spirurida’ (tree not shown). Conservative interpretation of these results would suggest that understanding sister group relationships among these major groups (Oxyurida, ‘Heterakoidea’, ‘Spirurida’ and Ascaridoidea/stem taxa) will require additional sequence data to resolve relationships with confidence.
We thank R. Cole, S. D'Amelio, H.-P. Fagerholm, J. Fellis, R. Gasser, G. Lyons, L. Munson, L. Paggi, M. Rigby, X. Zhu, and M. Zuk for providing specimens used for sequencing. Several species were collected by R. A. C. as part of a parasite inventory of the Area de Conservación Guanacaste, Costa Rica. We thank Dr Dan Brooks, coordinator of the inventory, for facilitating these collections. We are grateful to Shelley McMahon for providing the Perl scripts for parsimony ratchet searches. This research was supported by NSF Tree of Life grant DEB-0228692.


