INTRODUCTION
The ‘crowding effect’ (Read, Reference Read1951) is a density-dependent mechanism operating within individual hosts, characterized by decreased size or fecundity of individual parasites as the number of parasites per host increases. Host inflammatory reactions, interference competition through excretion of inhibitory compounds, and exploitation competition as parasites encounter limited critical resources such as nutrients or space have been hypothesized (Roberts and Insler, Reference Roberts and Insler1982; Bush and Lotz, Reference Bush and Lotz2000; Roberts, Reference Roberts2000) to explain the crowding effect. Theoretical and empirical studies suggest that when resources are limiting, the size or fecundity of individual parasites (y) varies with number of parasites (N) according to an inverse relationship, y=R/N, where R represents the total resources of the host (Michaud et al. Reference Michaud, Milinski, Parker and Chubb2006), but observed patterns may be more complex (Shostak and Scott, Reference Shostak and Scott1993). Accurate measurement of parasite size may help discriminate among alternative hypotheses of causation.
A crowding effect on larval parasites within their intermediate hosts is common (Shostak and Scott, Reference Shostak and Scott1993; Heins et al. Reference Heins, Baker and Martin2002; Brown et al. Reference Brown, De Lorgeril, Joly and Thomas2003) and may affect parasite populations through effects on the asexual reproduction of larval parasites, as in the Digenea (Brown et al. Reference Brown, De Lorgeril, Joly and Thomas2003) or carry-over effects of larval size on development of the adult parasite (Fredensborg and Poulin, Reference Fredensborg and Poulin2005). Only a few (Keymer, Reference Keymer1980; Hurd and Arme, Reference Hurd and Arme1987) of the studies on crowding of the cestode Hymenolepis diminuta in the intermediate host report parasite size, usually by lengths and/or widths. Lengths and widths reveal relative changes in parasite size but may provide insufficient resolution to assess the use of host resources by this parasite, because larval H. diminuta change shape during development (Voge and Heyneman, Reference Voge and Heyneman1957; Hurd and Arme, Reference Hurd and Arme1987; Shostak et al. Reference Shostak, Walsh and Wong2006). Hypotheses on nutrients as a limiting resource have been tested on other parasites using volume as a proxy for mass (Shostak et al. Reference Shostak, Rosen and Dick1985; Brown et al. Reference Brown, De Lorgeril, Joly and Thomas2003). Volume also directly measures space utilization by the parasite, and can help test hypotheses involving space as a limiting resource. A set of geometric approximations for H. diminuta in Tribolium confusum (Shostak et al. Reference Shostak, Walsh and Wong2006) now makes it possible to estimate parasite volume and study the crowding effect on this parasite in its intermediate host with greater resolution than previous studies.
Manipulation of host diet has been used to study growth of adult cestodes (Roberts, Reference Roberts and Arai1980), but has been used less commonly on larval forms. The shape of H. diminuta changes in T. confusum on reduced food intake, suggesting that the growing parasite may alter the allocation of resources to different regions of its body (Shostak et al. Reference Shostak, Walsh and Wong2006). The question remains whether patterns of resource allocation by the parasite affect overall parasite size and the expression of any crowding effect.
Multiple infections may discriminate between space and nutrients as limiting resources. Space should be relatively constant in a host that does not grow. If space is limiting, parasites should occupy a similar maximum total space in the host. There may be limits to the amount of nutrients parasites can obtain from the host during any time-interval but the cumulative amount of nutrients available should increase over time. If nutrients are limiting, parasites that accumulate in the host gradually over time should grow larger than if they had all arrived simultaneously. The few studies using multiple exposures of beetles to H. diminuta have not measured the parasites (Heyneman and Voge, Reference Heyneman and Voge1971; Maema, Reference Maema1986) or evaluated parasite size with respect to number of exposures (Keymer, Reference Keymer1980; Gordon and Whitfield, Reference Gordon and Whitfield1985).
The main objective of this study was to evaluate the crowding effect on H. diminuta infections in T. confusum, by determining the quantitative relationship between parasite numbers, growth and development, while manipulating host diet and the number and timing of exposures to the parasite. A second objective was to quantify parasite growth throughout the developmental period in beetles, and identify periods of slow and rapid growth that might correlate with periods of low or high resource demands by the parasite.
MATERIALS AND METHODS
Hosts and parasites
Details of host and parasite sources, maintenance, infection, necropsy and photographic procedures are presented elsewhere (Shostak et al. Reference Shostak, Walsh and Wong2006) with modifications or clarifications noted below. Briefly, T. confusum were maintained on a flour/brewer's yeast medium at 26°C. Four categories of beetles were used: stock colony (mixed age and sex, presumably mated), known-age mixed-sex (presumably mated), known-age virgin females and virgin males (housed with sexes separated since pupa stage). Beetles were fasted 4 days prior to overnight (~18 h) exposure to eggs of H. diminuta. Various times post-exposure (p.e.) beetles were sexed, killed by crushing the head, and dissected in saline. Parasites were counted and photographed for later measurement.
Experimental design
Experiment 1 used groups of beetles from our stock colony, exposed once, with subsequent ad libitum feeding (Fig. 1, protocol 1), to obtain quantitative data on parasite development and growth. Fasted beetles were separated at random into 10 groups of 20. Each group was exposed in an acrylic ring (44 mm inside diameter) placed on a filter paper (Whatman no. 1; 55 mm diameter) with a 400 μl aliquot of distilled water containing 20 000 parasite eggs, and covered. Beetles were left in arenas overnight and then removed to a dish of medium and stored at 26°C. One dish was selected at random daily from day 5 to day14 p.e. and beetles were killed and examined for parasites.
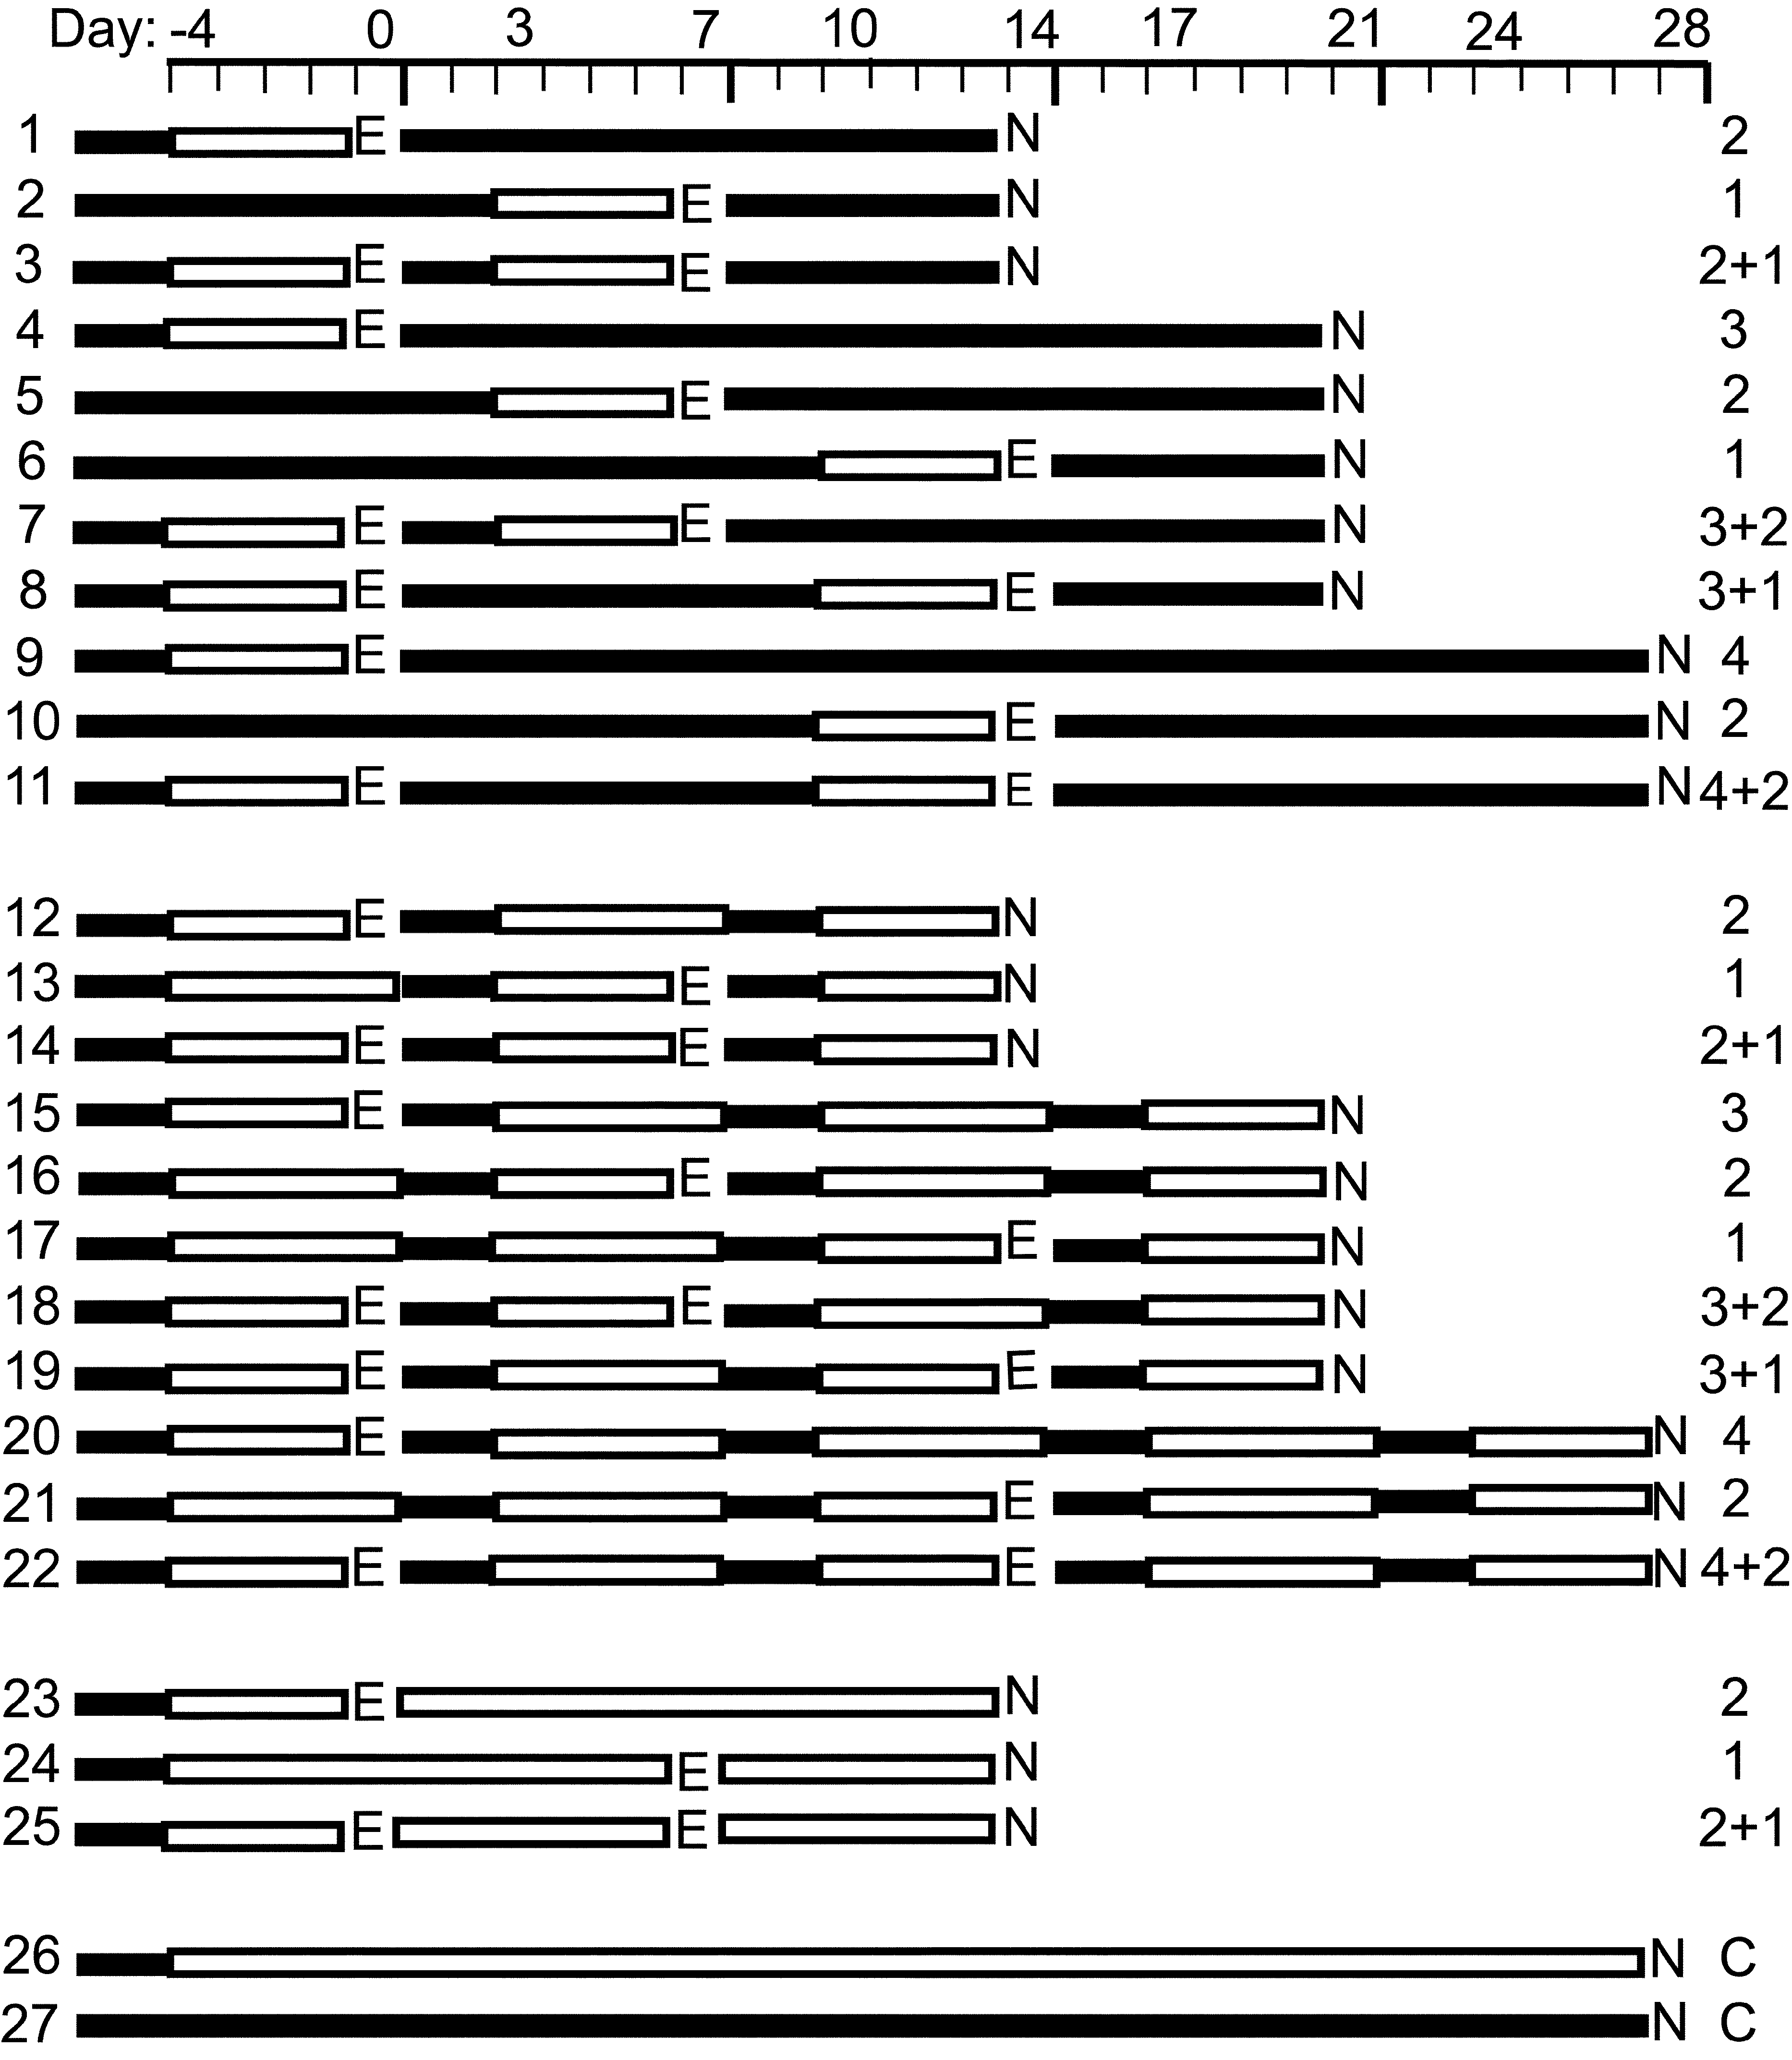
Fig. 1. Infection and necropsy protocols. Numbers at left are protocol numbers. Numbers across top indicate day of experiment. Numbers at right indicate expected age of parasites (weeks) at time of necropsy with compound entries (e.g. 2+1) indicating the ages of infections from the two separate exposures. C, uninfected control; E, time of exposure; N, time of necropsy. Black bars indicate time on food; open bars indicate time off food.
Experiment 2 used individual beetles from our stock colony, exposed once or twice, to produce single infections that were 1, 2, 3 or 4 weeks old at the time of necropsy, or double infections of various age combinations (Fig. 1): ad libitum feeding (protocols 1–11, 27), partial feeding (protocols 12–22), and fasting (protocols 23–26). The reduced number of protocols performed on fasted beetles was due to high mortality after 2 weeks fasting. Faeces (<3 days old) from infected rats were softened in water and sections of H. diminuta strobila were removed and divided into pieces containing 2–4 proglottids. Proglottid pieces and beetles were both allocated to 16 ml vials at random, and left overnight. The following day, any proglottid remnants were removed and 0·5 ml of medium was added (except for fasted beetles). Protocols 1–11 (Fig. 1) were performed twice with n=15–40 beetles each time, protocols 12–22 were done once with 20–40 beetles each time, and protocols 23–27 were done 4 times with n=10–40 beetles each. Exposures in Exp. 2 were done in irregular order over a period of 24 months.
Experiment 3 used individual, known-age beetles, exposed once with subsequent ad libitum feeding (Fig. 1, protocol 1) to test the effects of host age and reproductive status on final parasite size. Beetles were exposed to 2000 parasite eggs in water placed on a 12·5×12·5 mm square of filter paper in a 16 ml vial (Shostak et al. Reference Shostak, Walsh and Wong2006). One set of exposures used beetles exposed as pairs (2 virgin females, 2 virgin males, 1 virgin female and 1 virgin male, or 2 same-age mixed-sex beetles). Beetles were first paired at the time of exposure and were then kept together until necropsy. Sample size was n=12 pairs per age× reproductive status combination. A second set of exposures used beetles (virgin females, virgin males, or same-age mixed-sex beetles) exposed individually. Sample size was n=8 beetles per age× reproductive status combination.
Measurement of parasites
Each photographed parasite was characterized to developmental stage and a series of morphological measurements was made. Developmental stages of H. diminuta were based on the scheme described by Voge and Heyneman (Reference Heyneman and Voge1957): stage 2 – ovoid to pear-shaped (elongation in one direction only); stage 3 – tripartite body (elongation in both directions from a larger mid-region) with some scolex development but scolex never withdrawn; stage 4 – scolex withdrawn but poor development of outer fibrillar layer and indistinct separation between body and cercomer; stage 5 – scolex withdrawn, well-developed outer fibrillar layer present, and distinct separation between body and cercomer. In our Exp. 1, we further subcategorized stage 3 parasites as follows: stage 3a – tripartite body with no sucker development; stage 3b – rudimentary suckers present but scolex retraction cavity still indistinct; stage 3c – suckers and scolex retraction cavity distinct, with clear demarcation between scolex and mid-body region.
The size of parasites immediately following infection of the host was estimated by measuring length, width and depth of oncospheres within freshly collected eggs and converting those to volumes assuming that oncosphere shape is ellipsoid. We use ‘body’ in pre-stage 4 parasites to refer to the entire organism, and in stage 4 and stage 5 parasites to refer to the ovoid portion comprising the scolex and surrounding tissue layers. Volumes of stage 2 and 3 parasites were estimated in Exp. 1 using an integration method (Shostak et al. Reference Shostak, Walsh and Wong2006) for increased accuracy, but in Exp. 2 were estimated using the simple formulas and conversion factors in Shostak et al. (Reference Shostak, Walsh and Wong2006). ‘Cercomer’ refers to the elongate projection from the body of stage 4 and stage 5 parasites (Shostak et al. Reference Shostak, Walsh and Wong2006). We measured body and cercomer length, and width or depth (depending on specimen orientation) and estimated parasite volumes using methods and geometric representations of the parasite as described elsewhere (Shostak et al. Reference Shostak, Walsh and Wong2006). Scolex width of stage 4 and 5 parasites was measured at the level of the suckers.
Data analysis
The individual host was the unit of statistical replication unless otherwise noted. We averaged parasite volumes within each host to produce a single ‘mean volume per parasite’ for each host, and these values when averaged across hosts produced a ‘grand mean volume per parasite’ based on n hosts. We summed parasite volumes to produce a single ‘total parasite volume’ for each host, and these values when averaged across hosts produced a ‘mean total parasite volume’ based on n hosts. There were some instances when we treated the individual parasite as the unit of replication and used its ‘individual parasite volume’; these values when averaged across hosts produced a ‘mean individual parasite volume’ based on n parasites. Unless we explicitly refer to the cercomer or body portion, all references are to the volume of the entire parasite. We averaged scolex widths within each host to produce a single ‘mean scolex width’, and these values when averaged across hosts produced a ‘grand mean scolex width’ based on n hosts. Broken parasites were assigned the mean volume of other intact parasites of the same stage from the same host to determine total parasite volume per host. A host was excluded from analysis if it harboured any parasite stage for which all specimens were broken.
Statistical analyses, except for simulations, were conducted using SYSTAT or SAS software. Data were transformed where necessary to meet assumptions of statistical tests, but were back-transformed to original units for presentation in figures or tables. The variations in experimental design that produced our data set made it possible to test a variety of hypotheses statistically. However, given the variation we used in exposure methods or dose, and age or reproductive status of hosts, we performed statistical testing only on subsets of data where non-treatment factors were similar, or where we had previously tested for their effects and found no significant difference. In all cases we used α=0·05 to determine statistical significance. Degrees of freedom in statistical tests are reported as subscripts following the appropriate statistic.
The effect of a pre-existing infection on growth of parasites from a second exposure was assessed by comparing intensity-specific mean volume per parasite in a double-exposed host to the mean volume per parasite expected from a single exposure with the same total intensity. We used hosts with intensity >7 so there was some expectation of density-dependent effects, and hosts in which all parasites had reached the cysticercoid stage so that results were not confounded by ongoing parasite growth. We hypothesized that if the presence of parasites from the first exposure did not affect growth of parasites from the second exposure, then the mean size per parasite in a host following 2 exposures would be greater than in a host with the same number of parasites following a single exposure, because each of the 2 exposures would behave like a lower-intensity infection.
We tested density-dependent effects on parasite volumes by a simulation procedure (Shostak and Scott, Reference Shostak and Scott1993) that uses the mean size and s.d. of parasites when intensity=1 (P max) to estimate c.l. for mean size per parasite at higher intensities under the hypothesis of density-independence. A shift of hosts from within, to below, the lower 95% c.l. at a given intensity is indicative of crowding. The procedure also uses mean total size per host and s.d. of parasites when total size has reached an asymptote (H max), to estimate confidence limits for mean size per parasite under the alternative hypothesis of density-dependent growth with a single, evenly shared limiting resource. The procedure was implemented in a computer spreadsheet (Microsoft Excel). We estimated the means and s.d. separately for female and male hosts, and did 1000 randomizations for each intensity, taking the sizes that excluded the upper and lower 2·5% of observations at each intensity as the 95% c.l.
RESULTS
Infection parameters
This study used 1708 beetles. Control (unexposed) beetles comprised n=142 that died prior to necropsy, and n=189 that survived and harboured no parasites. Exposed beetles comprised n=447 that died prior to necropsy, n=164 that remained uninfected, and n=766 that became infected and harboured 1–44 parasites each. Of the 5587 individual parasites recovered, 5136 could be measured for at least body length. The remaining 451, mostly stage 3, were broken.
Single exposures of beetles produced similar infections among experiments. In Exp. 1, 139/196 beetles (71%) became infected with 1–29 (mean=5·5) parasites per infected beetle. In Exp. 2, 275/334 (82%) became infected with 1–43 (mean=7·0) parasites per infected beetle. In Exp. 3, 201/244 beetles (82%) became infected with 1–44 (mean=6·4) parasites per infected beetle.
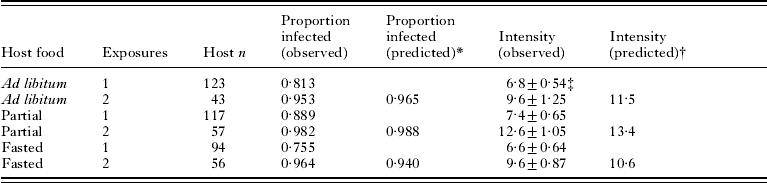
Infections following double exposures were evaluated using hosts from Exp. 2 (Table 1). There was a significant difference in prevalence (the proportion of hosts infected) among host diets after a single exposure (likelihood ratio chi-square; χ22=6·7, P=0·03) although even the lowest prevalence (fasted hosts) was still >75%. After a second exposure, 95–98% of hosts on each diet were infected. Observed prevalences (Table 1) were within 2% of the proportion predicted under an assumption that the probability of infection was the same for each exposure. Log-transformed intensity (number of parasites per infected host) was similar among diets (Table 1) after a single exposure (ANOVA; F 2, 272=1·64, P=0·20) and after 2 exposures (ANOVA; F 2, 148=2·94, P=0·056). Observed intensities after 2 exposures (Table 1), were lower than predicted under the assumption that the same diet-specific prevalences and intensities from exposure 1 would apply to exposure 2 (linear contrast in ANOVA, testing the hypothesis that intensity=log 11·5, log 13·4 and log 10·6 for hosts fed ad libitum, partially, or fasted, respectively; F 3, 148=11·6, P<0·001).
Table 1. Prevalence and intensity of infection with Hymenolepis diminuta in Tribolium confusum exposed 1 or 2 times to proglottids

* P1+P1(1−P1), where P1 is the observed proportion infected following 1 exposure.
† 2I/(2−P1), where I is the observed mean intensity and P1 is the observed proportion infected following 1 exposure.
‡ Mean±s.e.
Host survival to 2 weeks p.e. was determined for beetles in Exps 2 and 3. Within diets there were no significant differences between control and exposed hosts (ad libitum, 87·4% of 454 exposed hosts and 91·4% of 185 control hosts survived, P=0·16; partial, 85·2% of 183 exposed hosts and 89·7% of control hosts, P=0·46; fasted, 33% of 454 exposed hosts and 26·6% of control hosts, P=0·13). Survival varied significantly (P<0·001) among diets; it was high (88·6% of 639 hosts) in hosts fed ad libitum and fed partially (86·0% of 222 hosts), but low in fasted hosts (31·4% of 612 hosts).
Parasite development
Parasites in Exp. 1 passed relatively quickly and synchronously through developmental stages 2–5 (Fig. 2). Parasites transformed from 100% stage 2 on day 5 p.e., to predominantly stage 3c on day 7 p.e., to predominantly stage 4 on day 9 p.e., and to 100% stage 5 by day 10 p.e. (Fig. 2). Parasites at day 7 p.e. ranged from stage 3a to stage 4.
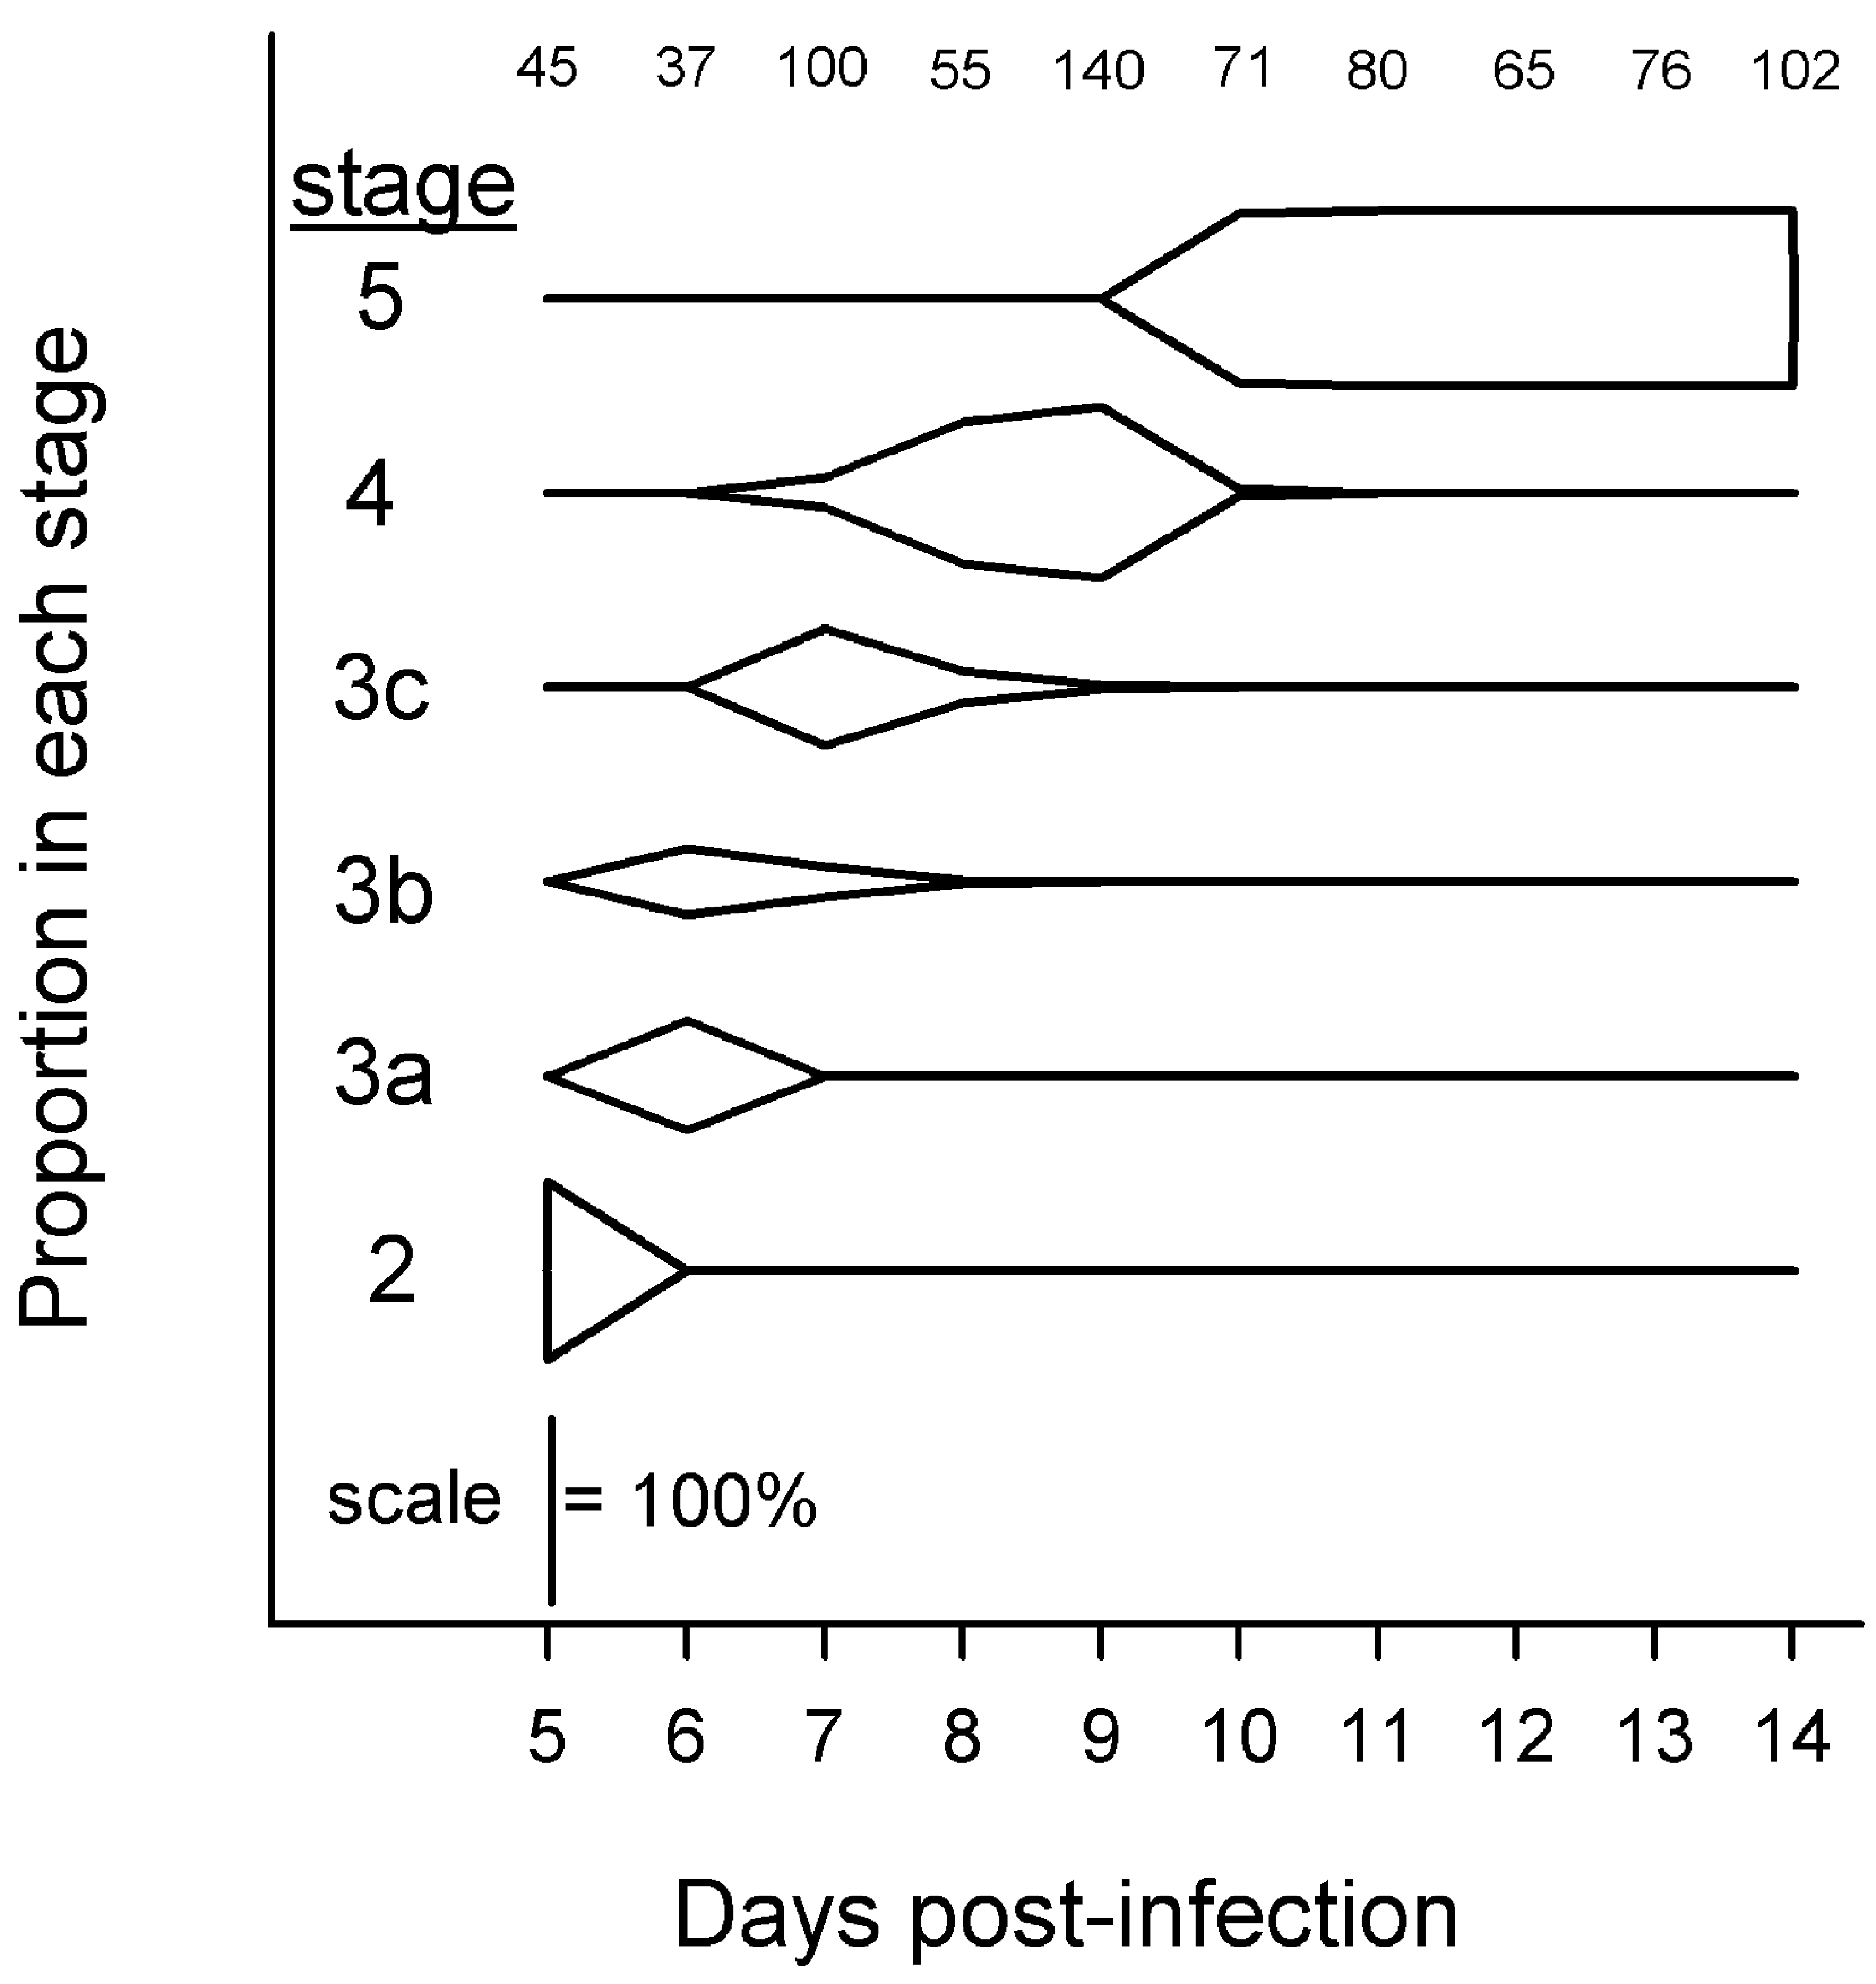
Fig. 2. Proportions of Hymenolepis diminuta at different developmental stages in mixed-sex Tribolium confusum fed ad libitum. Only hosts from Exp. 1 with ⩽parasites were used. Numbers at top indicate sample size of parasites categorized each day.
One-week-old parasites, from an initial or second infection of hosts in Exp. 2, were mostly stage 3 parasites (n=1041), with fewer stage 2 (n=21) and stage 4 (n=88) parasites. The mean parasite stage within each host was used as an index of development and was compared among host diets (ad libitum, partial, fasted), number of exposures (1, 2) and total parasites per host (⩽7, >7) in a fully factorial ANOVA. There was a significant effect of diet (F 2, 141=10·47, P<0·001) in which the index of development did not differ between hosts fed partially (mean stage=3·06) or fasted (mean stage=2·98) (Tukey test: P=0·194) but was higher in hosts fed ad libitum (mean stage=3·27) than in hosts fed partially (P=0·014) or fasted hosts (P<0·001). There was also a significant effect of number of exposures (F 2, 141=4·16, P=0·043) with development more advanced in beetles exposed once (mean stage=3·14) than beetles exposed twice (mean stage=3·03). There was no effect of the total number of parasites present (F 2, 141=0·09, P=0·768), and no interactions were significant (P>0·05 in all cases). All parasites (n=3246) from hosts examined when infections were at least 2 weeks old were at stage 5, regardless of intensity, host diet or number of exposures.
Volume of individual parasites
Parasites in Exp. 1 grew during the transition from stage 2 to 3a, and from stage 3a to 3c, but not from stage 3c to 4 (Fig. 3A). Transformation from stage 4 to 5 initiated another period of growth from day 10–13 p.e. which then appeared to reach a plateau (Fig. 3A). Both body and cercomer volumes of stage 4 parasites were unchanged over time (Fig. 3B). The growth of stage 5 parasites from day 10 to day 14 p.e. (Fig. 3A) was due to a continual increase in the volume of the body, not the cercomer (Fig. 3B). Scolex width, which we first measured on stage 4 parasites, remained constant over time (Fig. 3C).

Fig. 3. Size of Hymenolepis diminuta at different ages and developmental stages in mixed-sex Tribolium confusum. (A) Total volume per parasite. (B) Separate measurement of volumes of the body and cercomer portion of parasites. (C) Width of the scolex. Only hosts from Exp. 1 with ⩽7 parasites were used. Data are mean size per parasite±95% c.l. Numbers indicate sample size of individual parasites.
The volume of stage 5 parasites was highly variable. We obtained a full set of measurements from 843 parasites that appeared to be lying directly on their side, and which possessed an unbroken cercomer. In these, only the body depth and cercomer depth measurements needed to be estimated. Mean individual parasite volume was 0·0131±0·0048 s.d. mm3, the coefficient of variation was 37%, and the range of volumes observed varied over 10-fold (0·0032–0·0362 mm3).
Our focus in evaluating parasite size was on the effects of parasite density, host sex and diet, and a majority of data was obtained from mixed-age, randomly mated beetles with 2-week-old infections. However, some data were available from other infections which allowed us to assess the effects of host age and reproductive status, and parasite age, as potential confounding effects on individual volume of stage 5 parasites. We selected only infections with intensity=1 (to avoid confounding effects of density) in hosts fed ad libitum, and analysed using anova. There was no difference according to host age in Exp. 3 for one trial involving female beetles 4, 5, 8 or 52 weeks old (F 3, 8=0·40, P=0·76), a second trial involving female beetles 2, 4, 6 or 8 weeks old (F 3, 3=1·91, P=0·30) or a third trial involving male beetles 2, 4, 6, 8 or 28 weeks old (F 4, 10=0·43, P=0·78). A trial in Exp. 3 involving beetles of known reproductive status (virgin vs. mated) revealed no effect of host sex (F 1, 37=1·74, P=0·19) or reproductive status (F 1, 37=0·54, P=0·47) and no sex×reproductive status interaction (F 1, 37=0·001 P=0·98). There was no difference in Exp. 2 among parasites aged 2, 3 or 4 weeks (F 2, 57=3·03, P=0·06); although parasites were larger in female hosts (F 1, 57=5·98, P=0·02), there was no sex×age interaction (F 2, 57=2·46, P=0·09).
Intensity effects on volume of individual parasites
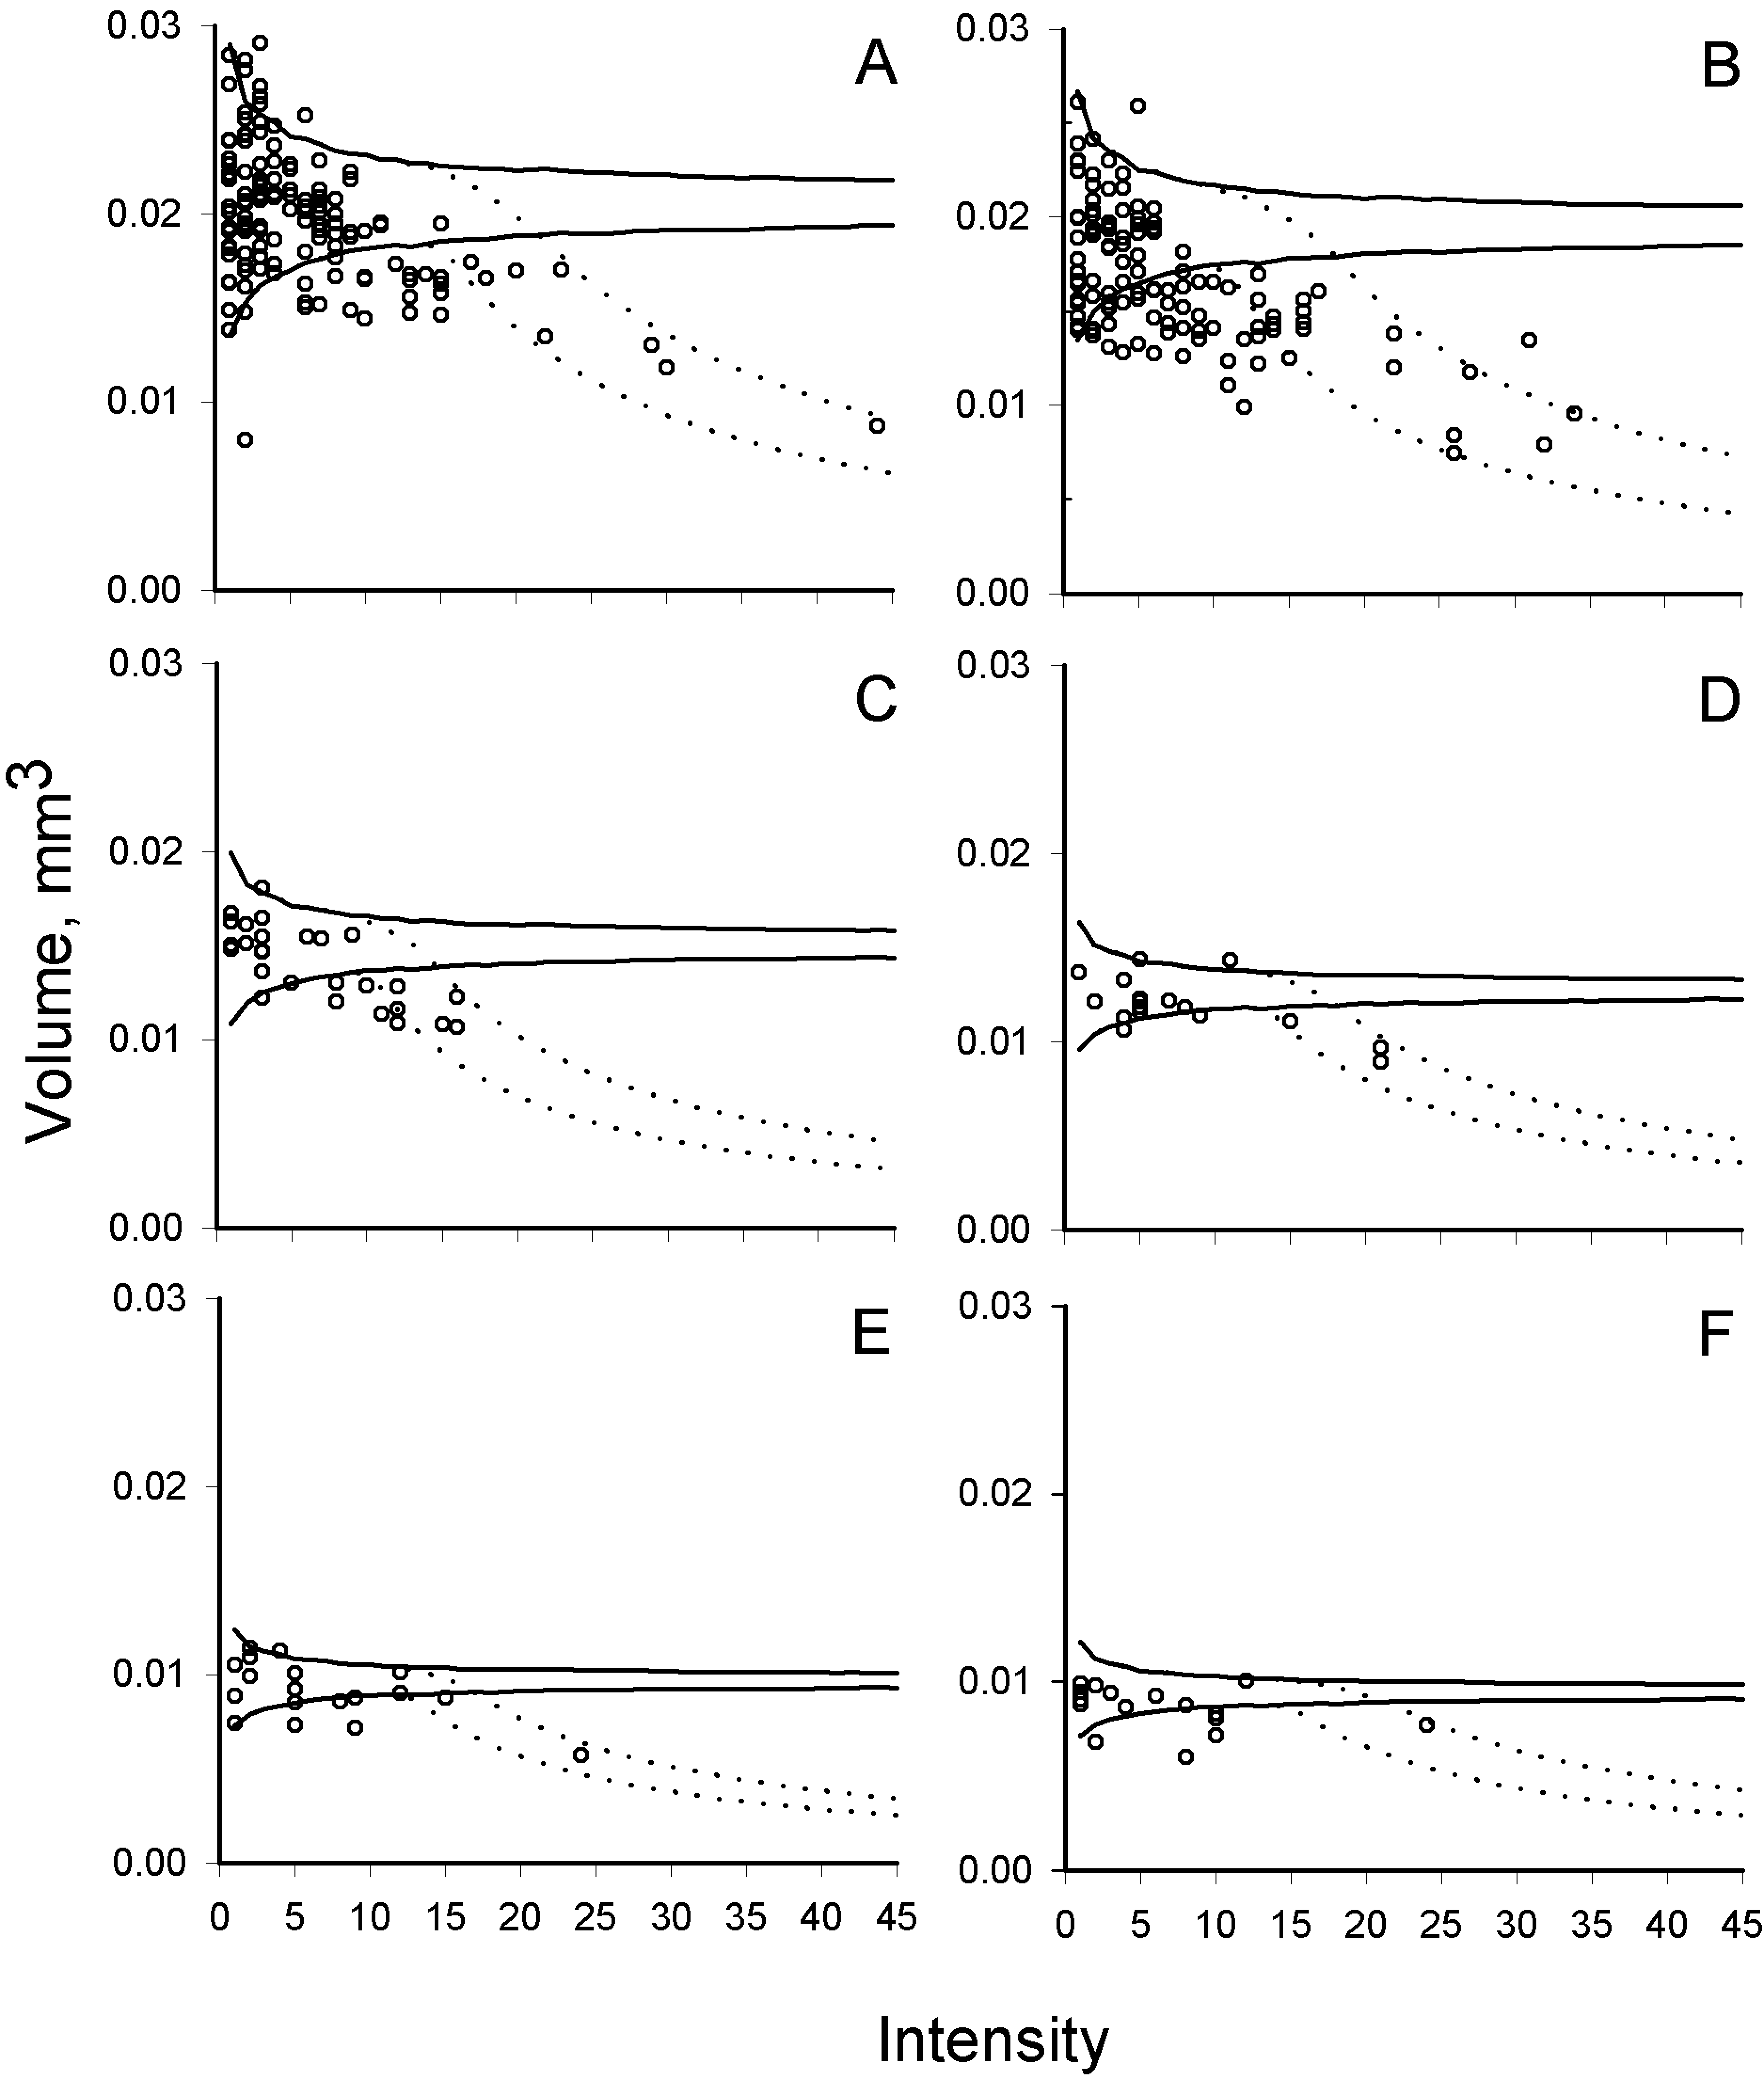
A simulation procedure (Shostak and Scott, Reference Shostak and Scott1993) based on a log-normally distributed P max indicated that mean individual parasite volumes during the developmental period (Exp. 1) were consistent with density-independent growth over the observed range of intensities from days 5–8 p.e. (Fig. 4A–D). Starting 9 days p.e, there was density-dependent depression of growth between intensities 21 and 26 (Fig. 4E), and as parasites grew from day 10 to day 14 p.e., the first signs of density-dependent growth were observed at progressively lower intensities: no lower than 10 on day 10 p.e. (Fig. 4F), 8 on day 11 p.e. (Fig. 4G), 6 on day 12 p.e. (Fig. 4H), 13 on day 13 p.e. (Fig. 4I) and 5 on day 14 p.e. (Fig. 4J). The larger sample size of stage 5 parasites at 14 days p.e. (pooled from Exps 2 and 3) permitted application of the simulation procedure to hosts stratified by sex and diet (Fig. 5.) The largest sample size was in hosts fed ad libitum and clearly showed that parasites in female hosts exhibited signs of density-dependent growth reduction at intensities >5, whereas stunting in male hosts was evident with only about 3–4 parasites (Fig. 5A, B). While reduction in host food availability reduced parasite size (Fig. 5C–F), it did not reduce the intensity at which crowding was evident. Parasite volume even in fasted hosts (Fig. 5E, F) was density independent at intensities <5. Although the hypothesis of density-independent parasite growth was clearly rejected, the simple alternative hypothesis of density-dependent parasite volume resulting from sharing of host resources (based on a log-normally distributed H max), was also not supported. The simulations showed that while parasite volumes in most hosts were within the c.l. at intensities approximately ⩽5 and ⩾15, most observations at intermediate intensities (6–14) fell below the lower c.l. (Fig. 5).

Fig. 4. Size of developing Hymenolepis diminuta in mixed sex Tribolium confusum 5–14 days p.e. Circles: observed mean volume per parasite per beetle. Lines: 95% c.l. determined by simulation under a null hypothesis HO of density-independent growth. (A) Day 5 p.e., P max=−2·65±0·14. (B) Day 6 p.e., P max=−2·40±0·14. (C) Day 7 p.e., P max=−2·02±0·11. (D) Day 8 p.e., P max=−2·12±0·07. (E) Day 9 p.e., P max=−2·12±0·13. (F) Day 10 p.e., P max=−2·02±0·06. (G) Day 11 p.e., P max=−2·04±0·07. (H) Day 12 p.e., P max=−1·92±0·08. (I) Day 13 p.e., P max=−1·93±0·10. (J) Day 14 p.e., P max=−1·85±0·04. Only hosts from Exp. 1, fed ad libitum, were used.

Fig. 5. Size of stage 5 Hymenolepis diminuta in Tribolium confusum at 14 days p.e. Circles: observed mean volume per parasite per beetle. Solid lines: 95% c.l. determined by simulation under a null hypothesis HO of density-independent growth. Dotted lines: 95% c.l. determined by simulation under an alternate hypothesis HA of density-dependent growth in which parasites share a single limiting resource in proportion to the number of parasites present. (A) Females fed ad libitum, P max=−1·70±0·10, H max=−0·45±0·05. (B) Males fed ad libitum, P max=−1·72±0·09, H max=−0·60±0·07. (C) Females fed partially, P max=−1·83±0·08, H max=−0·77±0·05. (D) Males fed partially, P max=−1·90±0·07, H max=−0·73±0·04. (E) Fasted females, P max=−2·02±0·07, H max=−0·88±0·04. (F) Fasted males, P max=−2·03±0·07, H max=−0·80±0·05. Only hosts from Exps 2 and 3 were used.
The relationship between host sex, diet and infection intensity was examined in more detail using only hosts from Exps 2 and 3 that received a single exposure 2 weeks prior to necropsy. Although our experiment was structured in a way amenable to analysis by a single 3-factor anova (sex, diet, intensity), we could not remove significant heterogeneity of variances even by using various data transformations (Bartlett's test, P<0·001 in all cases), because variances seemed to depend not only on mean parasite size but also on intensity. Therefore, we used 2-factor anovas with interactions (host sex: male or female; host diet: ad libitum feeding, partial feeding, or fasted) separately on each of several intensity groupings. The grouping of intensities was needed because our experiments did not generate infections at each level of intensity for all combinations of sex and diet. The sparseness in sample size was more acute as intensity increased, but we found that a simple doubling of intensity interval sizes (1, 2–3, 4–7, 8–15, and >15) resulted in the presence of data for each treatment combination, and following log transformation of parasite volumes there was homogeneity of variances (Bartlett's test, P>0·05 in all cases). Following each anova, pair-wise comparisons (Tukey test) tested differences in mean volume per parasite between specific combinations of host sex and diet.
Mean volume per parasite exhibited a consistent pattern relative to host sex and diet at intensity classes 1, 2–3, 4–7, and 8–15 (Fig. 6A). Parasites were largest in females fed ad libitum, smaller in males fed ad libitum and male and female hosts fed partially, and smallest in fasted male and female hosts. In the >15 category, the only significant difference in volume was between parasites in female hosts fed ad libitum vs. fasted hosts (Fig. 6A). A parallel analysis of the volume of the body portion only (Fig. 6B) exhibited a pattern of significant differences among treatment groups similar to that seen in Fig. 6A, with body volumes in partially fed hosts becoming more similar to those in hosts fed ad libitum. The volume of the cercomer portion only (Fig. 6C) was opposite to the pattern observed for the body portion (Fig. 6B). Cercomer volumes in hosts fed ad libitum were much larger than in hosts fed partially, which were more similar, although still significantly larger, to cercomers in fasted hosts. Most comparisons between sexes in the same diet and intensity category were non-significant (Fig. 6C). Mean scolex widths (Fig. 6D) were generally similar among male and female hosts fed ad libitum or partially fed. Mean scolex widths were significantly smaller in fasted vs. fed hosts at intensities ⩽15, but in the >15 category there were no significant differences among any treatment groups. The largest parasites were recovered from female hosts fed ad libitum carrying a single parasite, and the smallest were from fasted female hosts with >15 parasites. In comparisons between those two groups, grand mean volumes per parasite were 0·0212–0·0057 mm3, a range of 3·7×; grand mean body volumes were 0·0148–0·0048 mm3, a range of 3·1×; grand mean cercomer volumes were 0·00626–0·00084 mm3, a range of 7·5×; and grand mean scolex widths were 0·114–0·094 mm, a range of 1·2×.

Fig. 6. Allocation of growth to different body regions of 2-week-old, stage 5 cysticercoids of Hymenolepis diminuta recovered from Tribolium confusum kept on different diets. (A) Grand mean volume per parasite. (B) Grand mean volume per parasite of the body portion only. (C) Grand mean volume per parasite of the cercomer portion only. (D) Grand mean scolex width. Data are means across hosts±least squares s.e. Letters above bars indicate results of post-hoc comparisons (Tukey test) among host sex and diet categories within each intensity category; bars with the same letter do not differ (P>0·05).
Log-transformed mean volume per stage 5 parasite, resulting from a single exposure at least 2 weeks old with intensity >7, declined significantly with increasing intensity in female hosts fed ad libitum (R 240=0·72, P<0·001) or partially (R 217=0·21, P=0·028), and male hosts fed ad libitum (R 240=0·41, P<0·001) or partially (R 213=0·68, P<0·001) but not in fasted females (R 25=0·31, P=0·114) or males (R 26=0·00, P=0·862). Volume per stage 5 parasite in all groups of fed hosts following a double exposure were distributed similar to the volumes predicted for the same intensity after a single exposure (binomial P for HO: proportion=0·5; females fed ad libitum: 4/7 larger than predicted, P=1·000; females fed partially: 15/23 larger, P=0·210; males fed ad libitum: 5/10 larger, P=1·000; males fed partially: 7/14 larger, P=1·00). However, parasites in fasted hosts of both sexes were larger in a double exposure than would be predicted following a single exposure of corresponding intensity (females: 17/18 larger than predicted, P<0·001; males: 9/10 larger, P=0·021).
We used data from Exp. 1, with infections with ⩽7 parasites, to assess intensity-independent, daily changes in individual parasite volume throughout the developmental period. The 7-parasite maximum was chosen as a conservative limit for density-independent growth; many developing infections <14 days p.e. had higher intensities yet no evidence of crowding (Fig. 4). We pooled the various developmental stages present on each day to produce a measure of mean individual parasite volume. Oncospheres measured within eggs (2·43×10−5±s.d. 3·1×10−6 mm3, n=20) were used as the estimate of parasite volume at day 0 p.e. A regression of oncosphere volumes (day 0 p.e.) and mean individual parasite volumes (days 5, 6 and 7 p.e.) indicated that growth in mean individual parasite volume (Y) during the interval 0–7 days p.e. was exponential: log Y=−4·601+0·371X (R 2=0·99, n=71) in female hosts, where X is age in days; log Y=−4·620+0·370X (R 2=0·98, n=44) in male hosts. During this exponential phase of growth the daily gain in parasite volume peaked at day 7 p.e. (Fig. 7). Parasites continued to grow from day 7 to day 14 p.e., although now in an approximately linear fashion (Fig. 7). Although the individual parasites were larger, their daily gain in volume dropped markedly in both sexes, and from day 8 p.e. onwards was less than 1/3 of the rate at the peak (Fig. 7).
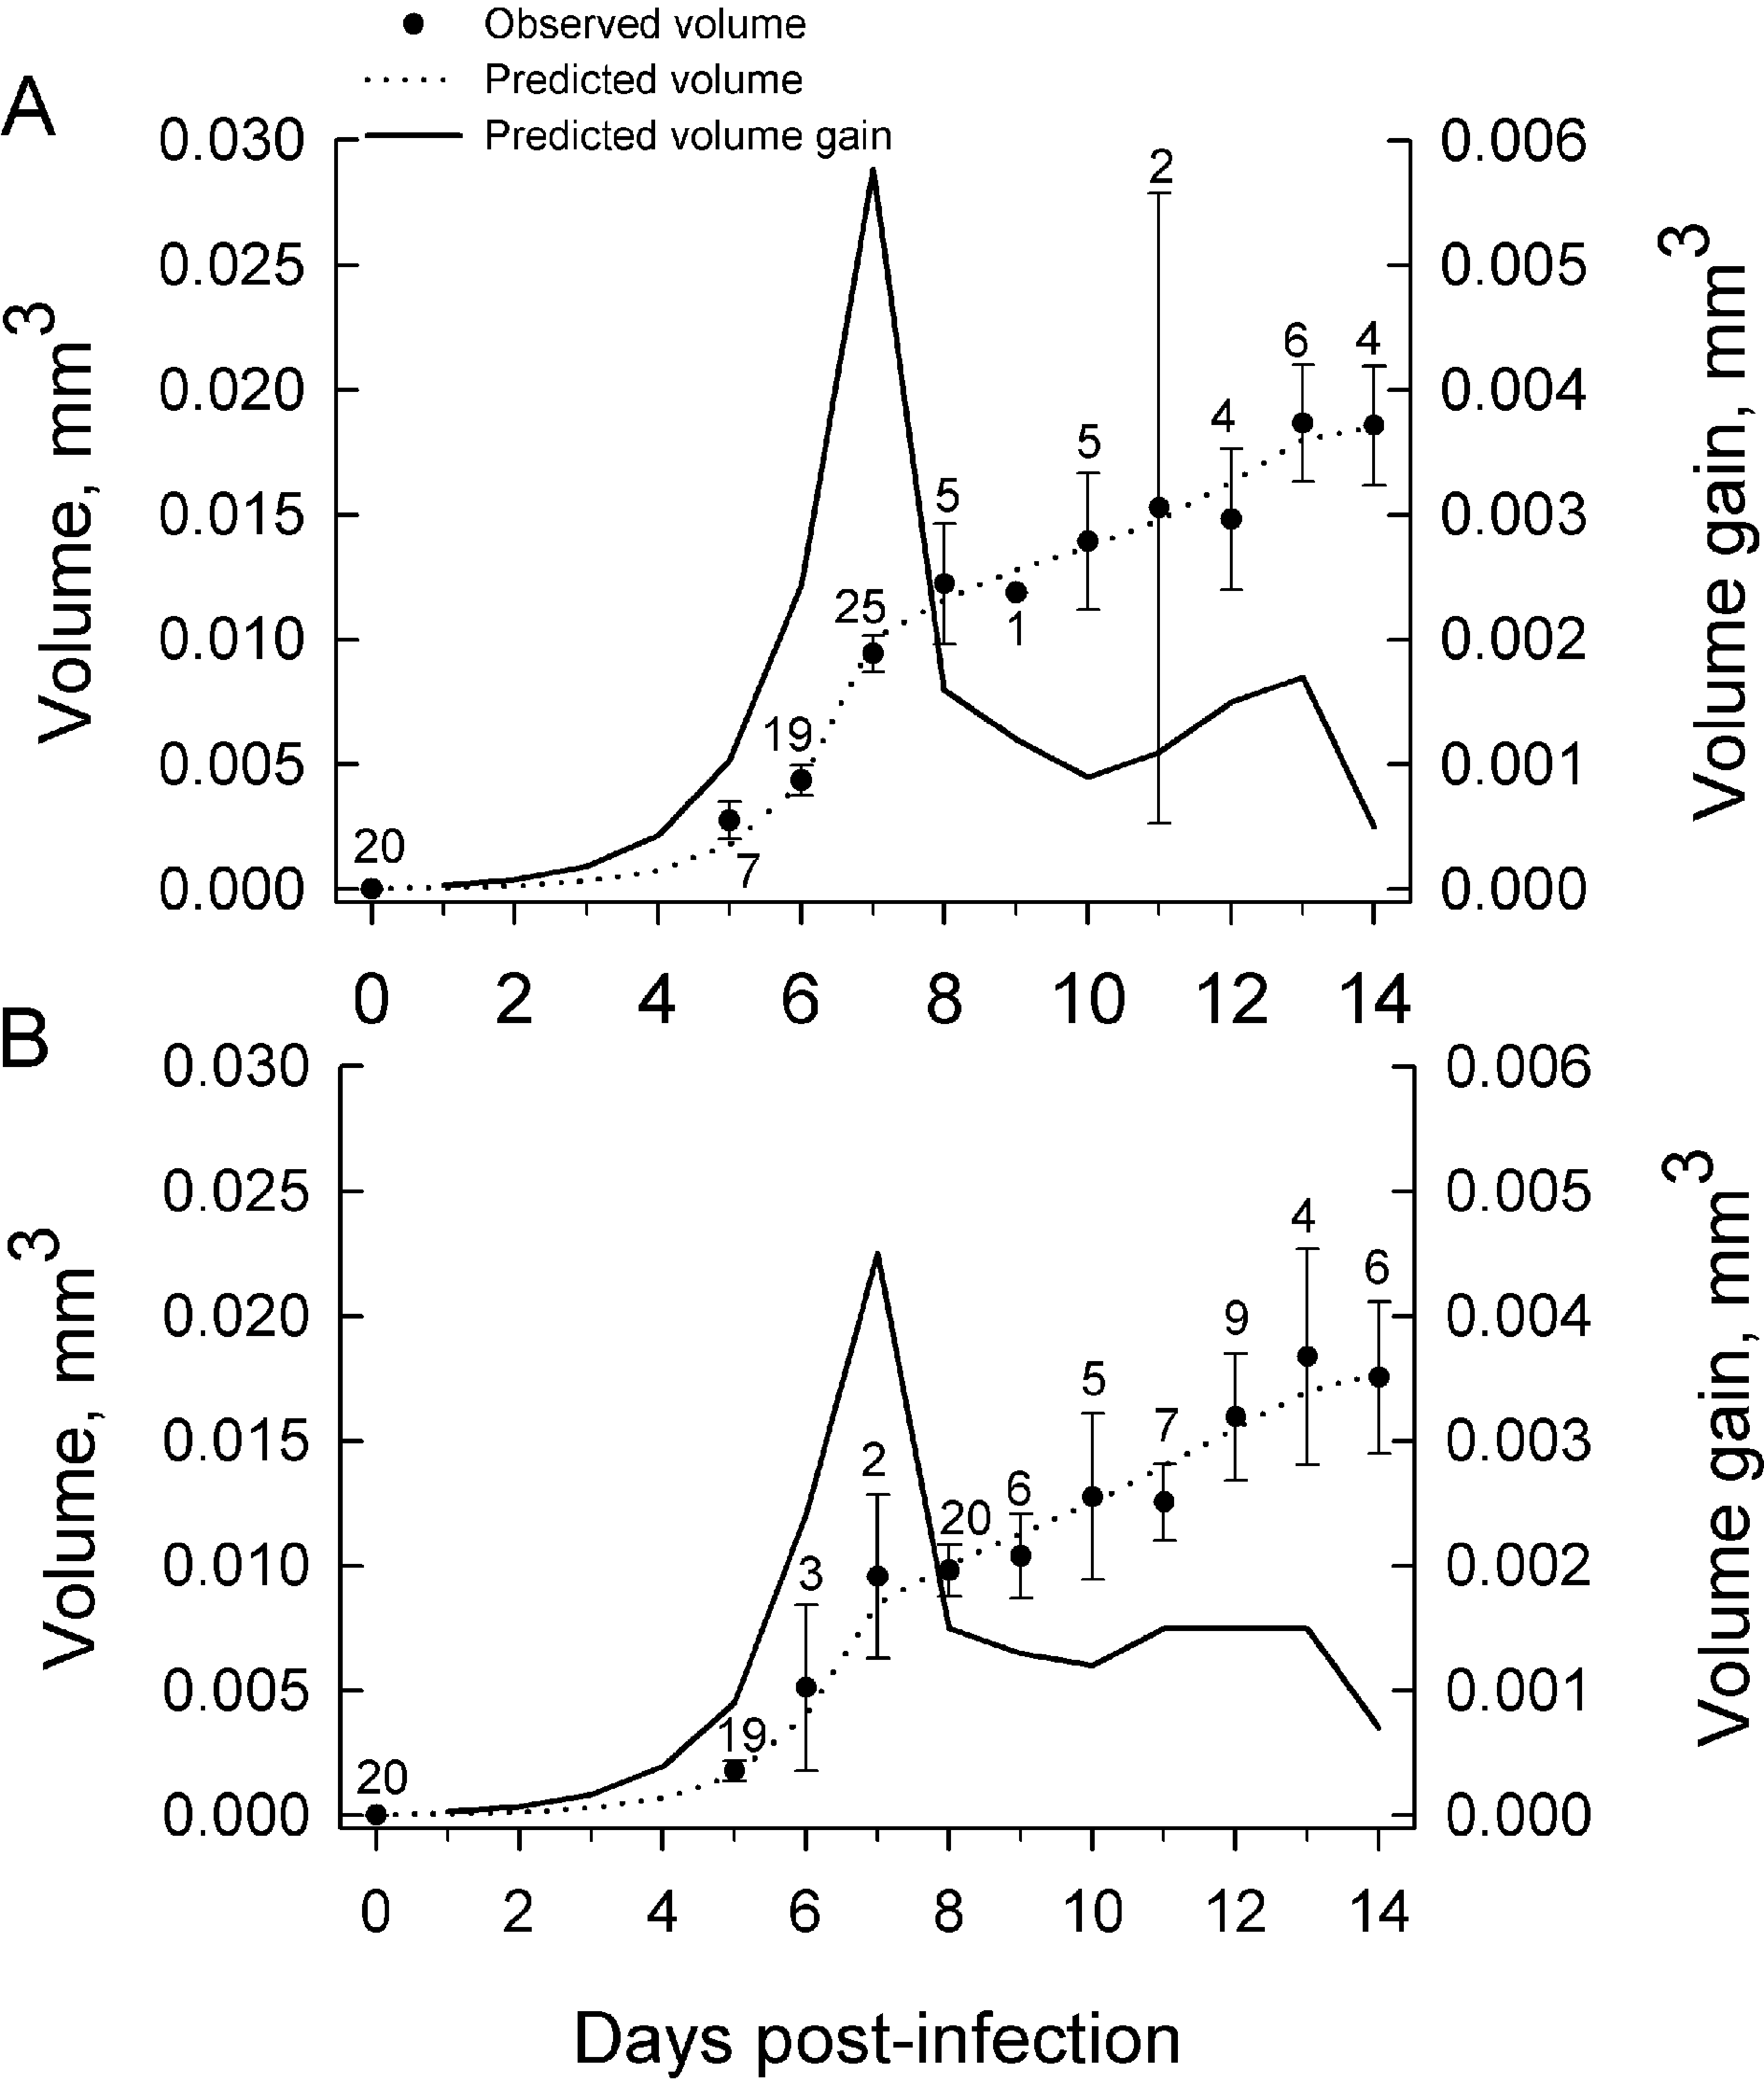
Fig. 7. Changes in size of Hymenolepis diminuta during development in female (A) and male (B) Tribolium confusum. Only hosts from Exp. 1 with ⩽7 parasites were used. Observed values are mean individual volume±95% c.l. Numbers indicate sample size of parasites. Day 0 data from measurement of oncospheres within eggs. Predicted volume v assumed exponential growth from days 0–7 p.e. and was fitted by eye from days 7–14 p.e. Predicted daily volume gain for day t was estimated as v t – v t−1.
Intensity effects on total parasite volume per host
In the absence of intensity-dependent effects, total parasite volume per host should rise linearly with a slope equal to the volume of a parasite in a single infection i.e. as if each additional parasite grew to the full size it would have in a single infection. This, combined with the observation of significant differences in parasite volumes among host sexes and diets in single infections (Fig. 6A), leads to a prediction of different slopes in total parasite volume per host even under intensity-independent conditions (Fig. 8). Slopes calculated from infections with ⩽7 parasites in both sexes and all diets were significantly greater than 0 (low P), a good fit (high R 2), linear (no systematic deviation from the regression line), and the c.l. for each slope included the slope expected under the hypothesis of intensity-independent growth (Fig. 8). As intensities increased above 7, mean total parasite volumes were observed almost exclusively below the regression lines calculated from intensities ⩽7. Mean total parasite volume in female hosts fed ad libitum appeared to reach an asymptote of about 0·3–0·4 mm3 parasite per female host (Fig. 8A) and about 0·2–0·4 mm3 parasite per male host (Fig. 8B). The rate of increase of mean total parasite volume at intensities >7 was clearly diminishing in the remaining host groups (Fig. 8C–F), but there were insufficient hosts or too much variability at the larger infections to determine whether asymptotes had yet been reached.
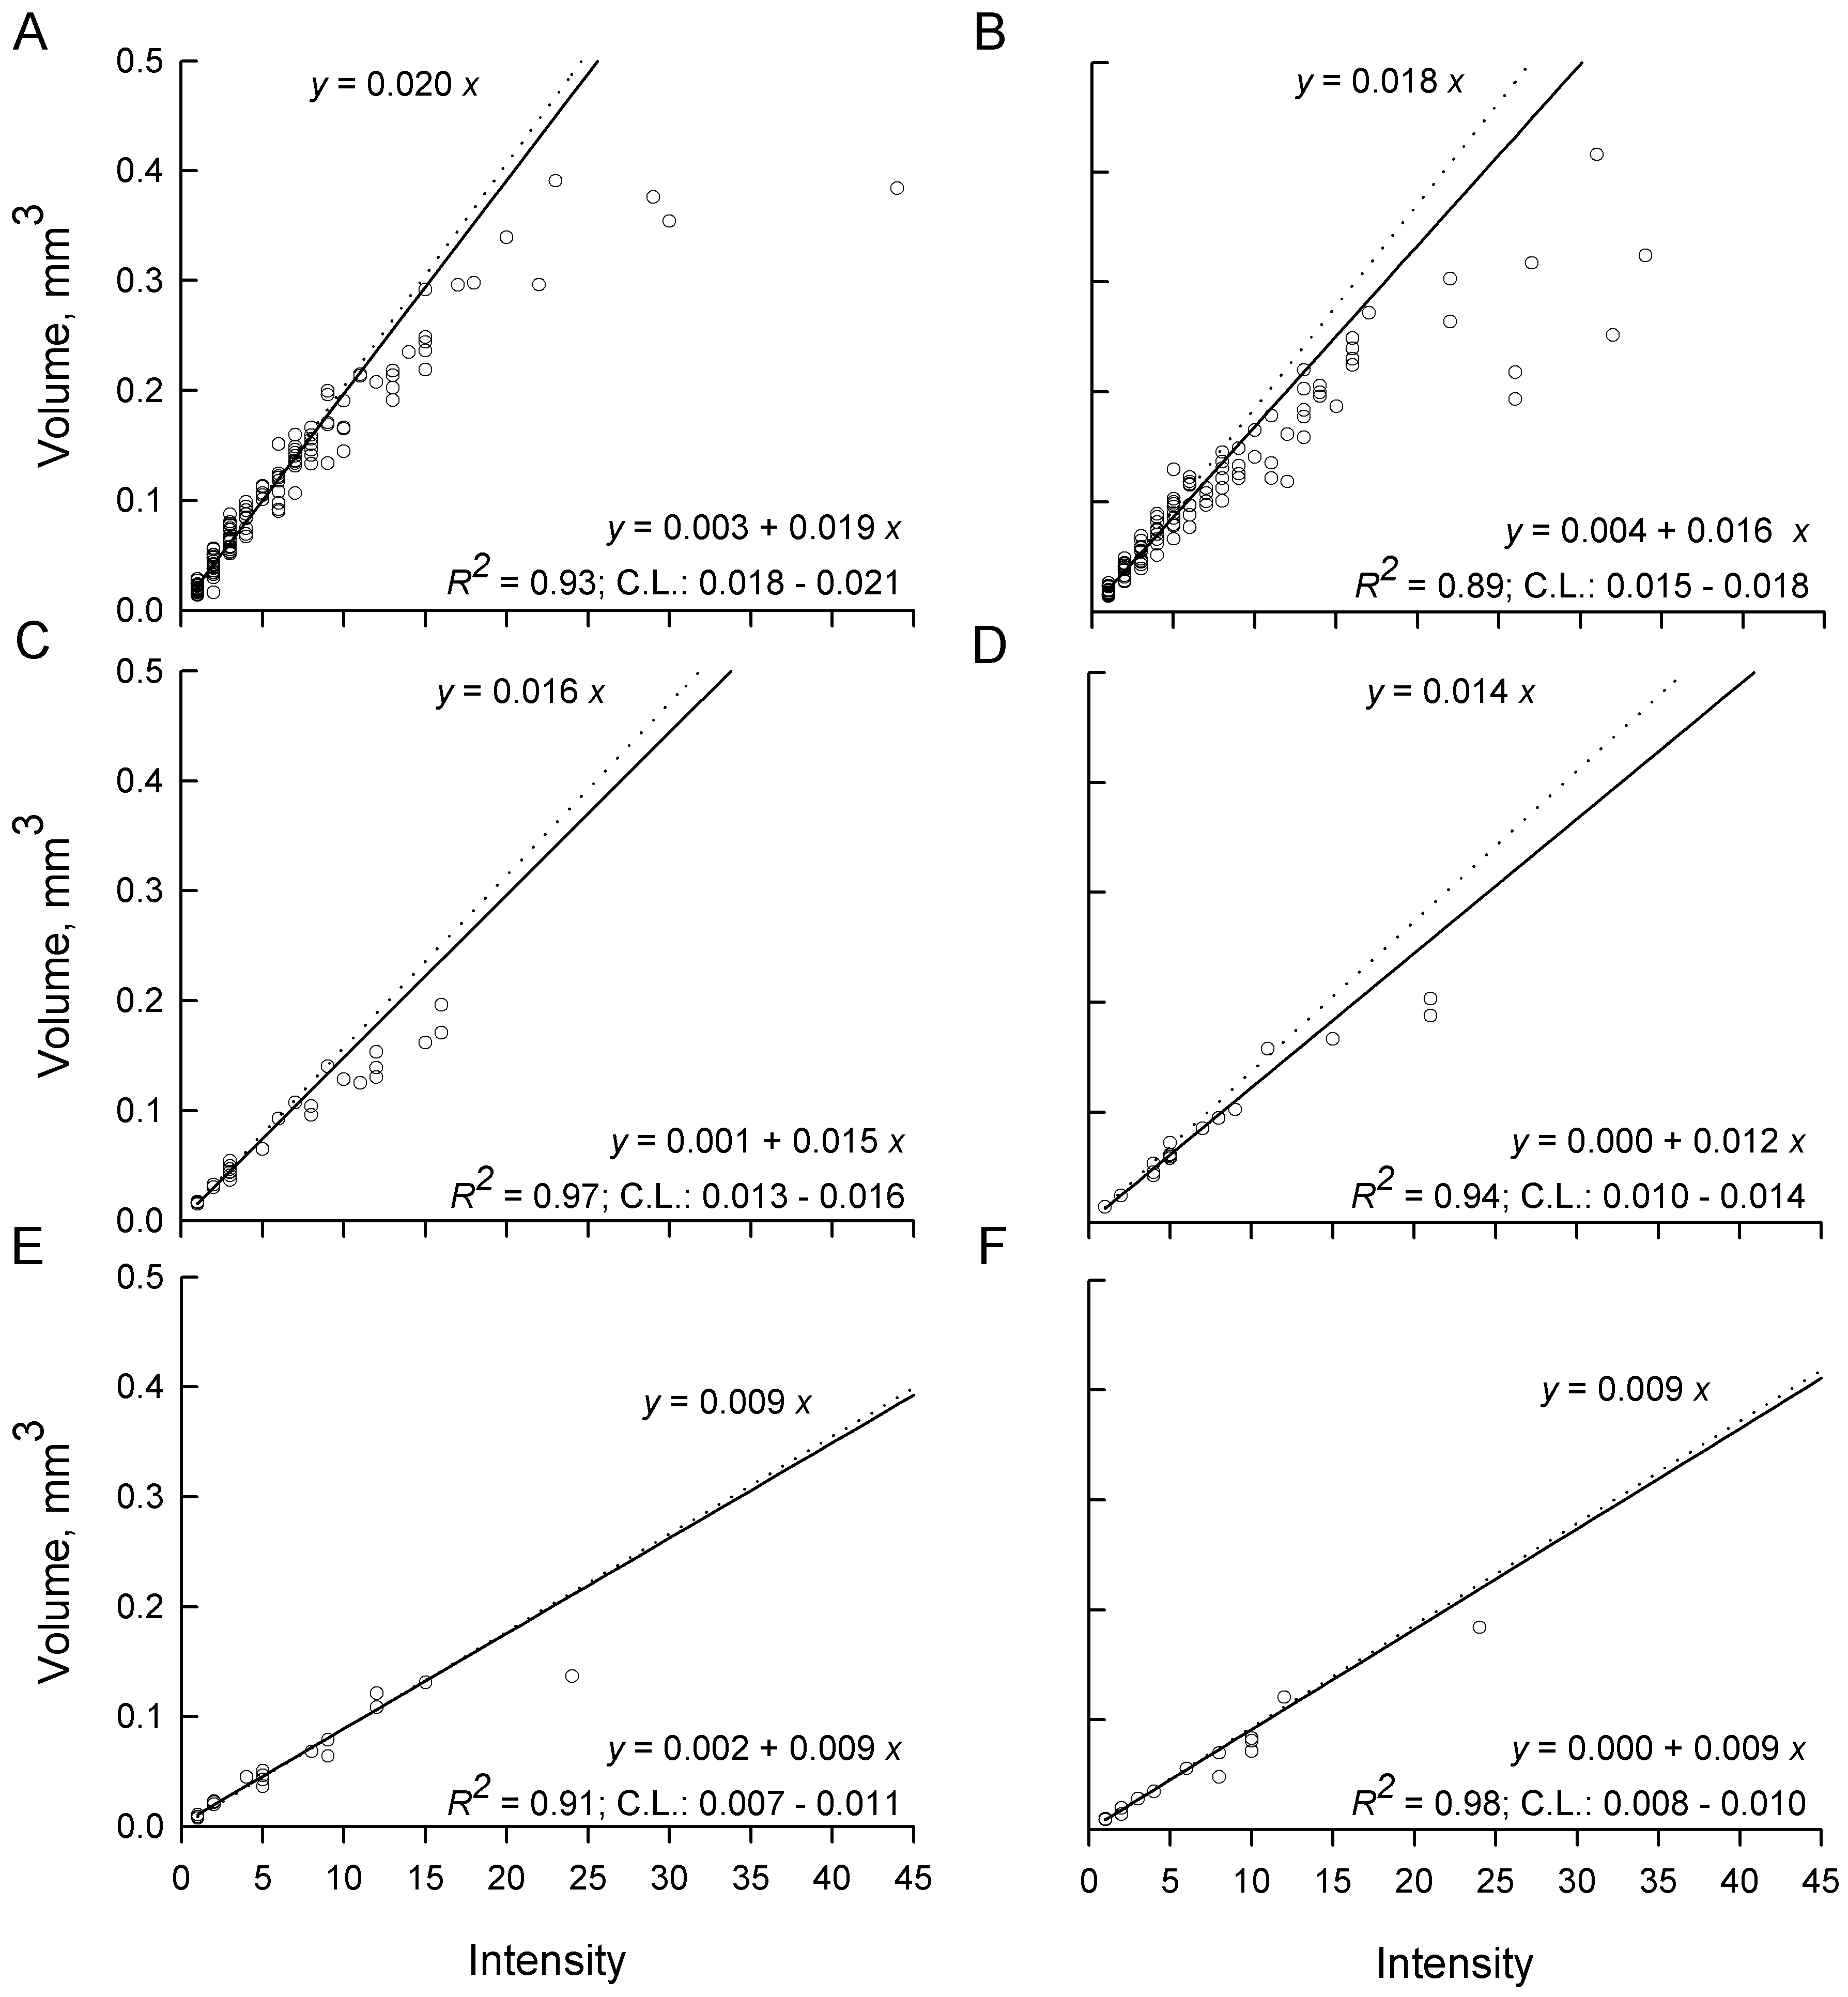
Fig. 8. Total parasite volume per host for Hymenolepis diminuta recovered from Tribolium confusum receiving a single exposure to parasite eggs and then maintained on different diets for at least 2 weeks. (A) Female and (B) male beetles fed ad libitum after infection. (C) Female and (D) male beetles fed partially after infection. (E) Female and (F) male beetles fasted after infection. Each open circle represents one host. Dotted lines and upper equations represent predicted total volumes if all parasites grow to the same volume as at intensity (x)=1. Solid lines and lower equations are log-linear fits to data from intensity ⩽7 parasites per host. c.l are confidence limits for the slope after back-transformation.
Prediction of total parasite volume from partial measurements
We tested the ability of partial measurements on stage 5 parasites to predict their individual total volume (TV). We used 857 parasites for which complete measurements were available, and pooled data across host sexes, intensities and diets to maximize potential sources of variation. Based on R 2, the best predictor of total volume was the product of BL (body length) and BW (body width): log TV=−0·31+1·555 log [BL×BW], R 2=0·96. Second best was BL alone: log TV=−0·684+2·923 log BL, R 2=0·82. Poorest was TL (total length including cercomer) alone: log TV=−1·83+1·254 log TL, R 2=0·63.
DISCUSSION
This study examined parasite growth in conditions that ranged from optimal to marginal for the hosts and indeed, hosts fed ad libitum had high survival throughout the study whereas those that were fasted exhibited such high mortality that few even survived long enough to span the normal developmental period of the parasite. Given the range in host condition, as well as variation in host sex, age, reproductive status, number of exposures, and resulting intensity of infection, it was somewhat surprising that parasite establishment and development were relatively invariant. Similar numbers of parasites established and all completed development on a similar time-course, with passage through developmental stages varying at most by about 1 day and with all parasites eventually reaching the cysticercoid stage. By contrast, parasite growth exhibited great plasticity, with cysticercoids ranging over 10-fold in size from large-bodied individuals with a long cercomer to those that were little more than a scolex surrounded by a thin capsule. Variation in parasite size could not be attributed to host age (confirming results of Shostak, Reference Shostak2008) or reproductive status. Host sex effects were inconsistent. Female T. confusum are about 15% larger by weight than males (Mankau, Reference Mankau1977) and when there were significant sex effects they indicated slightly larger parasites in females, but in many cases parasite size was similar between sexes. By contrast, size of T. molitor is similar between sexes (Shea, Reference Shea2005) but the cysticercoid body is larger in male hosts (Hurd and Arme, Reference Hurd and Arme1987).
Most variation in parasite size was due to infection intensity and host diet. We confirm previous reports of a crowding effect on H. diminuta in T. confusum (Voge and Heyneman, Reference Voge and Heyneman1957; Dunkley and Mettrick, Reference Dunkley and Mettrick1971; Keymer, Reference Keymer1980), but the increased resolution in this study (afforded by accurate parasite volume estimates, large sample size, and observations throughout the developmental period of the parasite, as well as the novel results from manipulation of host diet and multiple infections) permits more accurate description of density-dependent parasite growth and also testing of hypotheses of causation. Some of our observations also revealed unexpected features of the crowding effect in this system.
In contrast to a simple inverse relationship between parasite size and intensity expected on theoretical grounds (Michaud et al. Reference Michaud, Milinski, Parker and Chubb2006), and which was evident in pooled data on H. diminuta presented in a prior study (Keymer, Reference Keymer1980), we demonstrated that the relationship is more complex, with mean volume per parasite constant over a range of low intensities, then declining in an approximately inverse manner at higher intensities. The simple inverse relationship portrayed by Keymer (Reference Keymer1980) is probably an artefact of using the number of exposures to estimate intensity, and total length including cercomer to measure parasite size. Data at low intensities would be biased towards hosts with fewer infections, hence younger cysticercoids were more likely to possess a full cercomer (Shostak et al. Reference Shostak, Walsh and Wong2006) and measured much longer in total length, although not necessarily much larger in volume.
Exploitation competition for limited resources (Bush and Lotz, Reference Bush and Lotz2000) has been the prevailing hypothesis to explain most instances of the crowding effect. The observation that the intensity at which we could detect density-dependent reduction in size decreased over time as parasites grew and developed, argues against the hypothesis that density dependence in this system is due solely to the number of parasites present without regard to other properties such as their size, and supports the notion that some resource necessary for parasite growth has become limiting. It has been argued for H. diminuta in T. confusum, by some, that competition is probably more for space (Keymer, Reference Keymer1980), and by others that nutrients are more likely limiting (Gordon and Whitfield, Reference Gordon and Whitfield1985). Results of the present study support the view that nutrients are most likely the proximate limiting resource driving the crowding effect in this system.
The hypothesis of nutrient limitation is supported by 4 sets of data. First are the repeated observations that, all else being equal, hosts fed less food produced smaller parasites. This requires only the assumptions that (i) space within the haemocoele of adult T. confusum is relatively constant, or perhaps even greater in hosts on reduced food intake due to depletion of fat bodies, or smaller numbers of developing eggs in females (variation among females is known (Hurd and Arme, Reference Hurd and Arme1986)), and (ii) hosts with greater food intake will have relatively greater concentrations of potential parasite nutrients circulating in their haemocoele. Second, 1-week-old parasites in partially-fed or fasted hosts had slightly delayed development. Observations on 1-week-old parasites were made at a time when their absolute size was small (and space constraints presumably negligible) but their daily absolute volume gain was the highest, suggesting nutrient limitation if it is assumed that production of more parasite tissue requires a greater nutrient intake. Third, the first evidence of crowding was observed on day 9 p.e., 2 days after the estimated peak of parasite energy demand from the host, but at a time when parasites would still grow larger (again indicating that space was not likely limiting). Fourth, reduced food availability for the host not only changes parasite shape (Shostak et al. Reference Shostak, Walsh and Wong2006), but there was a corresponding pattern of size change in cysticercoid structures that suggests differential allocation of growth during nutrient limitations to more critical regions such as the scolex.
While nutrients are probably the major limiting factor, the acquisition of nutrients by the parasite does not appear to be a simple case of sharing from a common pool in direct proportion to the number of parasites, which would produce the kind of strict inverse relationship between intensity and parasite size described by Michaud et al. (Reference Michaud, Milinski, Parker and Chubb2006) and modelled by Shostak and Scott (Reference Shostak and Scott1993). This model has produced a good fit for sizes of procercoids of the cestode Triaenophorus crassus in the crustacean intermediate host (Shostak and Scott, Reference Shostak and Scott1993) but fails to adequately describe sizes of adult H. diminuta, where size per parasite declines with increasing intensity more quickly that expected under an hypothesis of simple sharing. Our application of the Shostak and Scott (Reference Shostak and Scott1993) model to both developing and developed cysticercoids produced a similar poor fit at intermediate intensities. Cysticercoids of H. diminuta take up carbohydrates, amino acids and fatty acids from the host (Arme et al. Reference Arme, Middleton and Scott1973; Jeffs and Arme, Reference Jeffs and Arme1984; Rosen and Uglem, Reference Rosen and Uglem1988). Whole body extracts of infected T. confusum have increased glycogen, and reduced glucose, lactate and trehalose levels compared to controls (Novak et al. Reference Novak, Modha and Blackburn1993). Studies on nutrient pathways in infected hosts have used the much larger T. molitor. These have shown that cysticercoids do not utilize trehalose, the most abundant sugar in the haemolymph (Pappas and Morrison, Reference Pappas and Morrison1995) and infected T. molitor may actually have increased levels of trehalose, various amino acids and vitellogenin in the haemolymph but no change in glucose concentrations (Hurd and Arme, Reference Hurd and Arme1984a, Reference Hurd and Armeb; Kearns et al. Reference Kearns, Hurd and Pullin1994; Schoen et al. Reference Schoen, Modha, Maslow, Novak and Blackburn1996). Use of glucose by developing H. diminuta is probably a combination of direct utilization of products of digestion en route to the fat body and altered mobilization of existing host reserves (Kearns et al. Reference Kearns, Hurd and Pullin1994). Molecules of parasite origin alter many aspects of metabolism in T. molitor, either in a density-dependent but non-linear manner (Warr et al. Reference Warr, Eggleston and Hurd2004) or simply from the presence of any number of parasites (Major et al. Reference Major, Webb and Hurd1997; Hurd and Ardin, Reference Hurd and Ardin2003). Some of the effects are parasite stage-specific, even induced by developing cysticercoids, but the effects may persist long after (Webb and Hurd, Reference Webb and Hurd1999). These pathways were studied at intensities too small to result in a crowding effect on H. diminuta in T. molitor (Hurd and Arme, Reference Hurd and Arme1987), and in much younger hosts than those we used. However, if similar metabolic alterations occur in the smaller T. confusum they may alter the pool of available nutrients temporally or in relation to parasite numbers such that parasite size does not decline in a strictly inverse manner. An early alteration of host metabolism in T. confusum may provide additional nutrients to the parasites during their peak growth phase and explain why a crowding effect was not evident until several days later.
Somewhat paradoxically, we found that even in the severe conditions within fasted hosts, a lone cysticercoid would be severely stunted but fasted hosts could also harbour up to 10–15 parasites that reached the same size as that single parasite. But if the nutrients capable of supporting even limited growth of 10–15 parasites were present, why could a parasite present alone not access them and grow larger? Why was a crowding effect not observed, even in starved host, until many parasites were present? Parasite size may depart from a strict inverse relationship with presumed levels of host resources if parasites adjust resource demands and grow larger than expected with increased crowding, a so-called Life History Strategy (LHS) hypothesis (Michaud et al. Reference Michaud, Milinski, Parker and Chubb2006). Our data seem consistent with this hypothesis, but we can only speculate on possible mechanisms. First, while the parasite develops in the haemocoele and is bathed in circulating haemolymph, the parasite may deplete nutrients in its immediate vicinity while not lowering nutrient levels elsewhere, at least in the short term, thus allowing limited growth by other parasites. Second, the parasite may be capable of either altering its absorptive capability, or the mobilization of nutrients from the host (as discussed previously), in its immediate vicinity. Third, the limited ability of H. diminuta to delay its development, and the relatively brief period of peak nutrient demand on the host as individual parasites approach stage 4 development, may allow a staggering of resource demands by the parasite on the host that may allow for some additional growth beyond what might occur if parasite growth and development was absolutely synchronous. Fourth, it may be that hosts which acquire more parasites are simply of different quality (Michaud et al. Reference Michaud, Milinski, Parker and Chubb2006) than hosts which acquire few parasites.
Perhaps the most intriguing observation in the present study was that the change in shape of parasites from hosts on a reduced diet (Shostak et al. Reference Shostak, Walsh and Wong2006) corresponded to a substantial difference in absolute size of different structures of the cysticercoid. It is reported qualitatively that the cercomer is reduced but scolex unaffected by crowded conditions (Voge and Heyneman, Reference Voge and Heyneman1957). Reduction in host diet from ad libitum to partial feeding resulted in a large reduction in cercomer volume, a small reduction in body volume and little effect on scolex width. Reduction from partial feeding to fasting resulted in a further decrease in volume of the already small cercomer, but now also a large decrease in body volume, which had only been reduced slightly in partially-fed hosts. Unlike Voge and Heyneman (Reference Heyneman and Voge1957), we found a reduction in scolex size although it was minor. This strongly suggests that the developing parasite under the abundant nutrient conditions in a host fed ad libitum can grow to normal proportions, but that there is a progressive allocation of resources to presumably more critical parts of the cysticercoid when nutrients become limiting. Resource allocation to reproduction, survival or growth may be one of the most important but least understood aspects in the chain of events from initial acquisition of resources by individuals, to the life-history strategy they express (Boggs, Reference Boggs1992). If growth of H. diminuta occurs according to predictions of the LHS hypothesis (Michaud et al. Reference Michaud, Milinski, Parker and Chubb2006), the altered pattern of resource allocation may be the mechanism responsible. However, fitness benefits arising from this allocation are not readily apparent. Our results suggest that the cercomer is least critical, formation of a robust capsule surrounding the scolex more important, and formation of a large scolex the most important. The loss of the cercomer of H. diminuta while still in the beetle (Shostak et al. Reference Shostak, Walsh and Wong2006) and the frequent absence or vestigial nature of the cercomer in many other cestodes (Chervy, Reference Chervy2002) suggests its size is of little consequence to parasite fitness. The cercomer stores glycogen (Heyneman and Voge, Reference Heyneman and Voge1957; Moczon, Reference Moczon1977) but there is no RNA synthesis in the cercomer (Prescott and Voge, Reference Prescott and Voge1959) or any mechanism known to utilize that glycogen (Moczon, Reference Moczon1977). The importance of a large capsule or scolex has not been demonstrated. Establishment of cysticercoids of H. diminuta in rats is almost 100%, even when cysticercoids originate from crowded infections or starved hosts (Evans and Novak, Reference Evans and Novak1976; Keymer, Reference Keymer1981) and those trials presumably included individuals with small body and scolex size. Carry-over effects of larval size reduction from crowding in the intermediate host to the adult stage (a growth effect) are known in other helminths (Fredensborg and Poulin, Reference Fredensborg and Poulin2005), but effects of alteration of scolex size of H. diminuta in the beetle on subsequent adult size or fecundity in the rat host have not been studied.
The crowding effect is one of the most ubiquitous phenomena in parasitology, to the extent that its existence is often accepted without proper quantification. We have taken one of the earliest examples of the crowding effect, the Hymenolepis–Tribolium relationship, and provided the most comprehensive quantitative analysis to date. In confirming the crowding effect we have refined understanding of the form of the density-dependent relationship. Moreover, the new approaches to studying the host–parasite relationship which were used in this study suggest that the crowding effect involves far more complex host–parasite interactions than are usually assumed to be operating.