INTRODUCTION
An individual host is rarely exploited by a single parasite species. In most cases, a host harbours an assemblage of heterospecific parasites which is commonly defined as an infracommunity of parasites. Heterospecific parasites in an infracommunity may or may not interact with each other. Depending on the presence or absence of interspecific interactions, both isolationist and interactive parasite communities are distinguished (Holmes and Price, Reference Holmes, Price, Kikkawa and Anderson1986; Bush et al. Reference Bush, Lafferty, Lotz and Shostak1997). In particular, a parasite community is considered as interactive if parasite species in this community exert selective pressures on each other, which then induce the selection of traits that limit competition by separating niches (Holmes and Price, Reference Holmes, Price, Kikkawa and Anderson1986; Combes, Reference Combes2001). Parasites that share a host but exploit different resources are not expected to interact (Poulin, Reference Poulin2007), although indirect interactions mediated via a host are possible (Krasnov et al. Reference Krasnov, Mouillot, Khokhlova, Shenbrot and Poulin2005). Consequently, it is commonly accepted that interactivity is expected in the communities of parasite species belonging to the same guild, e.g. sharing the same trophic level (Poulin, Reference Poulin2007).
One of the indications of competitive interactions among parasite species of the same guild is segregation of their sites of infection in or on the body of a host. However, this segregation can arise not only due to present competition but can also be a ‘ghost of competition past’ (Connel, Reference Connel1980) or may result merely from different preferences of different species or else may be a result of intra-host speciation (Šimkova et al. 2006). Whatever the exact mechanism of spatial segregation of species in an infracommunity is, it can only be inferred or experimentally tested after establishment of whether the segregation exists.
Spatial segregation of co-occurring parasites has often been documented for endo- and ectoparasites of fish and bird hosts (Bush and Holmes, Reference Bush and Holmes1986a, Reference Bush and Holmesb; Stock and Holmes, Reference Stock and Holmes1988; Choe and Kim, Reference Choe and Kim1989; Kuris, Reference Kuris, Esch, Bush and Aho1990; Geets et al. Reference Geets, Coene and Ollevier1997; Friggens and Brown, Reference Friggens and Brown2005; Bush and Malenke, Reference Bush and Malenke2008; Mestre et al. Reference Mestre, Mesquita-Joanes, Proctor and Monrós2011; Munroe et al. Reference Munroe, Avery, Shutler and Dadswell2011) as well as endoparasites of mammalian hosts (Patrick, Reference Patrick1991; Haukisalmi and Henttonen, Reference Haukisalmi and Henttonen1990). Spatial segregation of ectoparasites on a body of a mammalian host was studied less. In addition, many studies of spatial distribution of ectoparasites on bodies of these hosts represent a mere narrative and lack statistical analysis (Dubinina and Dubinin, Reference Dubinina and Dubinin1951; Ross, Reference Ross1961; Prasad, Reference Prasad1972; Shepherd and Edmonds, Reference Shepherd and Edmonds1979; Nilsson, Reference Nilsson1981; Ma, Reference Ma1983, Reference Ma1989).
To fill this gap and to establish whether arthropod ectoparasites are segregated across body parts of the same host individual, we studied the distribution of ectoparasites on bodies of 5 species of rodent hosts from marshlands of the northeast Buenos Aires province, Argentina. We considered ectoparasites belonging to 5 higher taxa, namely ixodid ticks (Acari: Ixodidae), mesostigmate mites (Acari: Mesostigmata), chigger mites (Acari: Trombiculidae), fleas (Insecta: Siphonaptera) and lice (Insecta: Anoplura). The aims of this study were 3-fold. First, we asked whether an ectoparasite species prefers certain part(s) of the body of its host and, if yes, whether these preferences overlap among ectoparasites species. To answer this question and to account for an excessive number of zeros in the raw data, ectoparasite counts on different body parts of a host individual were estimated using zero-inflated mixture models (Zuur et al. Reference Zuur, Ieno, Walker, Saveliev and Smith2009). Second, we asked whether ectoparasite species composition differs among different parts of a host's body. To examine this, similarity of ectoparasite assemblages among different body parts of a host was analysed. Third, we asked whether co-occurrences of ectoparasite species within body parts of a host are non-random and, if yes, whether ectoparasites co-occur in the same body part of a host either less or more often than expected by chance. For this, null model analyses (Gotelli and Graves, Reference Gotelli and Graves1996; Gotelli, Reference Gotelli2000) were applied and frequencies of co-occurrences of ectoparasite species across body parts of the same host individual were compared with those expected by chance, i.e., derived from randomly assembled species × body parts matrices.
MATERIALS AND METHODS
Sampling of mammals and ectoparasites
Rodents were sampled and ectoparasites were collected at 5 localities along the banks of the La Plata river in Buenos Aires province, Argentina in 1995–1996. This area is part of the biogeographical province La Pampa (Morrone, Reference Morrone2001), which constitutes the southern border of the South American subtropical humid forests. Detailed descriptions of the study sites can be found elsewhere (e.g., Beldoménico et al. Reference Beldoménico, Lareschi, Nava, Mangold and Guglielmone2005; Lareschi et al. Reference Lareschi, Notarnicola, Nava and Navone2007; Lareschi and Krasnov, Reference Lareschi and Krasnov2010). Rodents were captured using wire mesh live-traps (7·5 cm × 15 cm × 8 cm) arranged in grids of either 10 by 10 (10 m apart) or 8 by 10 (3 m apart). In total, 253 rodents belonging to 5 common species were captured, namely Akodon azarae (n = 24), Oligoryzomys flavescens (n = 26), Oligoryzomys nigripes (n = 9), Oxymycterus rufus (n = 61) and Scapteromys aquaticus (n = 133). Seventeen ectoparasite species were collected from these animals, including 7 mesostigmate mites [Androlaelaps fahrenholzi (n = 164), Androlaelaps rotundus (n = 96), Gigantolaelaps wolffsohni (n = 44), Laelaps manguinhosi (n = 2158), Laelaps paulistanensis (n = 60), Mysolaelaps microspinosus (n = 61), and Ornithonyssus bacoti (n = 170)], 1 ixodid tick [Ixodes loricatus (n = 26)], 1 chigger mite [Eutrombicula alfreddugesi (n = 3518)], 5 fleas [Polygenis atopus (n = 53), Polygenis axius (n = 9), Polygenis bohlsi (n = 1), Polygenis massoiai (n = 16), and Polygenis frustrates (n = 4)] and 3 lice [Hoplopleura aitkeni (n = 75), Hoplopleura scapteromydis (n = 485), and Hoplopleura travassosi (n = 2537)].
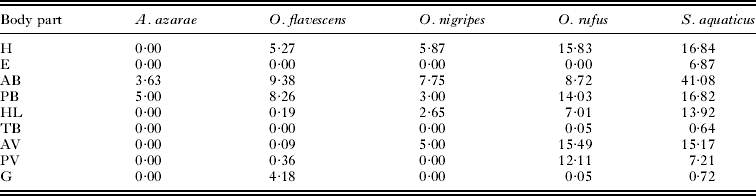
Upon capture, a rodent was transferred to a laboratory where it was anaesthetized by sulphur ether and tightly wrapped in a white cloth so that ectoparasites could not relocate from their original places of attachment or occurrence. Then, the rodent was euthanized and frozen at −20 °C. Use of sulphur ether for an anaesthetic and euthanasia of animals matched national ethical standards at the time of sampling. Later, we thawed out each rodent and systematically examined its hair under a stereoscopic microscope. We divided a host body into 10 parts following Nilsson (Reference Nilsson1981) and Lareschi and Liljesthrom (Reference Lareschi and Liljesthrom2000), namely, head (H), ears (E), anterior part of back with neck and front legs (AB), posterior part of back excluding base of the tail (PB), hind legs (HL), base of the tail (ca. 3 mm strip; TB), tail (T), anterior part of ventral region (AV), posterior part of ventral region (PV) and groin (G) (see figure in Nilsson, Reference Nilsson1981 and Lareschi and Liljesthrom, Reference Lareschi and Liljesthrom2000 for details). Parasites found in each body part were counted, placed in individual vials with 96% ethanol and then identified using conventional techniques (see details in Lareschi and Krasnov, Reference Lareschi and Krasnov2010). Counts of a tick included larvae and nymphs, of mesostigmate mites included nymphs and adults, of lice included eggs (with embryos), nymphs and adults, of a chigger mite included only larvae, and of fleas included only adults.
Parasite count estimates and identification of preferred sites
Parasite count data usually contain excessive counts of zero (Wilson et al. 2002; Denwood et al. Reference Denwood, Stear, Matthews, Reid, Toft and Innocent2008; Munroe et al. Reference Munroe, Avery, Shutler and Dadswell2011). To account for the large number of zeros, we modelled numbers of parasites on different body parts of each host species using zero-inflated Poisson (ZIP) or zero-inflated negative binomial (ZINB) mixture models. Detailed discussion of the logic, mathematics and methodology of ZIP and ZINB models can be found in Martin et al. (Reference Martin, Wintle, Rhodes, Kuhnert, Field, Low-Choy, Tyre and Possingham2005), Zeileis et al. (Reference Zeileis, Kleiber and Jackman2008) and Zuur et al. (Reference Zuur, Ieno, Walker, Saveliev and Smith2009). In brief, there are 2 sources of zeros in ecological data. ‘False zeros’ are generated by, for example, observer errors or temporal absence of a species (e.g., an ectoparasite) during a survey, while it may occur at other times. If a species (e.g., an ectoparasite) is available but does not occur in a given habitat (e.g., a given host species, a given individual or a given body part) because this habitat is unsuitable for this species, then the zero count is a ‘true zero’. The term ‘mixture model’ reflects the fact that the zeros are modelled as resulting from 2 different processes, namely the binomial process and the count process (Zuur et al. Reference Zuur, Ieno, Walker, Saveliev and Smith2009). The probability of obtaining a ‘false zero’ is modelled by the binomial component, while the count component uses a Poisson or negative binomial distribution and models the processes that affect counts as well as ‘true zeros’. Mixture models identify factors that may affect the probability of obtaining a false zero (e.g., observer errors may vary among host's body parts). Alternatively, all zero counts may have the same probability of being false zeros (Zeileis et al. Reference Zeileis, Kleiber and Jackman2008).
Separate datasets for each ectoparasite species on each host species were generated in which at least 5 individuals were infested with the ectoparasite. This resulted in 24 host-parasite associations being taken into mixture model analyses. These associations included 14 ectoparasite species each exploiting 1–3 host species. In other words, a dataset represented counts of a particular ectoparasite across body parts of a particular host species with body parts where no parasite was recorded being excluded (see Munroe et al. Reference Munroe, Avery, Shutler and Dadswell2011). Initially, 4 models were run for each dataset. Models M1 and M2 considered variation among host body parts as a possible source of ‘false zeros’, while models M3 and M4 assumed that all false zeros have the same probability. Each model implemented either a negative binomial (models M1 and M3) or Poisson (models M2 and M4) distribution for the count component. The best model was selected using the Akaike Information Criterion and used for further model runs (see below). To generate mixture models, we used package pscl (Zeileis et al. Reference Zeileis, Kleiber and Jackman2008; Jackman, Reference Jackman2011), implemented in the R environment (R Development Core Team, 2011).
Due to the categorical nature of our explanatory variable (body part), we used dummy variables in our models. The significance of the estimated coefficients for each dummy variable is tested against a reference level which is chosen arbitrarily among the levels of the explanatory variable (i.e., among body parts), while the significance of the estimated coefficient of the reference level (intercept of the model) is tested against 0 (Zuur et al. Reference Zuur, Ieno and Smith2007). We were interested in absolute values of estimated counts rather than in their values relative to the reference level. Consequently, the selected model was run several times, sequentially selecting each body part as the reference level for each run (Zuur et al. Reference Zuur, Ieno and Smith2007). Counts of a parasite on a particular body part of a host were made using the estimated coefficient of the intercept from the model in which this body part was used as the reference level (if this coefficient differed significantly from 0). For each host species, a body part with the highest estimated count of a parasite was assumed to be the preferred site for this parasite because the largest proportion of parasite individuals resided there. To pinpoint body parts of a host species that were preferred by all parasites, the significant estimated counts per body part were summed across parasites within a host and these values were used as observed values for the χ 2 tests. Using these tests, we examined whether the observed counts deviated from an expected uniform distribution of counts, calculated as the sum of observed values divided by the number of body parts where counts did not sum to zero. A significant result would mean that the distribution of counts is non-random and that certain body parts are preferred over others by all (or, at least, the majority of) parasites.
Analyses of similarity
The analysis of similarity tests whether the difference in species composition between 2 or more groups of sampling units is significant (Clarke, Reference Clarke1993). Essentially, this is a permutation procedure applied to a matrix of similarities between the sampling units (that is, ectoparasite assemblage on a particular body part of a particular host individual). This method uses the rank order of similarity values and calculates the difference of mean ranks among and within groups (that is, body parts across host individuals) (=the test statistic R). The null hypothesis is that there are no differences in ectoparasite species composition among body parts. When R is approximately zero, the null hypothesis is true, but when R equals 1, all within-body part replicates are more similar to each other than to any replicates from different body parts. We used the Sørensen similarity index (Sørensen, 1948) as a measure of similarity in ectoparasite species composition among body parts across host individuals (=replicates). The reason behind selection of the qualitative index (that is, not taking into account parasite abundances) is that ectoparasites belonging to different higher taxa differ substantially in their characteristic abundance, so that counts of these ectoparasites (e.g., a louse versus a tick) are incomparable. Statistical significance of R was estimated by permutation procedure with 999 permutations. The calculations were performed by the ANOSIM routine implemented in the program Primer-6 (Clarke and Gorley, Reference Clarke and Gorley2006) separately for each of 5 host species.
The null model analyses
The null model analyses were carried out separately for mesostigmate mites and fleas as well for higher taxa (by pooling data on all parasites belonging to the same higher taxon). These analyses were not done for the remaining taxa because ticks and chiggers were represented each by single species, while 3 louse species were highly host specific, so each louse was found on 1 host species only. The null model analyses were done only for those host individuals on whom at least 2 parasites belonging to different species or higher taxa were found. The data for each rodent individual (that is, an infracommunity of ectoparasites) were organized as a presence/absence matrix in which rows represented ectoparasite species or higher taxa and columns represented body parts. The null model analyses were applied as implemented in the software EcoSim Professional (Entsminger, Reference Entsminger2012). We used the C-score (the average number of checkerboard units that are found for each pair of species; Stone and Roberts, 1990), one of the most commonly used metrics of community structure (Gotelli and McCabe, Reference Gotelli and McCabe2002; Gotelli and Rohde, Reference Gotelli and Rohde2002; Krasnov et al. Reference Krasnov, Stanko and Morand2006; Tello et al. Reference Tello, Stevens and Dick2008), as a metric of co-occurrence of ectoparasite species in each infracommunity (i.e., a parasites × host body parts matrix). An observed C-score was calculated for each presence/absence matrix and compared with the C-scores calculated for 5000 randomly assembled null matrices measuring the tail probability that the observed index was larger or smaller than expected by chance. To assemble simulated matrices, a fixed-equiprobable algorithm was used. In this algorithm, species occurrences are randomized but the row sum (i.e., incidences of species) is preserved (=fixed) and the column sum (i.e., number of species per body part) is unconstrained (=equiprobable). A C-score larger than expected by chance [observed (O) > expected (E)] indicates negative co-occurrences (i.e., species are segregated), while a C-score smaller than expected by chance (O < E) indicates positive co-occurrences (i.e., species are aggregated) (Gotelli, Reference Gotelli2000).
To examine the general trend in ectoparasite co-occurrences on the same body part of a host, we first counted how many times the observed C-score was smaller (not necessarily significantly) than expected by chance for ectoparasites (mites, fleas or higher taxa) within host species. These counts were used to evaluate the combined rate of detection of the observed C-score being smaller than expected by chance using meta-analyses. Then the standardized effect size (SES) was calculated for each infracommunity matrix. SES measures the number of standard deviations that the observed index is above or below the mean index of simulated matrices (Gotelli and McCabe, Reference Gotelli and McCabe2002) and is calculated as the difference between the observed index and mean of simulated indices divided by the standard deviation of simulated indices. To test the null hypothesis that the average SES across a set of infracommunities (within and across host species) was zero, one-sample t-tests were used. Then meta-analyses of the average SES within and across host species were carried out. In all meta-analyses, random effects models were used because we assumed variation across host body parts in various characters (such as hair density, skin structure etc). Meta-analyses were performed using Comprehensive Meta-Analysis 2.2 (Biostat Inc., Englewood, NJ, USA).
RESULTS
A summary of the mixture modelling is presented in Table 1 (but see Suppl. Table 1, online version only, for detailed results). In total, parasite counts were estimated in 24 parasite-host associations. The probability that body parts represent a factor generating false zeros was significant in E. alfreddugesi infesting S. aquaticus only (Suppl. Table 1, online version only). In 4 associations (A. fahrenholzi infesting A. azarae, L. manguinhosi and P. atopus infesting O. flavescens and M. microspinosus infesting O. nigripes), no estimated coefficient differed significantly from zero (Suppl. Table 1, online version only). Across the remaining 20 parasite-host associations, the posterior part of the back (PB), the head (H) and the hind legs (HL) were infested most often (estimated coefficients significantly greater than zero in 13, 11 and 10 host-parasite associations, respectively; Table 1 and Supplementary Table 1, online version only).
Significant estimated coefficients were found in 8 associations for anterior parts of the back (AB), posterior and anterior parts of the ventral region (PV and AV, respectively) and the groin (G), while significant estimated coefficients for the base of the tail (TB) and ears (E) were found in 5 and 4 associations, respectively. In no parasite and no host did the estimated coefficient for the tail (T) differ significantly from zero. Within each of the 20 associations, estimated coefficients differed significantly from zero for 1–8 body parts (Table 1). Summed estimated counts across parasites within host species are presented in Table 2. Preferred sites of infection overlapped both within ectoparasites among hosts and within hosts among ectoparasites (Table 1). The distribution of parasite loads across host body parts differed significantly from random in O. flavescens (χ 2 = 14, d.f. = 6, P=0·03), O. rufus (χ 2 = 23·2, d.f. = 7, P = 0·002) and S. aquaticus (χ 2 = 41·7, d.f. = 8, P < 0·0001, but not in A. azarae (χ 2 = 0·023, d.f. = 1, P = 0·88) and O. nigripes (χ 2 = 1·86, d.f. = 4, P = 0·76).
Table 1. Body parts with parasite counts significantly different from zero in 20 host-parasite associations

Table 2. Sum of model-estimated counts within host and across parasite species using estimated coefficients significantly different from zero
Analyses of similarity revealed no significant differences in ectoparasite species composition among body parts in all hosts (P > 0·05 for all). The values of the test statistic R were generally low and ranged from a minimum of 0·05 in O. rufus to a maximum of 0·20 in O. nigripes.
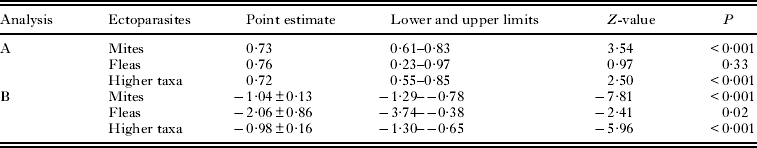
The C-score of the observed presence/absence matrices differed significantly from those of simulated matrices in only 11 of 65 infracommunities for mites, none for 9 infracommunities of fleas and 25 of 138 infracommunities for higher taxa (Table 3). In all these infracommunities, the observed C-score was lower than expected by chance. Furthermore, in 3 of 5 hosts and across all hosts, the number of infracommunities with the observed C-score being smaller (albeit non-significantly) than expected by chance was substantially higher than the number of infracommunities with the observed C-score being larger than expected by chance (Table 3). The event rate of the detection of the observed C-score being smaller than expected by chance was significantly higher than 50% for mites and higher taxa, but not for fleas (Table 4; see illustrative example for higher taxa in Fig. 1a). Meta-analytic SES values for mites, fleas and higher taxa were negative and differed significantly from zero (Table 4; see illustrative example for higher taxa in Fig. 1b).

Fig. 1. (a) Forest plot for meta-analyses of the rate of detection of the observed C-score for ectoparasite co-occurrences on the same body part of a host being smaller than the C-score expected by chance across 5 host species. The size of squares is proportional to sample size (number of host individuals). The middle vertical line is where the number of infracommunities with ectoparasites tending to be aggregated in certain body parts of a host (O < E) would be equal to the number of infracommunities with ectoparasites tending to be segregated across body parts of a host (O > E). Cl, confidence limits (horizontal lines). Diamond, combined rate of detection of the observed C-score being smaller than expected by chance. (b) Forest plot for meta-analyses of mean SES for the C-score of ectoparasite co-occurrences on the same body parts of a host across 5 host species. The size of squares is proportional to the sample size (number of analysed communities). Diamond, meta-analytical value of SES.
Table 3. Summary of null model analyses of ectoparasite co-occurrences in the same body parts of a host

Table 4. Summary of meta-analyses of the rate of detection of the observed C-score for ectoparasite co-occurrences on the same body part of a host being smaller than the C-score expected by chance (A) and the SES values of the C-score for ectoparasite co-occurrences on the same body part of a host (B)

DISCUSSION
Results of this study demonstrated that, in general, ectoparasite species in infracommunities were not segregated spatially. Although the majority of ectoparasites clearly preferred certain host body parts, these preferences were similar among ectoparasites and/or higher taxa and resulted in similarity among host body parts in species composition of ectoparasites. Moreover, ectoparasite species demonstrated a tendency to co-occur on the same body parts of a host.
A variety of factors can be responsible for within-host distribution of parasites. First, a preference of some body parts over other parts is associated with the extraction of a resource (e.g., blood or other body fluid). This will lead to the concentration of conspecifics on/in a particular part of the host body (Murray et al. Reference Murray, Smith and Soucek1965; Rust, Reference Rust1974; Roubal and Quartararo, Reference Roubal and Quartararo1992). This may also facilitate encounters with mating partners, although this may be important for some (e.g., lice), but not for other parasite species (e.g., immature ticks). Second, intra- and interspecific competition for a resource or for its acquisition may affect parasite distribution and lead to (a) occurrence of parasites on/in both preferred and non-preferred host body parts or (b) segregation of parasites across host body parts, respectively. Third, host behavioural defences (that is, grooming and preening in the case of ectoparasites) may force parasites to select those body parts of a host that are less accessible by the host's paws, teeth or beak (Nelson and Murray, Reference Nelson and Murray1971; Reiczigel and Rozsa, Reference Reiczigel and Rozsa1998). Below, we will discuss these factors with regards to arthropod ectoparasites of terrestrial hosts, although some examples of non-arthropod parasites and aquatic hosts will also be used.
Within-host distribution and resource extraction
Selection of a host body part for resource extraction by an ectoparasite is determined by both anatomy of its feeding and/or locomotory apparatus and variation in morphological and physiological properties among host body parts. Indeed, host body parts often differ in thickness of integument, skin folding, hair or feather density, blood capillary depth, etc. (e.g., Sokolov, Reference Sokolov1982 for mammals). Morphology of feeding apparati differs among ectoparasite higher taxa as well as among closely-related ectoparasite species. For example, the length of the proboscis and the armament of lacinia (number of teeth) vary among flea species (Vashchenok, Reference Vashchenok1988; Krasnov, Reference Krasnov2008). Consequently, foraging decision by an ectoparasite with, for instance, short mouthparts should result in selection of body parts with relatively thin integument and/or blood capillaries close to the body surface, while an ectoparasite with relatively long mouthparts may also select body parts with thicker integument and/or deeper capillaries (Mullens and Gerhardt, Reference Mullens and Gerhardt1979). In haematophagous but not skin-piercing parasites, foraging decisions can be based on other considerations. For example, many mesostigmate mite species do not possess special cheliceral adaptations for host skin penetration and feed mainly from pre-existing wounds (Furman, Reference Furman1959; Radovsky, Reference Radovsky and Kim1985). Predisposition to parasite-unrelated wounding obviously varies among body parts of a host, so that these mites would select body parts most prone to wounding. Hair density may affect locomotion of an ectoparasite, so distribution of some ectoparasites (e.g., fleas) on a host body was found to be correlated negatively with hair density (Vansulin and Volkova, Reference Vansulin and Volkova1962; Ma, Reference Ma1983).
Temperature and humidity variation among host body parts may affect foraging decisions of an ectoparasite because these factors may influence not only parasites themselves but also blood flow of a host and, thus, facilitate or impair ectoparasite feeding. For example, the louse Lepidophthirus macrorhini, which is parasitic on elephant seals, lives mainly on the hind flippers where temperature is higher than in other body parts, independent of whether a host is at sea or ashore (Murray and Nicholls, Reference Murray and Nicholls1965). Marshall (Reference Marshall1981) observed that a flea, Archaeopsylla erinacei, preferred the humid ventral part over the dryer dorsal part of a hedgehog host. The pattern of temperature variation among host body parts varies with variation in ambient (that is, air or water) temperature, so that the pattern of ectoparasite distribution on a host body has also been shown to be affected by ambient temperature (Mead-Briggs et al. Reference Mead-Briggs, Vaughan and Rennison1975; Ma, Reference Ma1983).
Nevertheless, different ectoparasites demonstrate overlap in their preferences to host body parts. As a result, co-occurring ectoparasites of different species are often found on the same body parts of a host (Dubinin and Dubinina, Reference Dubinina and Dubinin1951; Linsdale and Davis, Reference Linsdale and Davis1956; Nilsson, Reference Nilsson1981; Wallach et al. Reference Wallach, Shanas, Mumcuoglu and Inbar2008). Our results demonstrated that this was, indeed, the case for rodents and their arthropod parasites in our dataset.
Within-host distribution and intraspecific competition
Kelly and Thompson (Reference Kelly and Thompson2000) suggested that an individual ectoparasite can improve its feeding success by choosing a host that supports a small number of conspecific competitors, all else being equal. The available evidence suggests that this is unlikely to be the case in application to within-host distribution. Indeed, results of this and other studies (Munroe et al. Reference Munroe, Avery, Shutler and Dadswell2011) demonstrated that distribution of conspecific ectoparasites across host body parts appeared to be aggregative. In other words, individual conspecific ectoparasites were mainly found on or in the same body part of a host. Nevertheless, when the number of individual ectoparasites increases, some of them may re-locate from the preferred site (e.g., Kadulski and Dobryńszuk, Reference Kadulski, Dobryńszuk, Pielowski and Pucek1976). This might be related to a decrease in feeding success under a high density of co-habitating conspecifics. However, Krasnov et al. (Reference Krasnov, Hovhanyan, Khokhlova and Degen2007) demonstrated that a density-dependence effect on ectoparasite feeding is not always the case because it was found in some, but not other host-parasite associations.
Within-host distribution and interspecific competition
The most likely effect of interspecific competition among ectoparasites on within-host distribution would be segregation of different ectoparasite species across host body parts. Such a segregation has, indeed, been reported for ixodid ticks (Chilton et al. Reference Chilton, Bull and Andrews1992), feather mites (Mestre et al. Reference Mestre, Mesquita-Joanes, Proctor and Monrós2011), fleas (Prasad, Reference Prasad1972; Shepherd and Edmonds, Reference Shepherd and Edmonds1979), chewing lice (Nelson and Murray, Reference Nelson and Murray1971; Reed et al. Reference Reed, Hafner, Allen and Smith2000), and batflies (ter Hofstede et al. Reference ter Hofstede, Fenton and Whitaker2004). However, interspecific competition as the underlying mechanism of spatial segregation was experimentally proven in a few studies only (e.g., Choe and Kim, Reference Choe and Kim1989), while distinct preferences (Mestre et al. Reference Mestre, Mesquita-Joanes, Proctor and Monrós2011) or the effect of the original host (Shepherd and Edmonds, Reference Shepherd and Edmonds1979) seemed to be better explanations in other studies. The main argument against occurrence of competition for resources among parasite species is that these resources are not limited (Rohde, Reference Rohde1979, Reference Rohde1991). Our results support this argument indirectly because we did not find any evidence on segregative structure of an ectoparasite infracommunity but rather found a trend of different ectoparasites to co-occur in the same parts of the host body.
Within-host distribution and competition with a host
In higher vertebrates (birds and mammals), anti-parasitic behaviour (preening or grooming) represents one of the first lines of defence against ectoparasites (see Combes, Reference Combes2001; Krasnov, Reference Krasnov2008). Obviously, this behaviour represents an immediate danger for ectoparasites. It is not surprising, therefore, that host anti-parasitic behaviour is commonly accepted to be the most important factor restricting within-host distribution of ectoparasites to specific parts on its body (for example, see reviews in Marshall, Reference Marshall1981 for lice and Krasnov, Reference Krasnov2008 for fleas). In fact, host grooming or preening might be an equally effective tool to remove all ectoparasites independent of whether they are haematophagous, saprophagous or phoretic. Ectoparasites, in turn, are forced to develop some means to withstand host preening/grooming and to avoid dislodging by a host. For example, fleas possess ctenidia, settae and helmets to anchor themselves in the host's hair (e.g., Traub, Reference Traub1972), while chewing lice attach to a host's hair using head grooves located on their rostra (e.g., Morand et al. Reference Morand, Hafner, Page and Reed2000; Reed et al. Reference Reed, Hafner, Allen and Smith2000). However, the simplest way to avoid host grooming or preening is to reside on those body parts of a host which are the least prone to host grooming because of morphological constraints.
Host defence effort and efficiency have been shown to be body part-specific (Nikitina and Nikolaeva, Reference Nikitina and Nikolaeva1981; Rozsa, Reference Rozsa1993). Assuming (a) body part-specific defensive abilities of a host and (b) body part-specific evasive abilities of parasites, Reiczigel and Rozsa (Reference Reiczigel and Rozsa1998) used an individual-based model for the coevolution of 1 host and 2 parasite species and demonstrated that, at least in some host-parasite associations, within-host segregation of parasites might be a result of interplay between these two trade-offs. For hosts and parasites in our study, the first assumption was likely true, while we did not find any evidence for the second assumption. Instead, our results suggested that the majority of ectoparasite species on the same host used the same evasive strategy (that is, selected the least groomed body parts) and thus their spatial distribution within a host tended to be aggregated. In conclusion, the distribution of ectoparasites across a host body is most probably driven mainly by their interaction with a host rather than by distinct preferences or interactions among ectoparasite species.
ACKNOWLEDGEMENTS
We thank U.F.J. Pardiñas (Centro Nacional Patagónico, Puerto Madryn, Argentina) and C. Galliari (CEPAVE) for identification of rodents. Allan Degen read an earlier version of the manuscript and made helpful comments. We thank two anonymous referees for helpful comments. The study was supported by grants PICT2010-338, 11N618 and PIP0146 from Agencia Nacional de Promoción Científica y Tecnológica, Universidad Nacional de La Plata and Consejo Nacional de Investigaciones Científicas y Técnicas (Argentina) to M.L. who is a member of CONICET (National Research and Technological Council, Argentina). The sampling protocol used in this study is in accordance with regulations and policies of the Dirección de Administración y Difusión Conservacionista del Ministerio de Asuntos Agrarios, Buenos Aires, Argentina. This is publication no. 771 of the Mitrani Department of Desert Ecology.