


Introduction
Tsetse flies (Glossina sp.) transmit Trypanosoma vivax, Trypanosoma b. brucei and Trypanosoma congolense biologically, which involves development in the vector. Trypanosoma vivax develops in the vector's mouthparts (Rotureau and Van Den Abbeele, Reference Rotureau and Van Den Abbeele2013), whereas T. brucei and T. congolense develops in fly's midgut. These developmental stages involve proliferation and adaptation of the parasite for infection and survival in the mammalian host (Caljon et al., Reference Caljon, Vooght and Van Den Abbele2014; Ooi et al., Reference Ooi2016). The tsetse-borne trypanosomes follow distinct developmental pathways within the fly which minimizes competition among the parasites and maximizes their transmission (Rotureau and Van Den Abbeele, Reference Rotureau and Van Den Abbeele2013). Trypanosomes are also transmitted mechanically by biting flies including horseflies (Tabanus spp.), Hippobosca camelina, stable flies (Stomoxys spp.) and tsetse flies (Desquesnes and Dia, Reference Desquesnes and Dia2003, Reference Desquesnes and Dia2004; Duffy et al., Reference Duffy, Morrison, Black, Pinchbeck, Christley, Schoenefeld, Tait, Turner and MacLeod2009). No development occurs during mechanical transmission (Wells, Reference Wells1972). Trypanosoma evansi is thought to have evolved from T. brucei by completely losing kinetoplast maxicircles which are involved in morphological development and multiplication within tsetse flies. These trypanosomes are thus independent of tsetse transmission (Moreno and Nava, Reference Moreno and Nava2015).
Trypanosoma b. brucei and T. congolense have been isolated in tsetse-free areas of Northern Kenya from as far back as the 1980s (Gibson et al., Reference Gibson, Wilson and Moloo1983; Njiru et al., Reference Njiru2006; Getahun et al., Reference Getahun2020). Although they can be transmitted mechanically by non-tsetse biting flies, these parasites cannot be actively maintained in tsetse-free areas for long periods (Wells, Reference Wells1972). However, isolation of the parasites from tsetse-free parts of Northern Kenya is evidence that these species are actively maintained in these areas (Gibson et al., Reference Gibson, Wilson and Moloo1983; Getahun et al., Reference Getahun2020). An explanation for this may be the possibility of biological transmission by an unidentified non-tsetse vector (Gibson et al., Reference Gibson, Wilson and Moloo1983). Nonetheless, the genetic connectivity between these trypanosomes from tsetse-infested and tsetse-free areas is not well understood. East African T. vivax strains are distinct from West African strains and genetically heterogeneous (Rodrigues et al., Reference Rodrigues2008, Reference Rodrigues2017; Adams et al., Reference Adams, Hamilton, Rodrigues, Malele, Delespaux, Teixeira and Gibson2010; Garcia et al., Reference Garcia, Rodrigues, Rodrigues, Bengaly, Minervino, Riet-Correa, Machado, Paiva, Batista, Neves, Hamilton and Teixeira2014). To show that the high degree of heterogeneity among African isolates is related to biological transmission, there is need for comparative analysis of T. vivax isolates from tsetse-free and tsetse-infested areas. Sequence analysis of rDNA T. vivax genes from tsetse-free and tsetse-infested areas of Ethiopia could not explain whether the isolates are genetically distinct implying that more sensitive technologies such as microsatellite genotyping are needed (Fikru et al., Reference Fikru, Matetovici, Rogé, Merga, Goddeeris, Büscher and Van Reet2016).
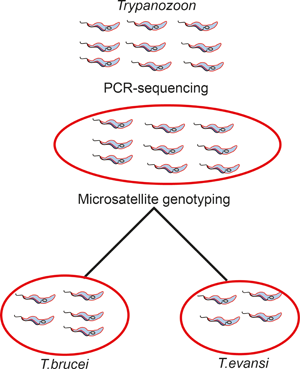
Thus, we compared Northern Kenyan and Coastal Kenyan T. (Trypanozoon) isolates (while ignoring established nomenclature and treating the group as one), T. vivax and T. congolense isolates from tsetse-free and tsetse-endemic areas of Kenya, to explore their intraspecific population structure, genetic differentiation, diversity and gene flow rates. This is the first intra-species comparative population-genetic study on trypanosomes from tsetse-free and tsetse-endemic areas of Africa. Ribosomal DNA sequence analysis may fail to inform on interspecies genetic separation among a group of trypanosome isolates (Fikru et al., Reference Fikru, Hagos, Rogé, Reyna-Bello, Gonzatti, Merga, Goddeeris and Büscher2014; Getahun et al., Reference Getahun2020). Microsatellite analysis, which is a powerful tool for population-genetic studies (Senan et al., Reference Senan2014; Fikru et al., Reference Fikru, Matetovici, Rogé, Merga, Goddeeris, Büscher and Van Reet2016) has the potential for being used to study genetic separation of trypanosome spp. Therefore, we carried out microsatellite genotyping on T. (Trypanozoon), T. vivax and T. congolense isolates from tsetse-free and tsetse-endemic areas of Kenya, and explored their intraspecific population structure, genetic differentiation, diversity and gene flow rates (Fig. 1).
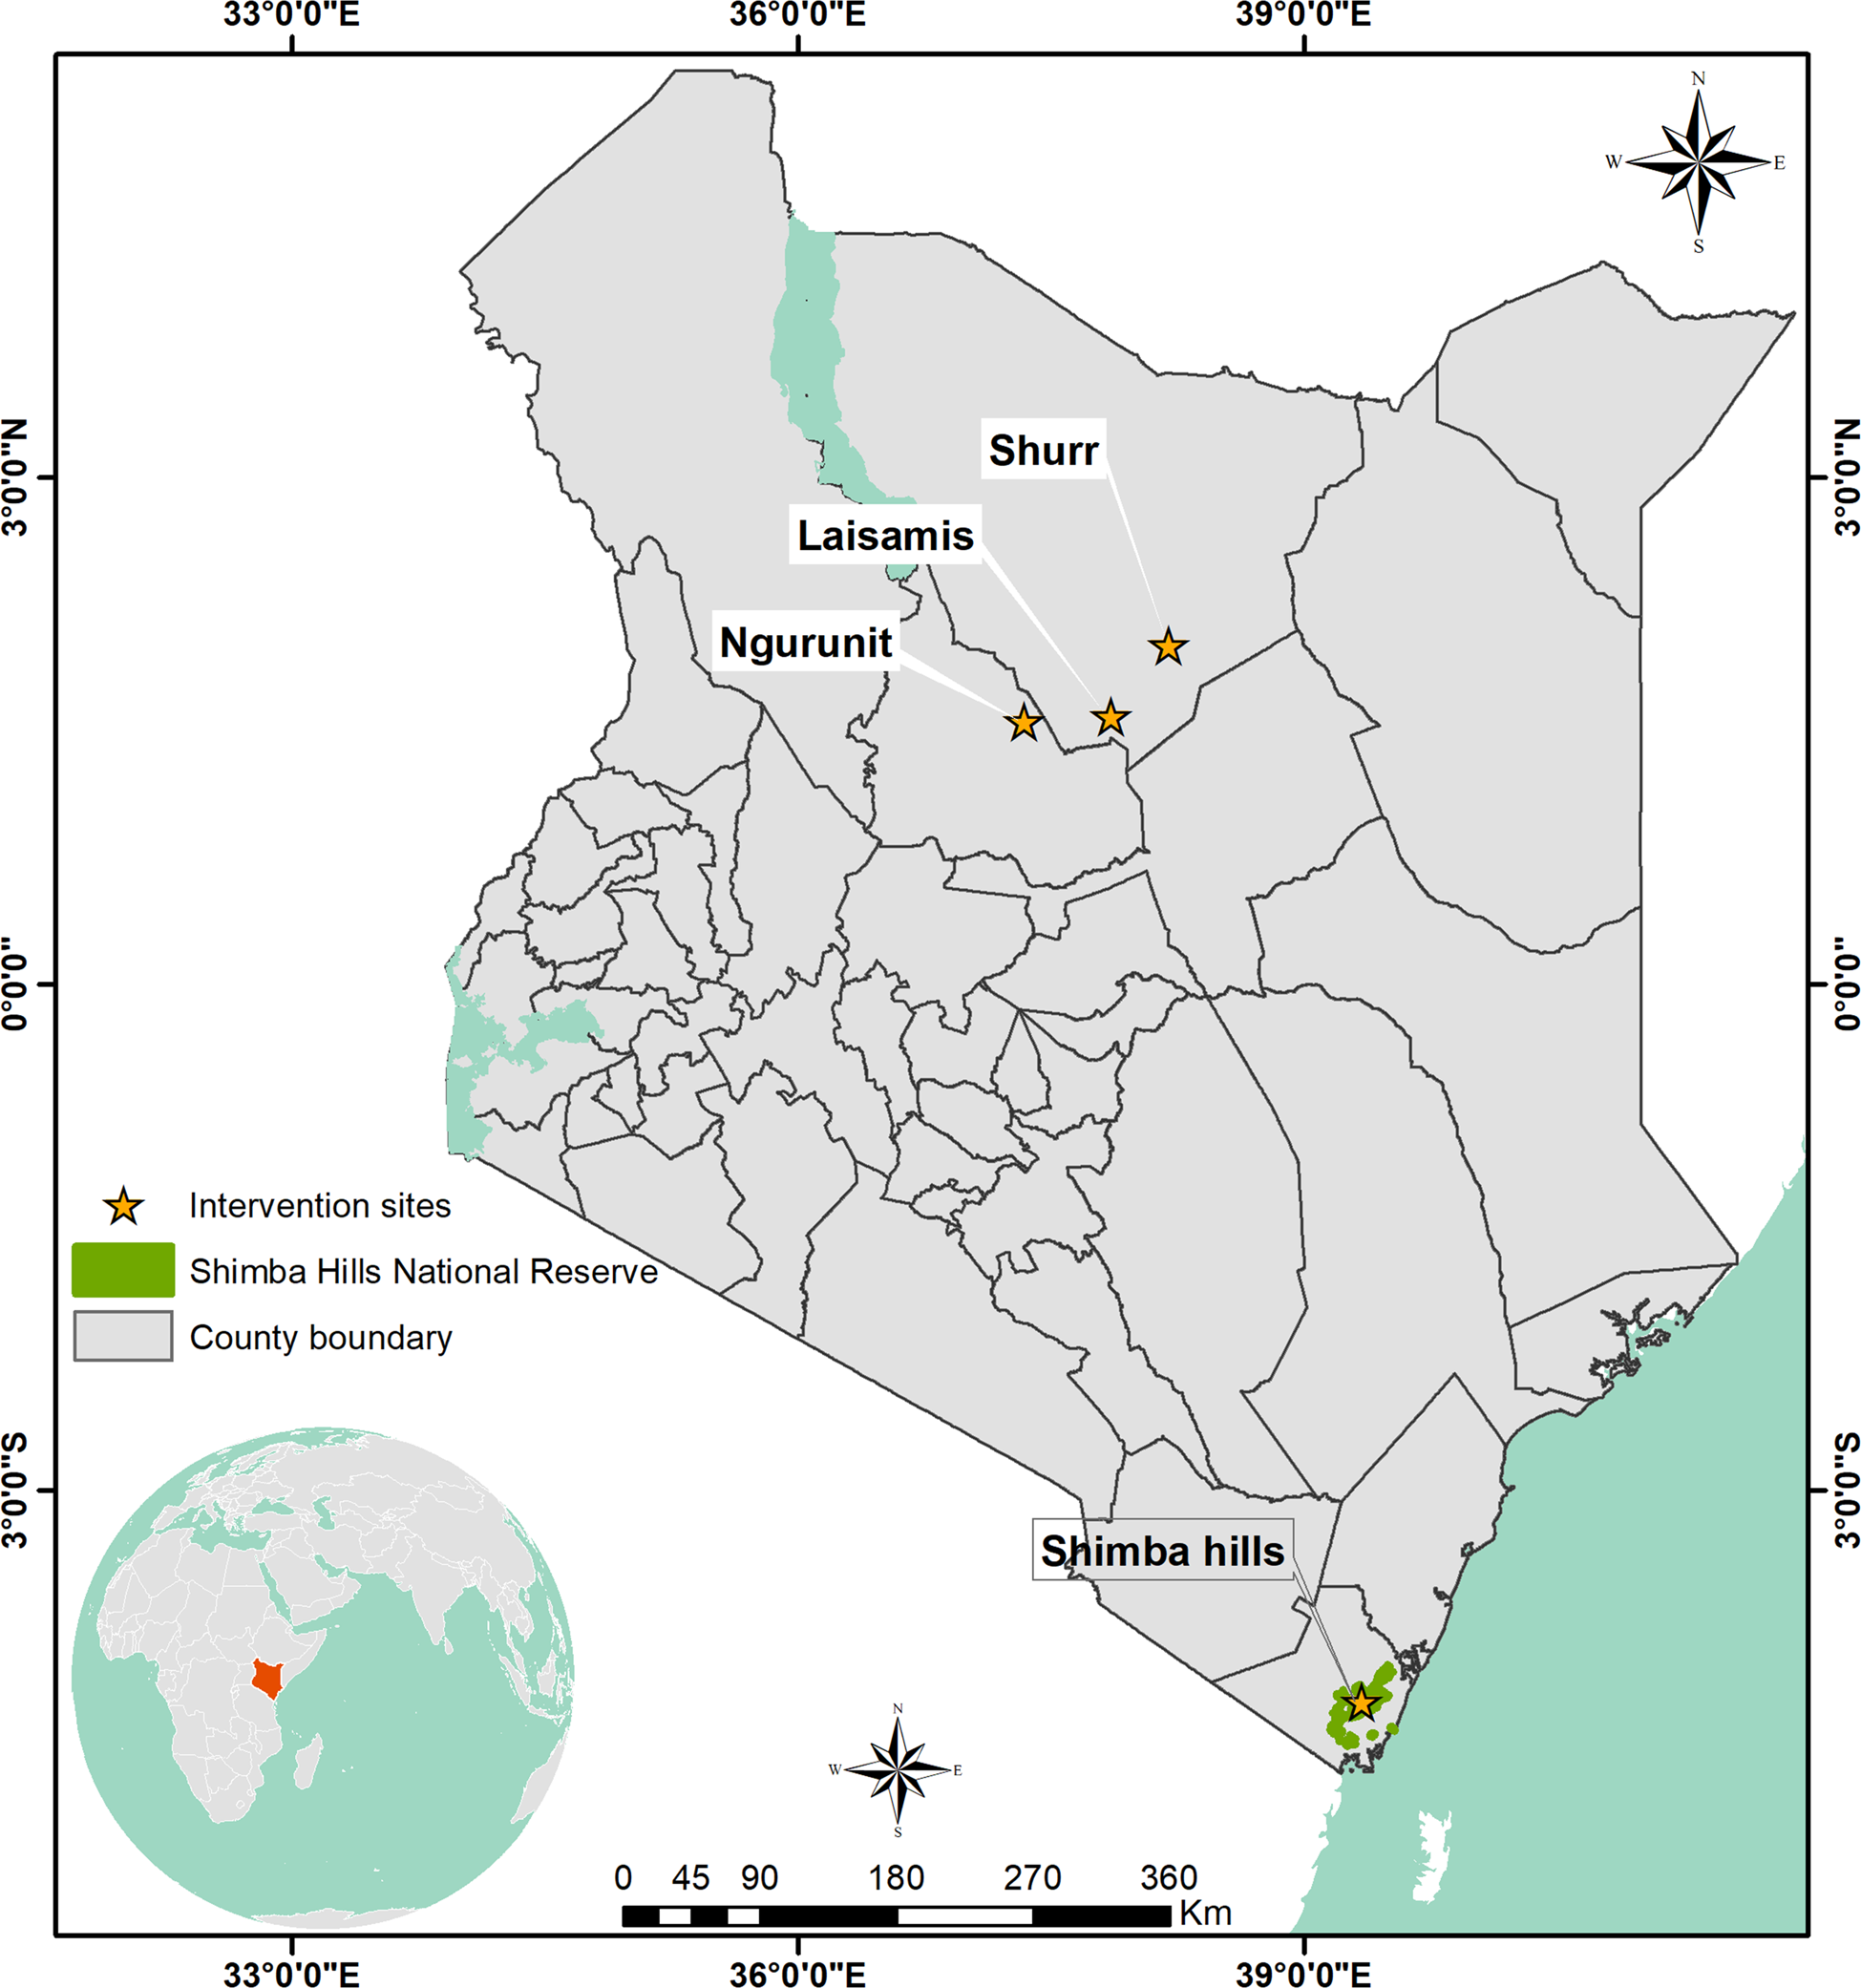
Fig. 1. Map of Kenya showing locations of trypanosome sampling sites: Shimba Hills (tsetse belt), Ngurunit, Lasisamis and Shurr (tsetse-free areas) from where samples used in the study were collected. Laisamis, Ngurunit and Shurr are all characterized by arid and semi-arid conditions whereas Shimba Hills area has wet climatic conditions.
Materials and methods
Study area
Trypanosome isolates used in this study were sampled from Shurr (N02°08′, E038°27′), Ngurunit (N01°74′, E037°29′) and Laisamis (N01°23′11″ E37°57′11.7″) all in Marsabit County, Northern Kenya and Shimba Hills (lat. −4.243 and long. 39.403) in Kwale County, Coastal Kenya (Fig. 1). The main livestock in Shurr, Ngurunit and Laisamis are camels, cattle, goats and sheep whereas in Shimba Hills there are only cattle, goats and sheep. These livestock are the hosts and reservoirs of the trypanosome species in these areas. Shimba Hills in Kwale County falls within the Coastal tsetse fly belt; therefore, tsetse flies are abundant in the area and they act as biological and in some cases mechanical vectors of trypanosome species. Ngurunit falls at the edge of a tsetse fly belt; however, no tsetse flies have been collected in the area in previous studies and is thus considered a tsetse-free area (Oyieke and Reid, Reference Oyieke and Reid2003; Getahun et al., Reference Getahun2020). Laisamis and Shurr are also tsetse-free areas and vectors of trypanosomes there are camel flies, tabanids and horseflies (Getahun et al., Reference Getahun2020).
Trypanosome isolates
We used trypanosome isolates from camel and cattle blood collected in Shurr, Laisamis and Ngurunit, Marsabit County of Northern Kenya and cattle blood and tsetse flies collected in Shimba Hills, Kwale County. The blood and tsetse fly samples were collected between 2018 and 2020 at different months and seasons. For samples collected in 2017, DNA was extracted in 2017 and stored at −20°C at the International Center for Insect Physiology and Ecology (icipe) laboratory.
DNA extraction and internal transcribed spacer (ITS) classification
Archived DNA samples were checked for the presence of isolates through ITS-1 region polymerase chain reaction (PCR) amplification (Njiru et al., Reference Njiru2005). Samples with no isolates detected were freshly extracted along the blood and tsetse fly samples with no DNA available. DNA extractions were carried out with the Qiagen DNeasy blood and tissue kit (Qiagen, Germany) following the manufacture's protocol. A diagnostic ITS-based PCR test was performed on all the samples. The test involved amplification of a 480 bp fragment for T. (Trypanozoon) isolates, a 700 bp fragment for T. congolense isolates and a 250 bp fragment for T. vivax isolates (Njiru et al., Reference Njiru2005). A 10-μL PCR reaction mixture was prepared with 1 μL of the template, 0.5 μL each of the forward and backward ITS1 primers (100 pmol), 5 μL Dreamtaq polymerase and 3 μL of nuclease-free water. The amplification reactions were carried out using the following PCR cycling profile: 95°C for 3 min for the initial denaturation step, 35 cycles of 95°C for 30 s, annealing at 61°C for 30 s, extension at 72°C for 1 min and final extension at 72°C for 10 min (Getahun et al., Reference Getahun2020).
Microsatellite genotyping
Fluorescently labelled forward primers (6-FAM, HEX and ROX) and reverse primers of previously described 14 microsatellite loci were used for microsatellite genotyping (Sistrom et al., Reference Sistrom2013; Kamidi et al., Reference Kamidi2017). The primer details of the microsatellite loci are provided in Table S1. Fourteen primer pairs were used to amplify microsatellite loci in T. (Trypanozoon), six were used to amplify microsatellite loci in T. vivax and only five amplified microsatellite loci in T. congolense. A 15-μL PCR reaction mixture was prepared with 1.5 μL of the template, 0.75 μL each of the forward and backward ITS1 primers (100 pmol), 3-μL blend Taq polymerase and 9 μL of nuclease-free water. The PCR conditions used were: initial denaturation at 95°C for 15 min, 35 amplification cycles of 95°C for 30 s, primer-specific annealing temperature for 30 s, elongation at 72°C for 30 s and final elongation at 72°C for 7 min. Genotyping by capillary electrophoresis was carried out with Applied Biosystems (Waltham, MA, USA) 3730 DNA Analyser and 500 LIZ as the size standard. Allele scoring was performed using Geneious Prime 2020.2.2 software (https://www.geneious.com) from where the fragment sizes were exported into an excel sheet and manually edited.
kDNA amplification
kDNA was amplified using kDNA-specific primers kDNA-12_JV: 5′-TTAATGCTATTAGATGGGTGTGG-3′; kDNA-13: 5′-CTCTCTGGTTCTCTGGGAAATCAA-3′ (Getahun et al., Reference Getahun2020). The PCR conditions used were: initial denaturation at 95°C for 15 min, 35 amplification cycles of 95°C for 50 s, primer-specific annealing temperature 55°C for 30 s, elongation at 72°C for 50 s and final elongation at 72°C for 7 min.
Population structure and differentiation
STRUCTURE v2.3.4 software (Pritchard et al., Reference Pritchard, Stephens and Donnelly2000) was used to infer the population's structures for T. (Trypanozoon), T. vivax and T. congolense isolates through the Bayesian clustering method. Ten independent runs each for K (genetic clusters) = 1–7 were performed with a burnin of 50 000 and 100 000 Markov Chain Monte Carlo (MCMC) reps for 1000 iterations. The optimal value of K was determined through the ad hoc statistic ‘ΔK’ (Evanno et al., Reference Evanno, Regnaut and Goudet2005) in Structure Harvester v0.6.94 (Earl and von Holdt, Reference Earl and von Holdt2012). STRUCTURE runs for T. (Trypanozoon) and T. congolense isolates were performed with independent allele frequencies and admixture models whereas runs for T. vivax isolates with performed with correlated allele frequencies and no admixture models (Porras-Hurtado et al., Reference Porras-Hurtado2013). The STRUCTURE membership coefficients (Q values) were used to assess the probability of assignment of each isolate to a specific cluster. Sub-populations within T. (Trypanozoon), T. congolense and T. vivax populations were also identified through multivariate analysis using principal component analysis (PCA), in R package Adegenet (Solymos et al., Reference Solymos, Cori and Calboli2020). Multivariate analysis was performed to complement Bayesian analysis and unlike the latter, it does not make assumptions on the Hardy–Weinberg equilibrium (HWE) or linkage disequilibrium as it is not model based (Jombart et al., Reference Jombart, Devillard and Balloux2010). The optimal number of clusters was determined through Bayesian information criterion (Jombart, Reference Jombart2008). In addition, Cavalli-Sforza genetic distances were then calculated and an unweighted pair group method with arithmetic mean (UPGMA) dendrogram based on Cavalli-Sforza similarity coefficient constructed in Populations v1.2.32 (http://bioinformatics.org/populations/) to determine intraspecific hierarchical structuring.
Pairwise F ST and their related P values for T. (Trypanozoon), T. vivax and T. congolense isolates were calculated to estimate the levels of population differentiation at two levels: among the STRUCTURE-inferred clusters and among the populations derived from sampling localities. Between and within population variance at the two levels was determined through analysis of molecular variance (AMOVA) in FSTAT v2.9.4 (Goudet, Reference Goudet2003). We tested for isolation by distance and isolation by environment by plotting among population-genetic distances ((1/FST − 1)/4) against between populations geographical (km) and environmental distance using a partial Mantel test (Mantel, Reference Mantel1967) calculated in R package vegan (Oksanen et al., Reference Oksanen2020).
Genetic diversity
Total number of different alleles and the effective number of alleles were determined in GenALEX v6.5 (Peakall and Smouse, Reference Peakall and Smouse2006). Allelic richness (A R) was calculated in the PopGenReport package in R (Adamack, Reference Adamack2014), observed heterozygosity (H O), expected heterozygosity (H e) and Fisher's inbreeding coefficient (F IS) were estimated in GenALEX v6.5 (Peakall and Smouse, Reference Peakall and Smouse2006). As a test to the non-random association of alleles within diploid individuals and at different loci, agreement with the HWE and linkage disequilibrium was estimated in R package Genepop (Rousset et al., Reference Rousset, Lopez and Belkhir2020).
Trypanosoma congolense alleles were rarefied for the smallest sample (Kalinowski, Reference Kalinowski2004) upon which allelic richness and private allelic richness were determined in HP-RARE (Kalinowski, Reference Kalinowski2005).
Gene flow analysis
Gene flow (N em) within the three trypanosome species was inferred indirectly from the allele frequency data based on Wright's equation F ST = 1/(4N em + 1) (N e is the effective population size and M is the migration rate) (Wright, Reference Wright1990; Whitlock and McCauley, Reference Whitlock and McCauley1999). BayesAss Edition 3.0 software was used to estimate the migration rate between populations of the three trypanosome species based on Bayesian inference (Wilson and Rannala, Reference Wilson and Rannala2003).
Results
PCR diagnostic tests and microsatellite genotyping
A total of 52 T. (Trypanozoon) isolates (30 from Northern Kenya and 22 from Shimba Hills, Coastal Kenya), 60 T. vivax isolates (30 from Northern Kenya and 30 from Coastal Kenya) and 32 T. congolense isolates (29 from Coastal Kenya and three from Northern Kenya) were isolated from camel, and cattle blood and tsetse fly samples. The results of the ITS1 assay are provided in Table S2. All trypanosome isolates were successfully genotyped and scored (Table S5).
Trypanosoma (Trypanozoon)
Population structure
Structure harvester results indicated the best K value as K = 2 for Bayesian clustering analysis with STRUCTURE v2.3.4 (Fig. 2A) thus indicating the presence of two distinct genetic clusters as the most likely hierarchical level of population structure. Cluster II (green) includes all Northern Kenyan isolates plus two Coastal Kenyan isolates. Cluster I (red) includes only Coastal Kenyan isolates. The next best fit of K = 3 revealed the level of sub-structuring within isolates from Coastal Kenya (Fig. 2B). Cluster ‘a’ (red) includes 31 T. (Trypanozoon) isolates, all but one being from Northern Kenya, whereas cluster ‘b’ (green) consists of four isolates all from the Coastal Kenyan region. Cluster ‘c’ (blue) is made up of 17 isolates, all from Coastal Kenya. Assignment of the isolates to these three clusters based on Q values is provided in Table S3. Of the 52 T. (Trypanozoon) isolates, six Coastal Kenyan isolates and one Northern Kenyan isolate showed uncertain assignment to either of the three clusters (Q < 0.8) and these were excluded from further STRUCTURE-based analysis.
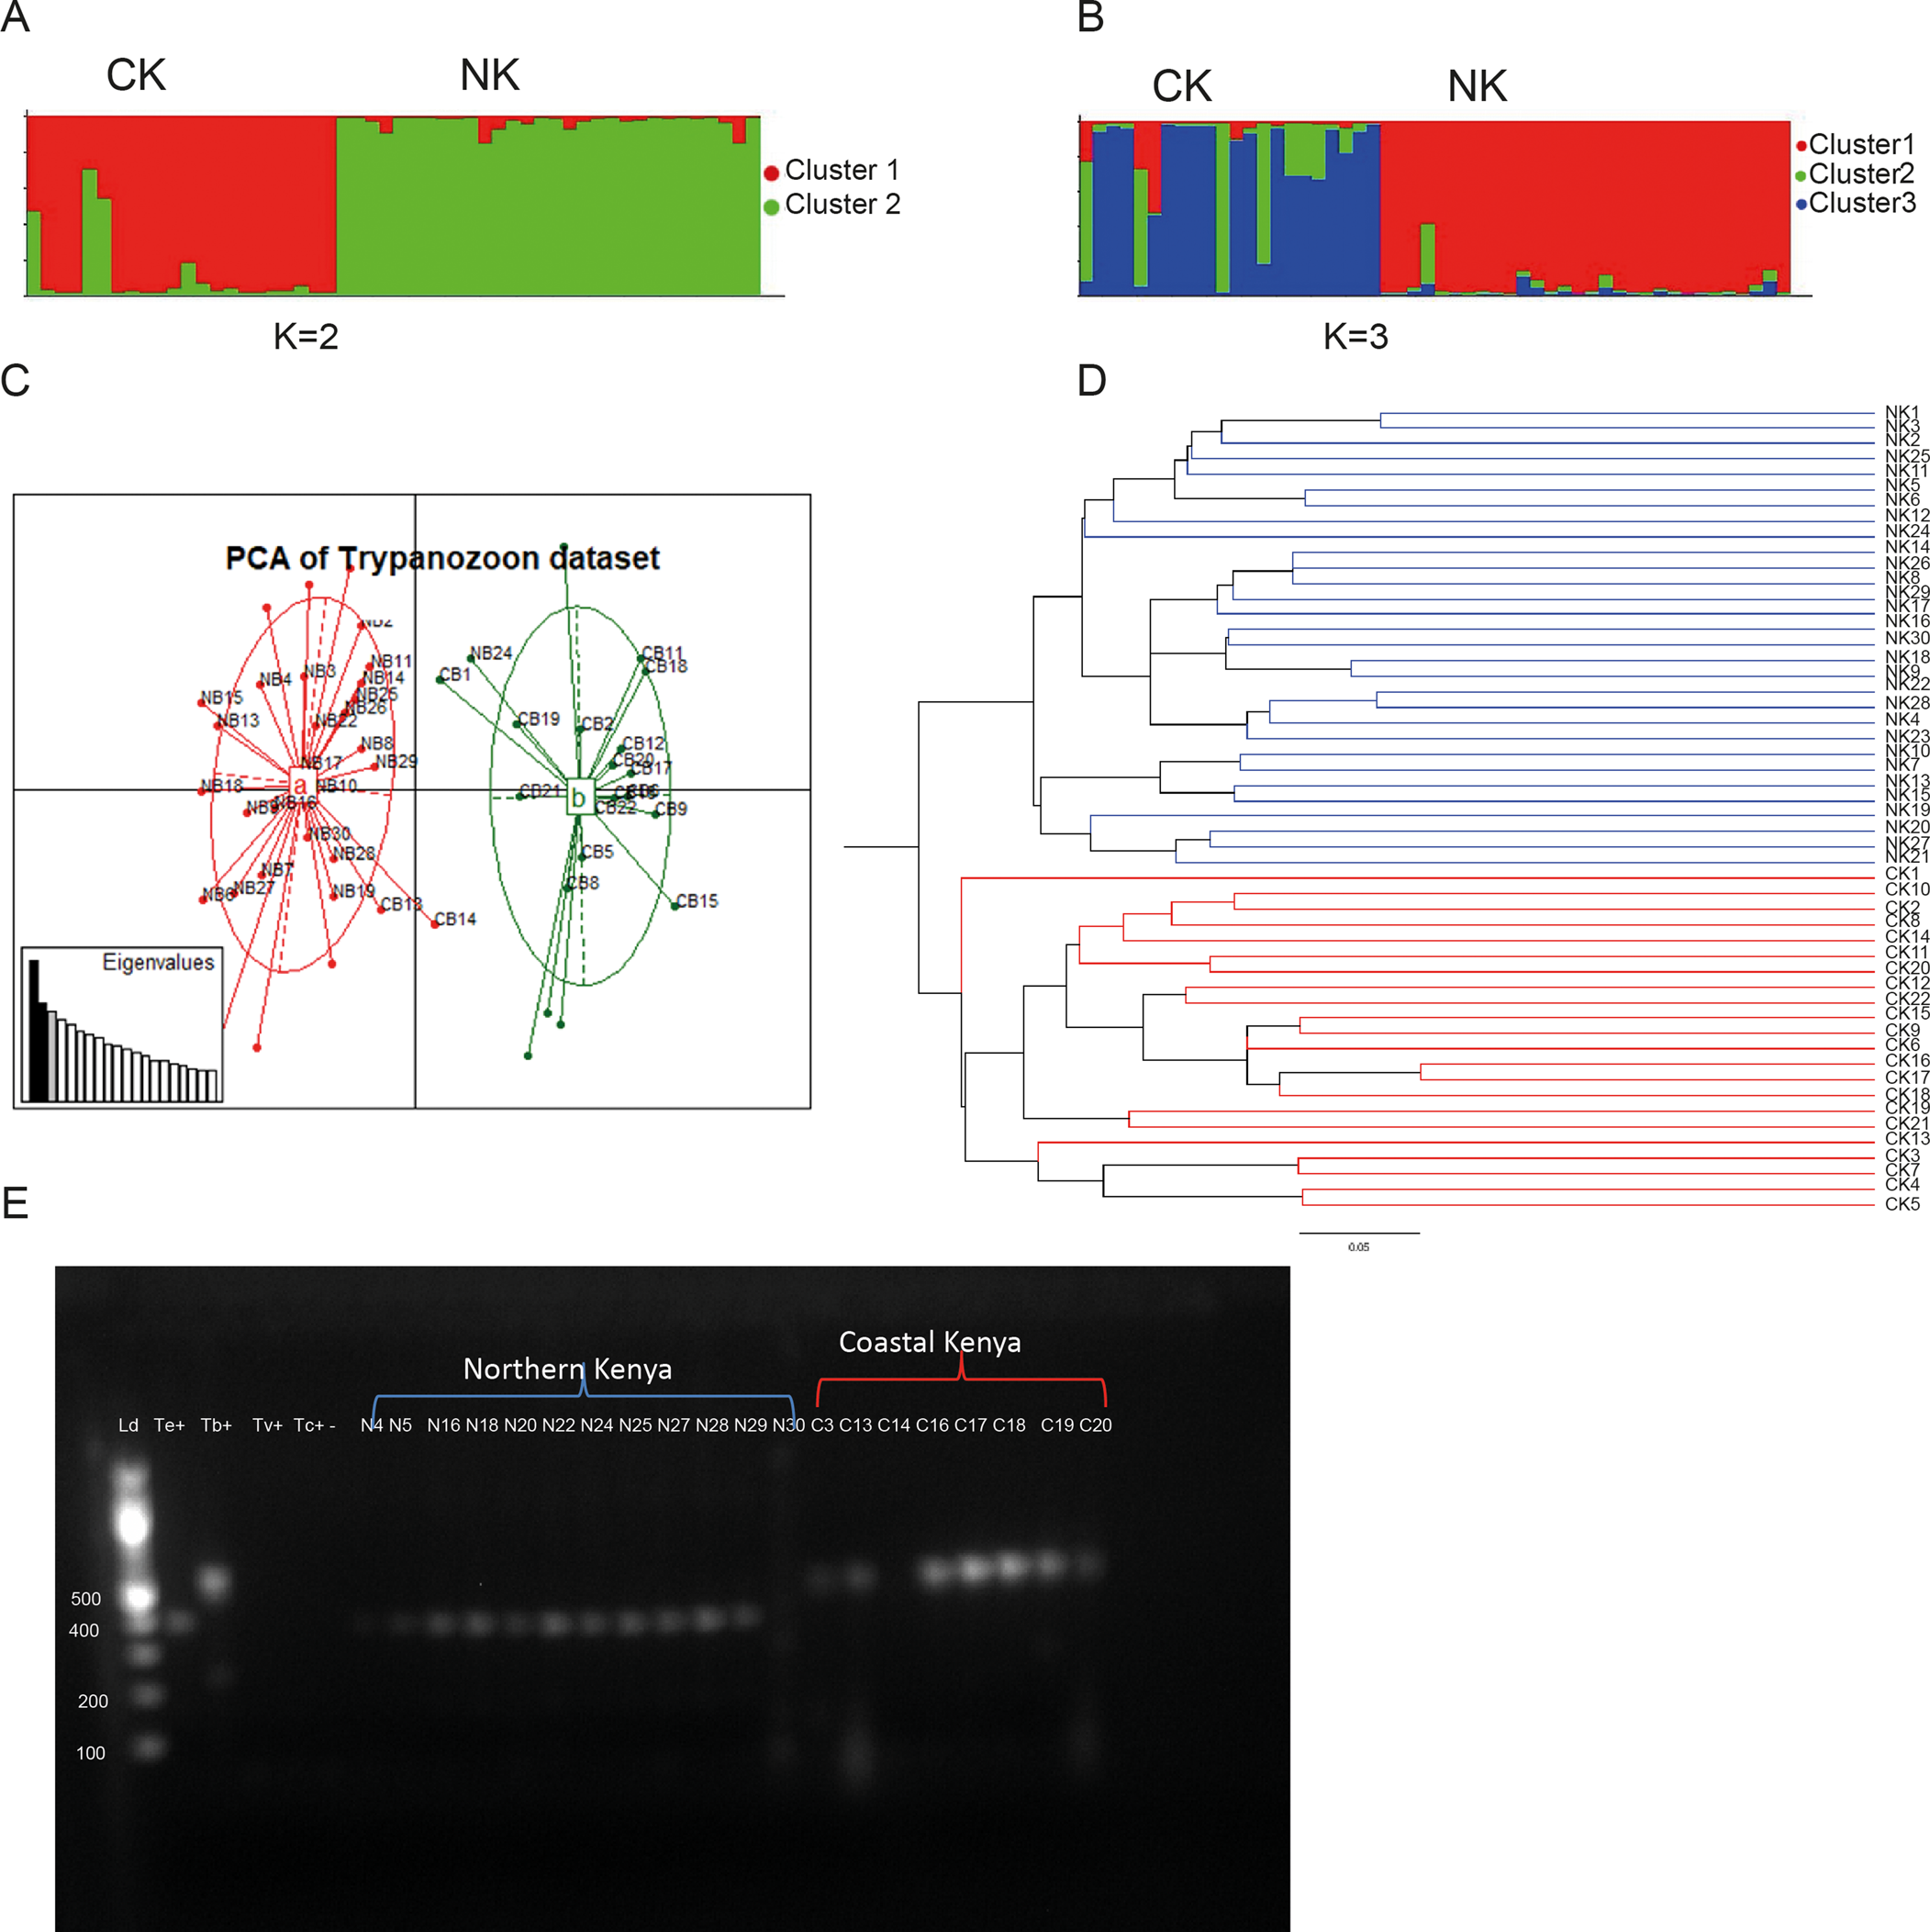
Fig. 2. Clustering analysis results of 52 T. (Trypanozoon) isolates (Trypanosoma brucei and Trypanosoma evansi) from Northern (NK) and Coastal (CK) regions in Kenya based on 14 microsatellite loci: (A, B) represent Bayesian clustering based on STRUCTURE results. (C) represents a PCA showing genetic population structure of the Trypanozoon isolates. Cluster a (red) consists mainly of Northern Kenyan isolates other than isolates CB13 and CB14, whereas cluster b (green) consists mainly of Coastal Kenya. (D) represents an UPGMA dendrogram for Trypanozoon isolates constructed based on 1000 bootstraps using Cavalli-Sforza and Edwards distances. The red branches are of Northern Kenyan isolates whereas the green branches are of Coastal Kenyan isolates. (E) Agarose gel electrophoresis (1.2%) performed on kDNA PCR amplicon PCR products were resolved through 1% ethidium-bromide stained agarose gel at 80 V for 1.5 h. Lane Kd M 100-bp marker (Thermo Scientific, USA) Te+, T. evansi (KETRI 2479) positive control; Tb+, T. brucei ILTat 1.4 positive control; Tv+, Trypanosoma vivax IL 2136 positive control; Tc+, Trypanosoma congolense savannah (IL3000) positive control; −, negative control; the rest T. (Trypanozoon) samples from Northern Kenya and Coastal Kenya.
Multivariate analysis confirmed Bayesian clustering results by revealing two distinct genetic clusters that were clearly differentiated based on geography (Fig. 2C). Each cluster was dominated by isolates from the two different sampling localities indicating the relevance of geographical isolation in clustering by multivariate analysis of these isolates. Cluster a (red) in the PCA includes two isolates from Coastal Kenya in addition to all isolates from Northern Kenya whereas cluster b (green) includes 20 isolates from Northern Kenya.
Hierarchical clustering by an UPGMA (Fig. 2D) further confirmed the results of Bayesian and multivariate analysis by revealing a population structured according to geography. Although not strong (bootstrap = 0.4023), the first level of distinction clearly separated Northern Kenyan samples from Coastal Kenyan samples. However, unlike other clustering methods where two isolates (CB13 and CB14) from Costal Kenya grouped among Northern Kenyan isolates, all isolates from both locations grouped separately.
We further did kDNA amplification using kDNA-specific primer and found that samples from Coastal Kenya and northern Kenya and positive control for T. brucei and T. evansi showed amplification, but with different sizes (Fig. 2E). However, we used T. vivax and T. congolense as positive control, but no kDNA amplification.
Genetic diversity
Only 4% of all the loci combinations were in linkage disequilibrium. However, no loci showed conformity to the HWE in both populations. Deviation from the HWE within the T. (Trypanozoon) taxa is expected due to the clonal reproduction. Among the location of origin-based populations, 171 different alleles were identified with the effective number of alleles estimated at 9.714 and 9.286 for Coastal Kenyan and Northern Kenyan populations, respectively. Shannon's information index (I) for the two populations were 0.114 and 0.084, respectively. The average number of private alleles for the coastal and northern populations was 2.929 and 2.50, respectively.
Allelic richness detected was 5.08 and 5.33 for the Northern and Coastal Kenyan populations respectively, showing relatively greater diversity among Coastal Kenyan isolates.
Observed heterozygosity (H o) was 0.79 and 0.835 whereas the expected heterozygosity (H e) was 0.819 and 0.813 for the Northern and Coastal Kenyan populations, respectively (Table 1). The Fisher inbreeding coefficient (F IS) for the Northern Kenyan isolates was −0.044 and that for the Coastal Kenyan isolates was 0.023. Among the structure-defined clusters, allelic richness ranged from 4.487 in cluster ‘a’ to 4.201 in cluster ‘b’. Observed heterozygosity ranged from 0.836 to 0.759 whereas expected heterozygosity ranged from 0.807 to 0.772. Inbreeding coefficient (F IS) values ranged between −0.053 and 0.011 (Table 1).
Table 1. Genetic diversity among T. (Trypanozoon) isolates from both sampling origin-based populations and STRUCTURE

Parameters N (sample size), N a (number of different alleles, N e (number of effective alleles), H O (observed heterozygosity), uH e (unbiased expected heterozygosity), F (fixation index) and I (Shannon's information index). Allelic richness for cluster ‘b’ with N below 4 could not be calculated.
Genetic differentiation and gene flow analysis
Fixation index (F ST) value between sampling localities was 0.0617 and revealed significant differentiation between the populations (P < 0.05). The small F ST value is an indication of moderate differentiation between the Northern and Coastal Kenyan populations. Among STRUCTURE-based cluster's, F ST values were 0.117 between clusters a (red) and b (green), 0.0965 between clusters a (red) and c (green), 0.1062 between clusters c (blue) and b (green) indicating rather moderate differentiation among all clusters. Differentiation between clusters c (blue) and a (red) was significant (P = 0.012).
AMOVA results (Fig. 3) revealed that 99% of the variation was caused by differences in genotypes within isolates and differences between populations accounted for 1% of the variation.

Fig. 3. AMOVA results on Trypanozoon isolates based on 14 microsatellite markers.
The partial Mantel test results revealed a statistically significant correlation (r = 0.3493, P = 1 × 10⁻⁴) between pairwise genetic distances F ST (1/1 − F ST) and geographical distances (Haversine distances) while controlling for environmental distances (Euclidian distances). Recent emigration and migration rates between the coastal and northern populations were 0.0113 and 0.0391, respectively. The high rate of self-distribution within both populations was an indication of asymmetric gene flow within the populations (Table S4). Gene flow (N em) or the effective number of migrants in the coastal and northern populations was 3.801 and 3.803, respectively.
Trypanosoma vivax
Genetic structure
A K value of 3 was suggested as the most likely level of hierarchy of population structure by Bayesian analysis (Fig. 4A). Cluster ‘a’ is made up of 19 T. vivax isolates all of which were from Northern Kenya. Cluster ‘b’ had 20 isolates, 17 of which were from Coastal Kenya and three from Northern Kenya. Cluster ‘c’ had 21 isolates, 13 of which were from Coastal Kenya and eight from Northern Kenya. Assignment of the T. vivax isolates to specific clusters based on the Q values is provided in Table S3. As seen from the Q values, a number of isolates from the two different sampling localities displayed variable degrees of assignment to specific clusters, which may be evidence of long-range dispersal between the sampling localities.
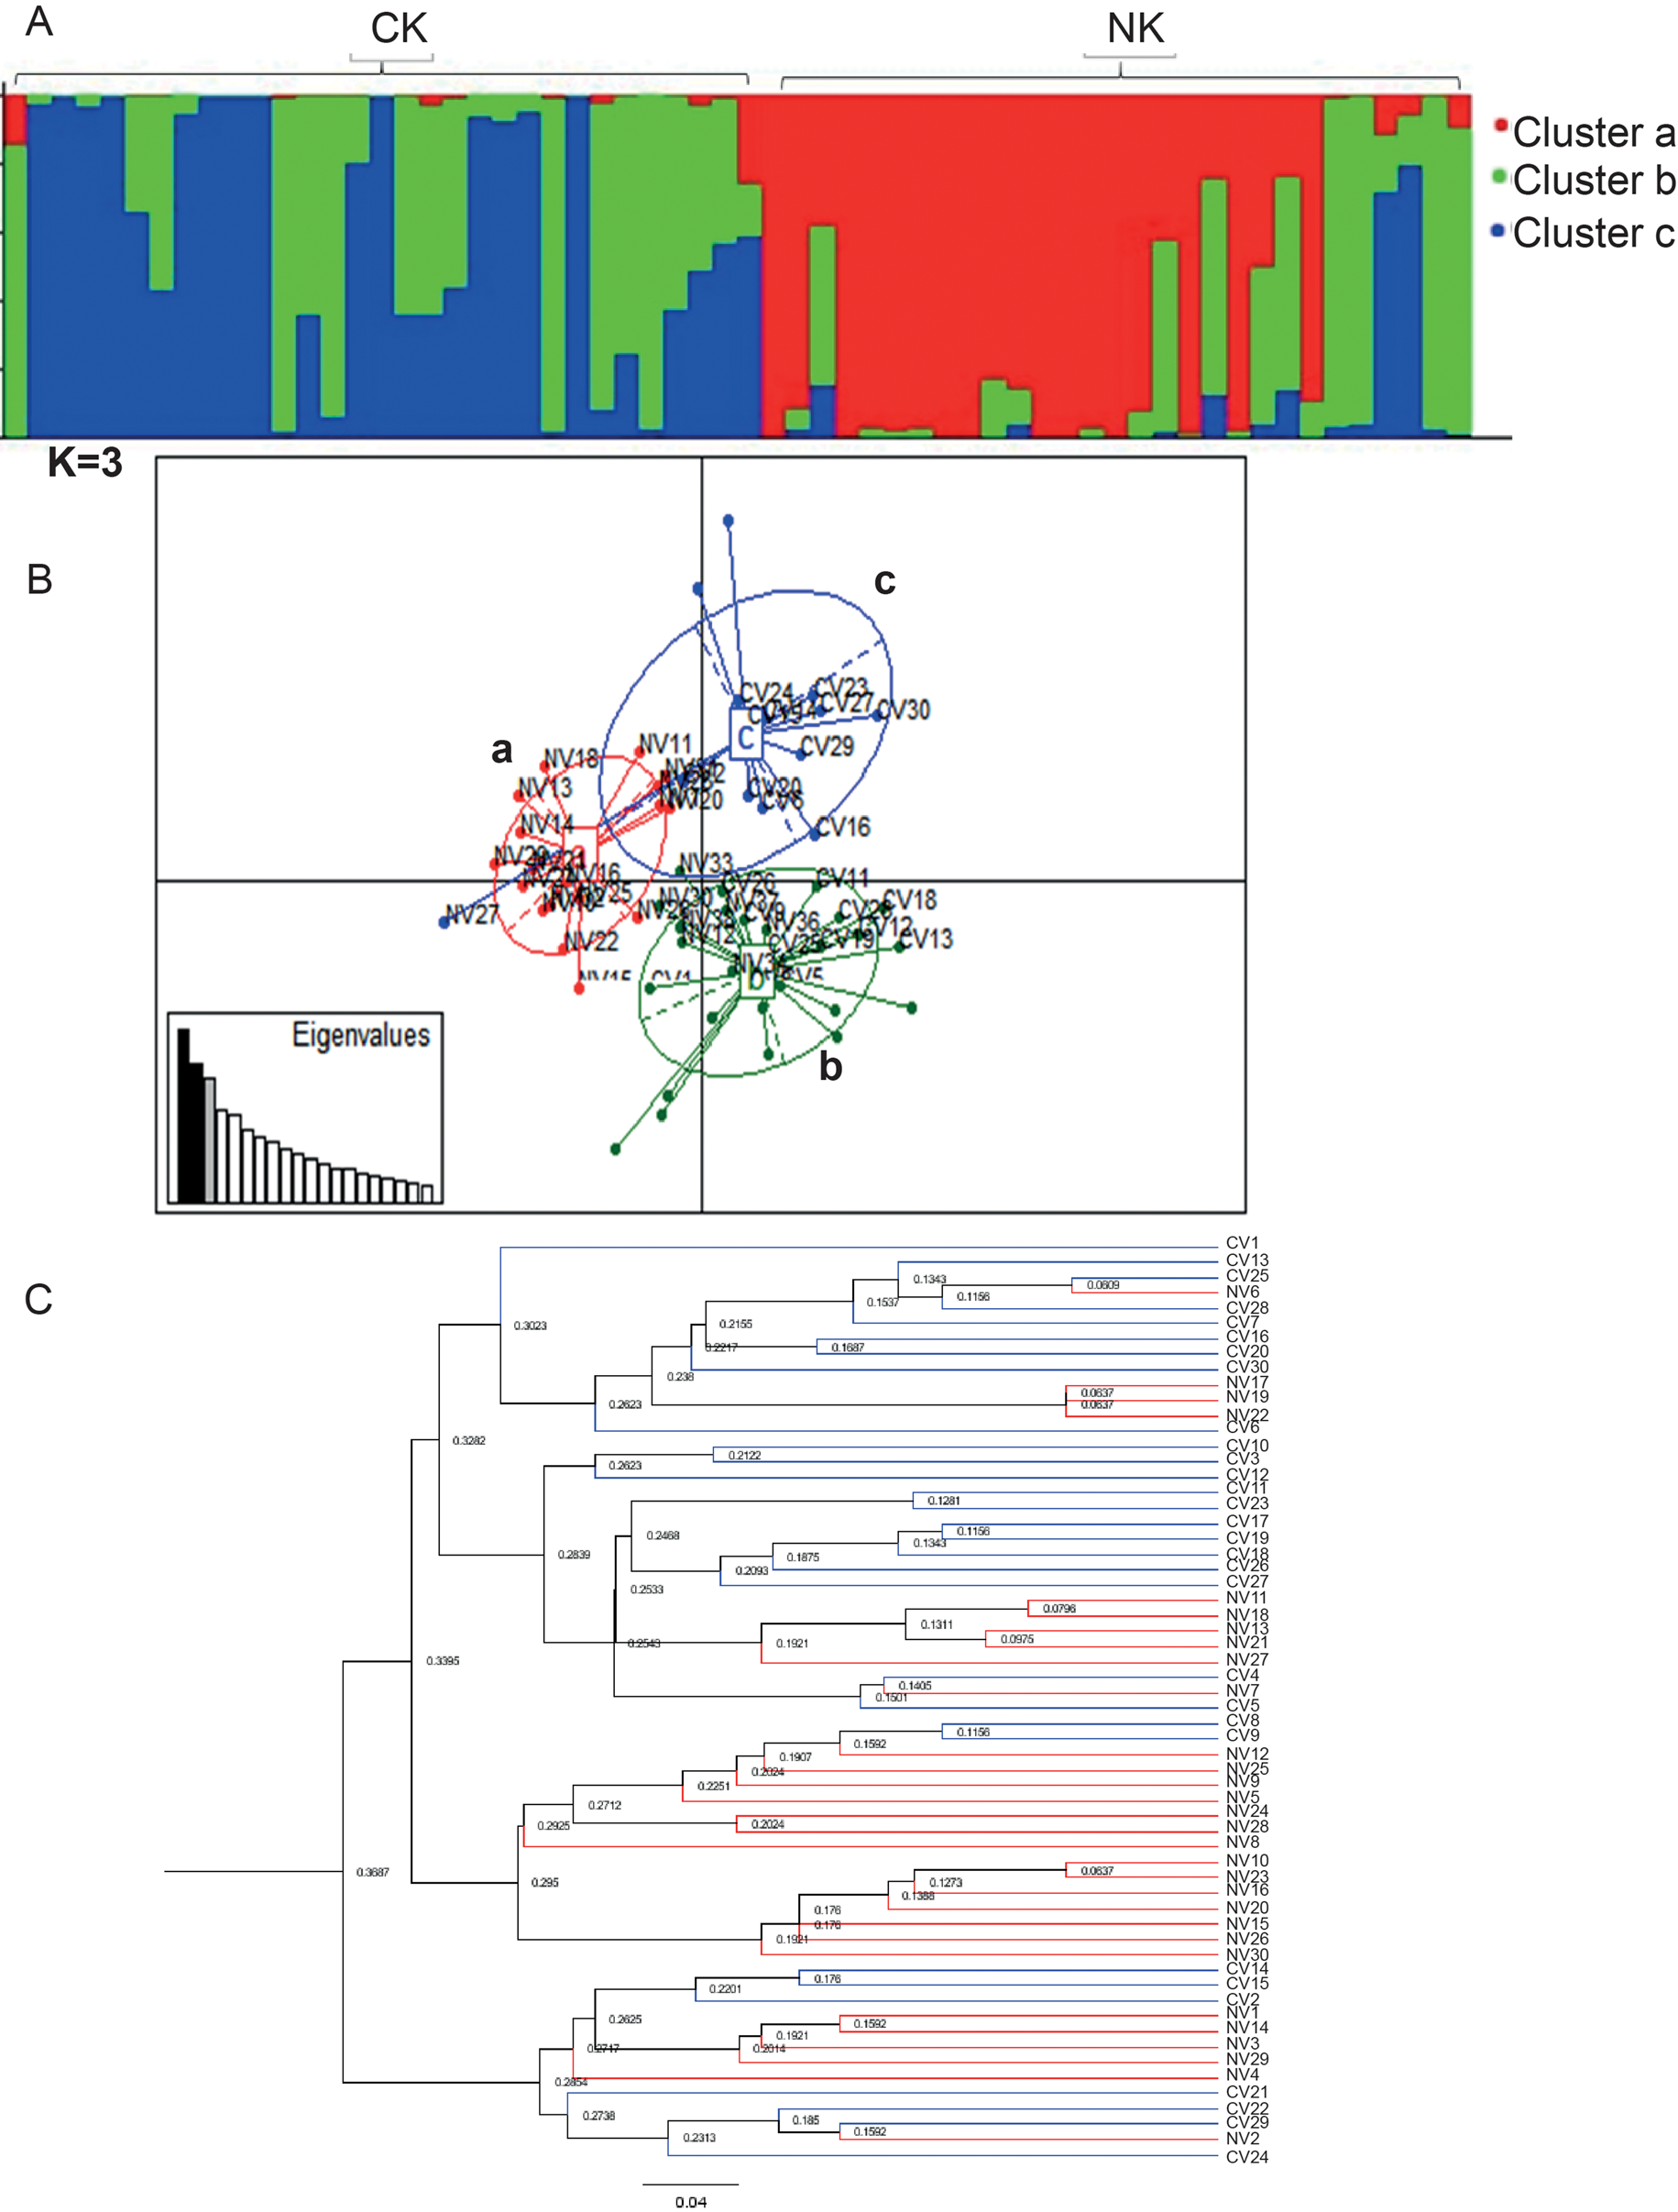
Fig. 4. Clustering analysis results on 60 T. vivax isolates from Northern (NK) and Coastal (CK) regions in Kenya based on six microsatellite loci. (A) STRUCTURE results image of best fit at K (K = 3) based on the ad hoc statistic. (B) PCA image showing how T. vivax samples from both sampling locations are sub-structured. Cluster a is made up of isolates from Northern Kenya, cluster b has samples from both locations while cluster c has samples from only Coastal Kenya. (C) An UPGMA tree based on six microsatellite markers, constructed using Cavalli-Sforza and Edwards distances showing hierarchical structuring of T. vivax isolates. The blue branches represent isolates from Coastal Kenya whereas the red branches are of isolates from Northern Kenya.
Multivariate analysis for T. vivax isolates confirmed the presence of three distinct genetic clusters (Fig. 4B). None of the three clusters were in the same multivariate space. PC axis 1 separated cluster a from clusters b and c whereas PC axis 2 separated cluster b from cluster c. Cluster a had 18 isolates from Northern Kenya, cluster b had 11 isolates from Northern Kenya and 17 isolates from Coastal Kenya. Cluster c had only one isolate from Northern Kenya and 13 from Coastal Kenya. Multivariate analyses such as Bayesian analysis revealed the separation of a group of Northern Kenyan isolates from Coastal Kenyan isolates (Fig. 4B and C).
Furthermore, an UPGMA dendrogram was constructed to show the relationship between T. vivax isolates from tsetse-free areas and isolates from tsetse-endemic areas (Fig. 4C). The dendrogram largely confirmed results from Bayesian and multivariate analyses. It revealed the presence of three distinct clusters, one with a group of NK isolates similar to in cluster ‘a’ in STRUCTURE and PCA with all isolates from Northern Kenya. One other cluster had a majority of isolates from CK and the third cluster had isolates from both localities.
Genetic diversity and HWE
Only one (TB8/11 and TB1/8) of 30 loci combinations was in linkage disequilibrium (P < 0.05). Yet, all but loci TB1/8 showed deviation from the HWE in at least one of the sampling localities. There were 69 different alleles identified with the effective allele size estimated at 3.635. Within sampling localities, allelic richness was 6.094 and 6.011 for Northern Kenyan and Coastal Kenyan populations, respectively. The average number of private alleles for Northern Kenyan and Coastal Kenyan populations was 3.33 and 3.667, respectively. Shannon's information index (I) of the populations was estimated at 1.502 and 1.531, respectively. Observed heterozygosities were 0.734 and 0.732 and the expected heterozygosities (Nei's gene diversity) were 0.698 and 0.718 for the northern and coastal populations, respectively. Inbreeding coefficient (F IS) values were −0.082 and −0.065. Among STRUCTURE-defined clusters, allelic richness ranged from 5.21 in cluster ‘b’ to 3.49 in cluster ‘c’. Observed heterozygosity ranged from 0.667 in cluster c (blue) to 0.832 in cluster b (green) and expected heterozygosity ranged from 0.662 in cluster c (blue) to 0.806 in cluster b (green) (Table 2). The average numbers of private alleles were 2.167, 2.833 and 1.167 and the average numbers of different alleles and 5.33, 6.667 and 4.167 for clusters a (red), b (green) and c (blue), respectively (Table 2).
Table 2. Genetic diversity of Trypanosoma vivax isolates within sampling origin-based populations and STRUCTURE-based populations subject of six microsatellite loci

N, sample size; N a, number of different alleles; N e, number of effective alleles; H O, observed heterozygosity; uH e, unbiased expected heterozygosity; F, fixation index; I, Shannon's information index.
Genetic differentiation and gene flow analysis
Genetic differentiation between the sampling localities-based populations was significantly differentiated (F ST = 0.099, P = 0.005). Between structure-defined clusters, F ST values were 0.182 between clusters ‘a’ and ‘c’, 0.102 between clusters ‘b’ and ‘c’ and 0.053 between clusters ‘a’ and ‘b’ with significant differentiation in all cluster pairs (P < 0.05). AMOVA results for T. vivax showed that 91% of the variation was due to differences in genotypes within individuals while differences between the sampling localities-based populations accounted for 6% of the variance (Fig. 4C). Differences between isolates in a population only accounted for 3% of the total variance. These results indicate that genetic differentiation among T. vivax isolates was not explained by sampling location but largely by differences in genotypes within the isolates (Fig. 5).
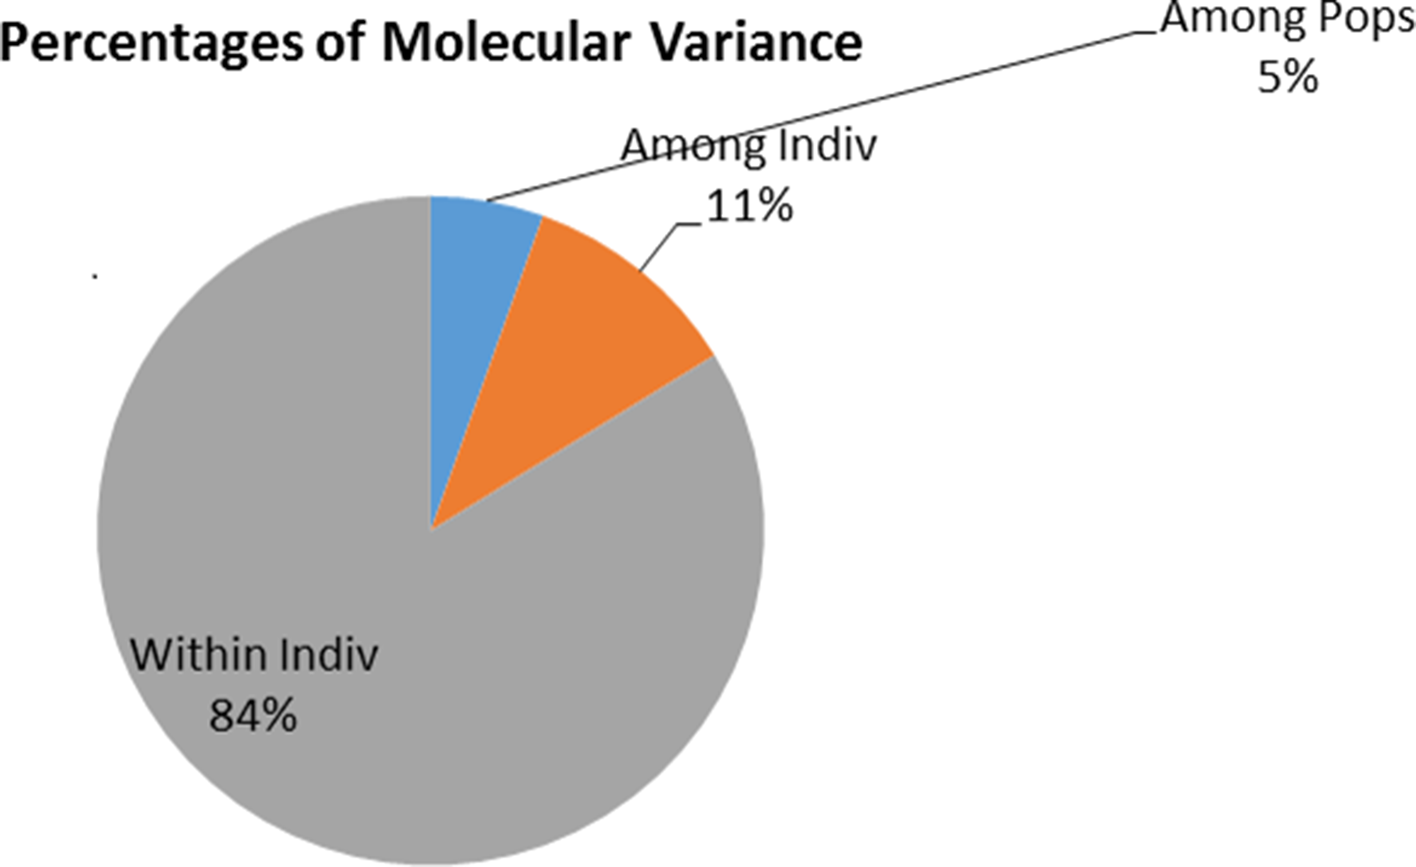
Fig. 5. AMOVA analyses results based on six microsatellite loci on T. vivax isolates from Northern and Coastal Kenyan regions
According to the partial Mantel test results, there was significant correlation between genetic distances and geographical distances while controlling for environmental conditions (r = 0.3846, P = 1 × 10⁻⁴).
Emigration and immigration rates between the Coastal Kenyan and Northern Kenyan populations were 0.0238 and 0.0356, respectively. Asymmetric gene flow within both populations was evident due to the high self-distribution recorded (Table S4). The effective number of migrants (N em) was equal in both populations at 2.275. Being that 1 < N em < 4, the two populations are genetically close but gene flow between them is limited.
These results suggest moderate gene flow between the populations regardless of isolation by distance. This may be due to the introduction of T. vivax in one population from the other due to animal movement, from tsetse-infested areas of Kenya or from the region. Migration rate results indicate that migration is low and non-directional. Therefore, the parasites are introduced in both populations from the adjacent population.
Trypanosoma congolense
Population structure
Bayesian clustering analysis (STRUCTURE results) was consistent with hierarchical clustering results on the presence of two distinct genetic clusters (Fig. 6A). All NK isolates grouped together with CK isolates indicating no separation. To determine the level of population structure based on the genetic distance matrix, an UPGMA dendrogram of similarity based on Cavalli-Sforza and Edwards, pairwise genetic distances was constructed (Fig. 6C). The results showed no separation between the Northern Kenyan and the Coastal Kenyan isolates and were consistent with Bayesian analysis. In addition, the dendrogram revealed the presence of two clusters and two isolates (C10 and C1) sharing a multilocus genotype (MLG). However, the PCA data disputed the hierarchical and Bayesian clustering results and revealed three clusters but agreed with both on no separation between NK and CK isolates.

Fig. 6. Clustering analysis results on 32 T. congolense isolates from Northern (NK) and Coastal (CK) regions in Kenya based on five microsatellite loci. (A) STRUCTURE HARVESTER results based on the ad hoc statistics indicated K = 2 as the best K value. (B) A PCA showing structuring of T. congolense isolates. The clusters are clearly separated and in different PC components. Isolates from Northern Kenya are however not genetically separated from isolates from Coastal Kenya. (C) An UPGMA dendrogram based on Cavalli-Sforza distances showing no separation of T. congolense between Coastal Kenyan and Northern Kenyan isolates.
Genetic diversity
Hardy–Weinberg proportions from allele frequency data showed deviation from the HWE in at least one population of all loci. One reason for deviation from the HWE is limited genetic exchange between isolates due to predominant clonal reproduction. Linkage disequilibrium analysis revealed that only one (TB8/11 and TB6/7) of ten loci combinations was in linkage disequilibrium. This is an indication that loci used in this analysis are evenly distributed within the genome, which is favourable. However, results of linkage disequilibrium among loci within Northern Kenyan isolates were inconclusive due to the limited number of isolates in the population
Genetic diversity analysis revealed the presence of 42 alleles across the two populations. Allelic richness (with rarefaction) for the northern and coastal populations was 3.56 and 2.80, respectively, thus indicating greater genetic diversity within the coastal population. The observed mean heterozygosities were 0.668 and 0.667 whereas the expected heterozygosities were 0.710 and 0.653 for the northern and coastal populations, respectively. Inbreeding coefficient (F IS) was −0.195 and 0.009, respectively, as displayed in Table 3.
Table 3. Sample size and genetic diversity of Trypanosoma congolense isolates within sampling origin-based populations

N, sample size; N a, number of different alleles; N e, number of effective alleles; H O, observed heterozygosity; uH e, unbiased expected heterozygosity; F, fixation index; I, Shannon's information index calculated in GenALEX v6.5 (Peakall and Smouse, Reference Peakall and Smouse2006); A R*, allelic richness calculated in HP-RARE (Kalinowski, Reference Kalinowski2005).
Differentiation and gene flow analysis
We estimated fixation index (F ST) between the coastal and northern populations at −0.028 (P = 0.713). Negative F ST value is statistically equal to 0 and the negative value is a result of sampling bias within the populations. A fixation index of zero is an indication of no differentiation between Coastal and Northern Kenyan isolates.
Partial Mantel test results revealed a positive but not significant correlation between geographical and genetic distances while controlling for environmental conditions (r = 0.311, P = 0.3219). This means that genetic structuring among the isolates was independent of sampling location.
Immigration and emigration rates from the coastal to the northern populations were 0.2612 and 0.033, respectively. Self-distribution rate within the coastal and northern populations was at 0.9667 and 0.788.
Discussion
This study comprising population-genetic differentiation of three veterinary important trypanosome species from two distinct localities, i.e. from tsetse-infested and non-tsetse-infested area has demonstrated close interspecies phylogenetic relationships, for example among T. congolense isolates regardless of the variations in the mode of transmission, climate and vectors present. However, we have also seen that some trypanosomes such as T. (Trypanozoon) are distinct between the two sites demonstrating local adaptation and evolution. Individual trypanosome species were found to be distributed across different ecological settings, spanning from wet Coastal Kenya infested with tsetse flies to dry Northern Kenya, where there are no tsetse flies. Most host–parasite systems exhibit remarkable heterogeneity in the contribution of transmission of certain individuals, locations, host infectious states or parasite strains. It was noted in this study that both sites have domestic animals and blood feeding insects, the only differences being the absence of camels in the coastal region, which are abundant in Northern Kenya and the absence of tsetse flies in Northern Kenya which are abundant in Coastal Kenya. All three trypanosomes: T. (Trypanozoon), T. congolense and T. vivax were encountered in both regions.
T. (Trypanozoon)
Trypanosoma (Trypanozoon) isolates clustered into two genetic clusters by Bayesian clustering in STRUCTURE (Fig. 2A). A majority of isolates in each cluster were from one of the two sampling locations indicating genetic distinctness of isolates from each population. These results are consistent with both multivariate and hierarchical clustering results, both of which grouped the isolates into two groups each dominated by isolates from each sampling location. Clustering of these isolates mainly by geographical origin is due to the presumed presence of different T. (Trypanozoon) species: T. evansi and T. brucei in the two geographical regions. Trypanosoma evansi, which is exclusively transmitted mechanically, is mainly found in tsetse-free Northern Kenya, whereas T. brucei is present in the coastal region where tsetse flies are abundant (Getahun et al., Reference Getahun2020). Because of its diskinetoplastidy, T. evansi can no longer complete cyclical development in the tsetse flies (Lai et al., Reference Lai2008). However, we cannot rule out its circulation in tsetse-infested areas as tsetse flies do transmit T. evansi mechanically (Roditi and Lehane, Reference Roditi and Lehane2008) and other domestic and wild animals are hosts and reservoirs of the parasite. Nonetheless, previous genomic analyses of T. evansi and T. brucei isolates have shown that the species are not always distinguishable even with sequencing (Büscher et al., Reference Büscher, Gonzatti, Hebert, Inoue, Pascucci, Schnaufer, Suganuma, Touratier and Reet2019; Getahun et al., Reference Getahun2020).
The next best fit of K (K = 3) in STRUCTURE revealed a level of sub-structuring within Coastal Kenyan isolates (T. brucei) and genetic homogeneity among Northern Kenyan T. (Trypanozoon) (T. evansi). These, together with greater genetic diversity among coastal T. (Trypanozoon) (T. brucei) evidenced by greater allelic richness, Shannon's information index (I), and average private allele values (Table 1) compared to northern T. (Trypanozoon) (T. evansi) isolates is consistent with findings from previous studies on microsatellite genotyping of the T. (Trypanozoon) group which revealed that T. evansi and T. brucei are closely genetically related to each other (Claes et al., Reference Claes, Büscher, Touratier and Goddeeris2005; Carnes et al., Reference Carnes, Anupama, Balmer, Jackson, Lewis, Brown, Cestari, Desquesnes, Gendrin, Hertz-Fowler, Imamura, Ivens, Kořený, Lai, MacLeod, McDermott, Merritt, Monnerat, Moon, Myler, Phan, Ramasamy, Sivam, Lun, Lukeš, Stuart and Schnaufer2015; Wen et al., Reference Wen, Lun, Zhu, Hide and Lai2016; Kamidi et al., Reference Kamidi2017) and that T. brucei displays significant sub-structuring and genetic diversity within the species (Echodu et al., Reference Echodu, Sistrom, Bateta, Murilla, Okedi, Aksoy, Enyioha, Enyaru, Opiyo, Gibson and Caccone2015; Kamidi et al., Reference Kamidi2017). Isolates with Q values below 0.8 revealed ambiguous assignment into either of the three clusters. Ambiguous assignment may be evidence of occurrence of genetic admixture, migration and subsequent mating between local and immigrant strains or shared ancestry. In addition, it may be an indication of the limitation of the microsatellite markers used to separate recently diverged taxa into distinct clusters (Pritchard et al., Reference Pritchard, Stephens and Donnelly2000).
Ninety-six percent of loci were in the linkage equilibrium. This means that genotypes at majority of the loci were independent of genotypes on other loci. Overall, H O values were lower than H e values among all isolates. This may be credited to deviation from HWE, Wahlund effect and null alleles (Li et al., Reference Li2019). Negative inbreeding coefficient (F IS) among the Northern Kenyan (T. evansi) isolates may be explained by clonal or non-sexual reproduction. This is because, F IS is the proportion of the variance in the subpopulation contained in an individual and its calculation is dependent on observed and expected heterozygosities. Although clonal reproduction does not affect the observed heterozygosity, it does reduce the expected heterozygosity among isolates (Prugnolle and De Meeûs, Reference Prugnolle and De Meeûs2008). Trypanosoma evansi strains are thought to reproduce clonally because the species does not transform into developmental stages that colonize the gut and salivary glands in tsetse flies where sexual reproduction occurs. However, there were no MLGs in the population and this casts doubt on the idea of exclusive of clonal reproduction among T. evansi isolates as did results by (Salim et al., Reference Salim2011).
Wright's fixation index (F ST) between the location of origin-based populations was statistically significant thus revealing genetic differentiation between Northern Kenyan (T. evansi) and Coastal Kenyan (T. brucei) T. (Trypanozoon) isolates. Furthermore, the low gene flow rate (N em < 4) is a clear indication that the two populations are not panmictic, thus there exist barriers to gene flow. However, the effective number of migrants is greater than one in both populations, which is more evidence of the close genetic relationship and low-genetic differentiation between the two species. Nonetheless, isolation by distance analysis revealed that structuring and genetic differentiation within the T. (Trypanozoon) isolates was strongly dependent on the location of origin. In addition, AMOVA results showed that although the isolates are mainly structured based on location of origin, differences in genotypes within isolates was the greatest contributing factor to genetic differentiation and sub-structuring. This indicates that although they are very closely related genetically, the two species are fundamentally genetically distinct.
This may be evidence against the need for revision of the entire taxonomic unit T. (Trypanozoon) as proposed by Büscher et al. (Reference Büscher, Gonzatti, Hebert, Inoue, Pascucci, Schnaufer, Suganuma, Touratier and Reet2019). Classification of Trypanosome DNA is mainly based on ribosomal DNA genetic markers (Njiru et al., Reference Njiru2004, Reference Njiru2005, Reference Njiru2006). Telling apart T. brucei and T. evansi with these markers is impossible with gel electrophoresis and at times difficult after sequencing (Büscher et al., Reference Büscher, Gonzatti, Hebert, Inoue, Pascucci, Schnaufer, Suganuma, Touratier and Reet2019; Getahun et al., Reference Getahun2020). However, since a large number of microsatellite loci that amplify T. (Trypanozoon) genotypes have been identified (Balmer et al., Reference Balmer, Palma, Macleod and Caccone2006; Salim et al., Reference Salim2011; Sistrom et al., Reference Sistrom2013), identification of private microsatellite marker bands (gel electrophoresis bands unique in each taxa) within the T. (Trypanozoon) group may present a potential for application of microsatellite loci as species identification markers to remove the problem of precise species identification. The amplification of kDNA in T. (Trypanozoon) samples obtained from both regions agrees with the limitation of kDNA to differentiate these two subspecies, as some T. evansi are dyskinetoplastic (Borst et al., Reference Borst, Fase-Fowler and Gibson1987; Schnaufer, Reference Schnaufer2010; Büscher et al., Reference Büscher, Gonzatti, Hebert, Inoue, Pascucci, Schnaufer, Suganuma, Touratier and Reet2019).
Trypanosoma vivax
From this study, STRUCTURE and PCA results suggest that T. vivax isolates are clustered into three distinct genetic groups. The results are consistent with previous phylogenetic studies on T. vivax which indicated genetic heterogeneity within the species especially in East Africa (Fasogbon et al., Reference Fasogbon, Knowles and Gardiner1990; Duffy et al., Reference Duffy, Morrison, Black, Pinchbeck, Christley, Schoenefeld, Tait, Turner and MacLeod2009). These results also suggest that T. vivax isolates within clusters were more similar in geographical origin which might be affected by local adaptation such as mode of transmission, vertebrate hosts and environmental factors. The clustering of a group of Northern Kenyan isolates separately shows an independent evolution due to differences in geographical factors, hosts and vectors which may be a driving force of genetic separation. However, the identification of two distinct clusters in Coastal Kenya in the same ecosystem indicates that the existence of different T. vivax strains demonstrating genetic differentiation can result in the same habitat, which may be an indication that other factors, other than geographical variation, can contribute to genetic heterogeneity. In addition, the possibility of strains specific to different livestock host species cannot be ruled out.
Five out of six loci showed deviation from the HWE which may be due to predominant clonal reproduction of T. vivax populations. Genetic diversity in the Northern Kenyan population was relatively lower compared to the Coastal Kenyan population. This was inferred from results of genetic diversity measures: average number of alleles, Shannon's information index, Nei's gene diversity (H E) and allelic richness, all of which had lower values of the Northern Kenyan population. Among STRUCTURE-defined clusters (Fig. 3), cluster a (red) with all isolates from Northern Kenya had higher genetic diversity compared to cluster c (blue) with the highest number of Coastal Kenyan isolates which may be attributed to disparity in population size which leads to bias in allele frequencies. Cluster b (green) with isolates from both sampling locations however revealed the greatest genetic diversity. These results of greater genetic diversity among tsetse-borne T. vivax agree with findings from previous studies of greater diversity among T. vivax from tsetse-endemic areas (Rodrigues et al., Reference Rodrigues2008). Greater observed heterozygosities, deviation from the HWE and negative F IS among Coastal Kenyan isolates suggests that the population is clonal. These results suggest that the T. vivax populations studied here are predominantly clonal and agree with previous studies that revealed clonal reproduction T. vivax including in tsetse-borne T. vivax (Duffy et al., Reference Duffy, Morrison, Black, Pinchbeck, Christley, Schoenefeld, Tait, Turner and MacLeod2009). However, previous studies on T. vivax isolates have revealed that meiosis-associated genes in T. brucei are highly conserved in T. vivax and therefore we cannot completely eliminate the possibility of genetic recombination among T. vivax strains (El-Sayed et al., Reference El-Sayed, Myler, Blandin, Berriman, Crabtree, Aggarwal, Caler, Renauld, Worthey, Hertz-Fowler, Ghedin, Peacock, Bartholomeu, Haas, Tran, Wortman, Alsmark, Angiuoli, Anupama, Badger, Bringaud, Cadag, Carlton, Cerqueira, Creasy, Delcher, Djikeng, Embley, Hauser, Ivens, Kummerfeld, Pereira-Leal, Nilsson, Peterson, Salzberg, Shallom, Silva, Sundaram, Westenberger, White, Melville, Donelson, Andersson, Stuart and Hall2005). Given that these results suggest that T. vivax populations studied here are clonal, the high number of unique genotypes in the populations may be due to amplification failure, null alleles or dropout alleles.
The Northern Kenyan isolates are significantly differentiated from the Coastal Kenyan isolates based on Wright's F ST. Among STRUCTURE-defined clusters, the greatest differentiation observed was between cluster a (red), with all Northern Kenyan isolates and cluster b (green) with a mixture of isolates from both populations and the least differentiation was between clusters a (red) and c (blue) with a majority of isolates from the Coastal Kenyan population. This revealed that cluster b (green) is significantly differentiated from other clusters. These results agree with AMOVA results that revealed that differences between isolates in a subpopulation accounted for more variance than did differences between subpopulations. In addition, isolation by distance results exposed further evidence that the structuring of the T. vivax isolates was dependent on geographical origin. However, the findings suggest moderate gene flow between the populations regardless of isolation by distance. This is an indication that the populations are genetically close with the limited gene flow likely due to the barrier caused by the geographical distance between them.
However, a group of Northern Kenyan isolates cluster together with a group of Coastal Kenyan isolates in STRUCTURE analysis and this cluster (b – green) shows a significant differentiation from other clusters dominated by isolates from both sampling locations. Therefore, it is likely that the isolates in this subpopulation have undergone independent evolution and therefore they cluster together. These results therefore agree with the idea that heterogeneity among African T. vivax isolates is linked to biological transmission by tsetse flies. Trypanosoma vivax isolates from tsetse-free Northern Kenya are genetically separated from isolates from the tsetse-endemic Coastal Kenyan region. These observations therefore further dispute sequence analysis results of the rDNA of T. vivax strains from tsetse-free and tsetse-infested areas of Ethiopia that indicated that genetic heterogeneity among the strains is not linked to their geographical origin. This then means that greater genetic heterogeneity among African T. vivax strains compared to Latin American strains is associated with mode of transmission.
Trypanosoma congolense
All the three clustering analysis methods used failed to separate T. congolense isolates from NK from T. congolense isolates from the CK region. Wright's fixation index F ST results also show that the former are not genetically differentiated from the latter. In addition, isolation by distance analysis revealed that genetic structuring within the population was independent of sample's location of origin. Trypanosomes undergo genetic adaptation events that allow them to utilize different energy sources in vectors and hosts (Ooi et al., Reference Ooi2016; Szöőr et al., Reference Szöőr, Silvester and Matthews2020). Trypanosoma brucei, for example, has mitochondrial genes that allows it to utilize α-ketoglutarate as an energy source in the tsetse midgut (Szöőr et al., Reference Szöőr, Silvester and Matthews2020). Trypanosoma evansi lacks these genes and thus it has lost its ability for biological transmission. Therefore, genetic data would reflect intra-species differences in isolates with different transmission mechanisms. With these considerations in mind, our findings do not support the hypothesis that T. congolense from tsetse-free areas are being maintained by unknown biological vectors first proposed by Gibson et al. (Reference Gibson, Wilson and Moloo1983). However, the small number of samples in the Northern Kenyan population makes the findings indicative and not conclusive and therefore, there is need for more population-genetic studies on T. congolense from tsetse-free and tsetse-infested areas with a large number of samples.
Trypanosoma congolense isolates have, however, been isolated in livestock blood and biting flies from tsetse-free areas of Northern Kenya for a long period of time (Gibson et al., Reference Gibson, Wilson and Moloo1983; Getahun et al., Reference Getahun2020) Yet, these results show no genetic separation between Northern Kenyan and Coastal Kenyan (tsetse-borne) isolates which suggests that the parasite is probably introduced in these areas from livestock that travels to tsetse-inhabited areas for pasture and water. Also, these results may suggest the presence of tsetse flies in Northern Kenyan regions but at very low densities hard to detect densities that need detailed wide survey of tsetse flies.
Our data provide novel insights into the population structure and genetic range of the three trypanosome species from the two ecological settings. The major findings of this work confirm that genetic heterogeneity among African T. vivax strains is linked to biological transmission. T. (Trypanozoon) microsatellite analysis results show clear separation of Coastal Kenyan and Northern Kenyan isolates. These results also reveal the need to explore application of microsatellite loci in T. (Trypanozoon) taxa identification. Lastly, the results reveal no genetic separation of T. congolense strains from tsetse-free and tsetse-endemic areas, even though we have a small sample size from Northern Kenya.
Conclusion
All three trypanosome species were found to be widely distributed across different ecological settings, spanning from wet Coastal Kenya infested with tsetse flies to dry Northern Kenya, where there are no tsetse flies. With regards to this, we found genetic diversity and a clear separation of T. vivax and T. (Trypanozoon) isolates between the two ecosystems but not between T. congolense isolates. In future studies, optimizing microsatellite-based markers to differentiate T. brucei and T. evansi needs to be investigated. Furthermore, trypanosomes from more livestock host and vectors need to be analysed to find out if there is specific adaptation of trypanosomes to a given host.
Supplementary material
The supplementary material for this article can be found at https://doi.org/10.1017/S0031182021001815.
Acknowledgements
We are grateful to Dr Jandouwe Villinger and Mr James Kabii for their support with organizing for fragment analysis. We are also grateful to Allan Okwaro for his support with allele scoring and scores’ editing, and to Kimathi and Emily for the study site map.
Author contributions
NNK conceived and performed the experiments, analysed data and wrote the manuscript. KMK analysed data. NOA and TM reviewed the experimental design and manuscript. MNG envisioned the research idea, mobilized resources, generated data, supervise the research and reviewed the manuscript.
Financial support
This research project was funded by BMZ/GIZ 81219442 Project Number: 16.7860.6-001.00, MPI-icipe partner group to MNG. The Integrated Biological Control Applied Research Program (IBCARP) camel, grant no. DCI-FOOD/2014/ 346-739-608 by the European Union. Additional funding was provided from Combating Arthropod Pests for Better Health, Food and Resilience to Climate Change (Norad-CAP-Africa) RAF-3058 KEN-18/0005. We also gratefully acknowledge the financial support for this research provided by the following organizations and agencies: the UK's Foreign, Commonwealth & Development Office (FCDO); the Swedish International Development Cooperation Agency (Sida); the Swiss Agency for Development and Cooperation (SDC); the Federal Democratic Republic of Ethiopia and the Government of the Republic of Kenya and The Centre for International Migration and Development (CIM).
Conflict of interest
None.
Ethical standards
We collected blood samples within the framework of epidemiological surveillance activities, in accordance with the International Centre of Insect Physiology and Ecology's Institutional Animal Care and Use Committee (IACUC) guidelines, in accordance with protocols approved by the International Centre of Insect Physiology and Ecology's Institutional Animal Care and Use Committee (IACUC) guidelines (approval number: icipe-IACUC-10/2018.1).
Data availability
All data generated or analysed in this study are included in the article and as Supplementary files.


