INTRODUCTION
Recent molecular studies highlighted the need to re-address parasite taxonomy previously based on traditional morphological approaches (Williams et al. Reference Williams, Ormerod and Bruford2006; Smith et al. Reference Smith, Wood, Janzen, Hallwachs and Hebert2007; Ståhls and Savolainen, Reference Ståhls and Savolainen2008; Perkins et al. Reference Perkins, Martinsen and Falk2011; du Toit et al. Reference du Toit, Matthee and Matthee2013a , Reference du Toit, Jansen van Vuuren, Matthee and Matthee b ). This holds true especially for small-bodied invertebrates which are often characterized by a slow rate of change in morphological features (Clayton et al. Reference Clayton, Al-Tamimi, Johnson and Page2003; Huyse et al. Reference Huyse, Poulin and Theron2005; Whiteman and Parker, Reference Whiteman and Parker2005), and in the case of ectoparasites, speciation may also be subjected to evolutionary processes related to their host (Roy et al. Reference Roy, Dowling, Chauve and Buronfosse2008, Reference Roy, Dowling, Chauve and Buronfosse2010; Perkins et al. Reference Perkins, Martinsen and Falk2011; du Toit et al. Reference du Toit, Matthee and Matthee2013a , Reference du Toit, Jansen van Vuuren, Matthee and Matthee b ).
Since a comprehensive understanding of cryptic diversity is needed to better understand taxonomy and the processes generating biodiversity, most modern taxonomic studies have a total evidence approach incorporating both morphology and DNA sequencing (Bickford et al. Reference Bickford, Lohman, Sodhi, Ng, Meier, Winker, Ingram and Das2007; Morelli and Spicer, Reference Morelli and Spicer2007; Detwiler et al. Reference Detwiler, Bos and Minchella2010; Shäffer et al. Reference Shäffer, Pfingstl, Koblmuller, Winkler, Sturmbauer and Krisper2010; Skoracka and Dabert, Reference Skoracka and Dabert2010; Apanaskevich et al. Reference Apanaskevich, Horak, Matthee and Matthee2011; Knee et al. Reference Knee, Beaulieu, Skevington, Kelso and Forbes2012). Apart from providing new insights into the systematics of the taxa concerned, a thorough phylogenetic analysis can also be used to explore the mechanisms involved in parasite speciation. For example, well-resolved congruent phylogenies of a particular parasite and host system can enable co-evolutionary scenarios to be described between the complementary parasite and host lineages (Page, Reference Page1996; Morelli and Spicer, Reference Morelli and Spicer2007; du Toit et al. Reference du Toit, Matthee and Matthee2013a , Reference du Toit, Jansen van Vuuren, Matthee and Matthee b ).
The evolutionary history of ectoparasite taxa is complex. They can be structured spatially between microhabitats within individual hosts, between individuals or populations of the same host species, and between different host species (de Meeûs, Reference de Meeûs, Poulin, Morand and Skorping2000; Clayton et al. Reference Clayton, Al-Tamimi, Johnson and Page2003; Noureddine et al. Reference Noureddine, Chauvin and Plantard2011). Differences in several factors, such as life cycle, mode of transmission, interspecific competition and host specificity could result in more pronounced genetic structure in a given parasite species or population (Blouin et al. Reference Blouin, Yowell, Courtney and Dame1995; Nadler, Reference Nadler1995; Criscione and Blouin, Reference Criscione and Blouin2004, Reference Criscione and Blouin2005; Barrett et al. Reference Barrett, Thrall, Burdon and Linde2008; Cangi et al. Reference Cangi, Horak, Apanaskevich, Matthee, Das Neves, Estrada-Peña and Matthee2013) and different parasite races may even be formed as a result of disruptive selection in the host (Maynard Smith, Reference Maynard Smith1966; Bush, Reference Bush1994). However, without sufficient data, the contemporary taxonomy and evolutionary predictions for ectoparasites remain highly speculative.
In the African context, molecular investigations focusing on the taxonomy and co-evolution of mammalian ectoparasites are virtually non-existent (but see Cangi et al. Reference Cangi, Horak, Apanaskevich, Matthee, Das Neves, Estrada-Peña and Matthee2013; du Toit et al. Reference du Toit, Matthee and Matthee2013a , Reference du Toit, Jansen van Vuuren, Matthee and Matthee b ). Pertinent to the focus of the present study, regional investigations on mites of the order Mesostigmata seem to be limited to species surveys only (Hirst, Reference Hirst1925; Zumpt, Reference Zumpt1961; Matthee et al. Reference Matthee, Horak, Beaucournu, Durden, Ueckermann and McGeoch2007, Reference Matthee, Horak, van der Mescht, Ueckermann and Radloff2010; Matthee and Ueckermann, Reference Matthee and Ueckermann2008, Reference Matthee and Ueckermann2009; Viljoen et al. Reference Viljoen, Bennett, Ueckermann and Lutermann2011). Since mite studies conducted elsewhere show pronounced genetic disparity when compared with morphological traits (Morelli and Spicer, Reference Morelli and Spicer2007; Knee et al. Reference Knee, Beaulieu, Skevington, Kelso and Forbes2012), it seems reasonable to hypothesize that the current diversity of parasitic mites in southern Africa is also underestimated (also see de León and Nadler, Reference de León and Nadler2010; Nadler and de León, Reference Nadler and de Leon2011).
To gain more insights into the evolution and taxonomy of mesostigmatid mites we performed a morphological and molecular investigation on two mite species, Laelaps giganteus (Berlese, 1918) and Laelaps muricola (Träghardh, 1910). The mites belong to the subfamily Laelapinae (Mesostigmata: Laelapidae) and can be differentiated from other species in the genus by a unique opisthogenital shield with four pairs of setae on adult females (Hirst, Reference Hirst1925). Both Laelaps species are geographically widespread in sub-Saharan Africa and are reported from multiple rodent species (Hirst, Reference Hirst1925; Zumpt, Reference Zumpt1961). In addition, Zumpt (Reference Zumpt1961) hypothesized about the possibility of multiple sub-species within L. giganteus.
In this study the evolutionary history and taxonomic status of two recognized southern African Mesotigmatid mites, L. giganteus and L. muricola, was investigated using a combination of partial mitochondrial cytochrome oxidase subunit I (COI), the nuclear internal transcribed spacer 1 (ITS1) and the intron Tropomyosin (TropoM). Selected morphological characters were also included. The relative importance of host range as a contributing factor towards lineage diversification was tested by sampling multiple previously described hosts of these parasites at different localities.
MATERIALS AND METHODS
Samples collected
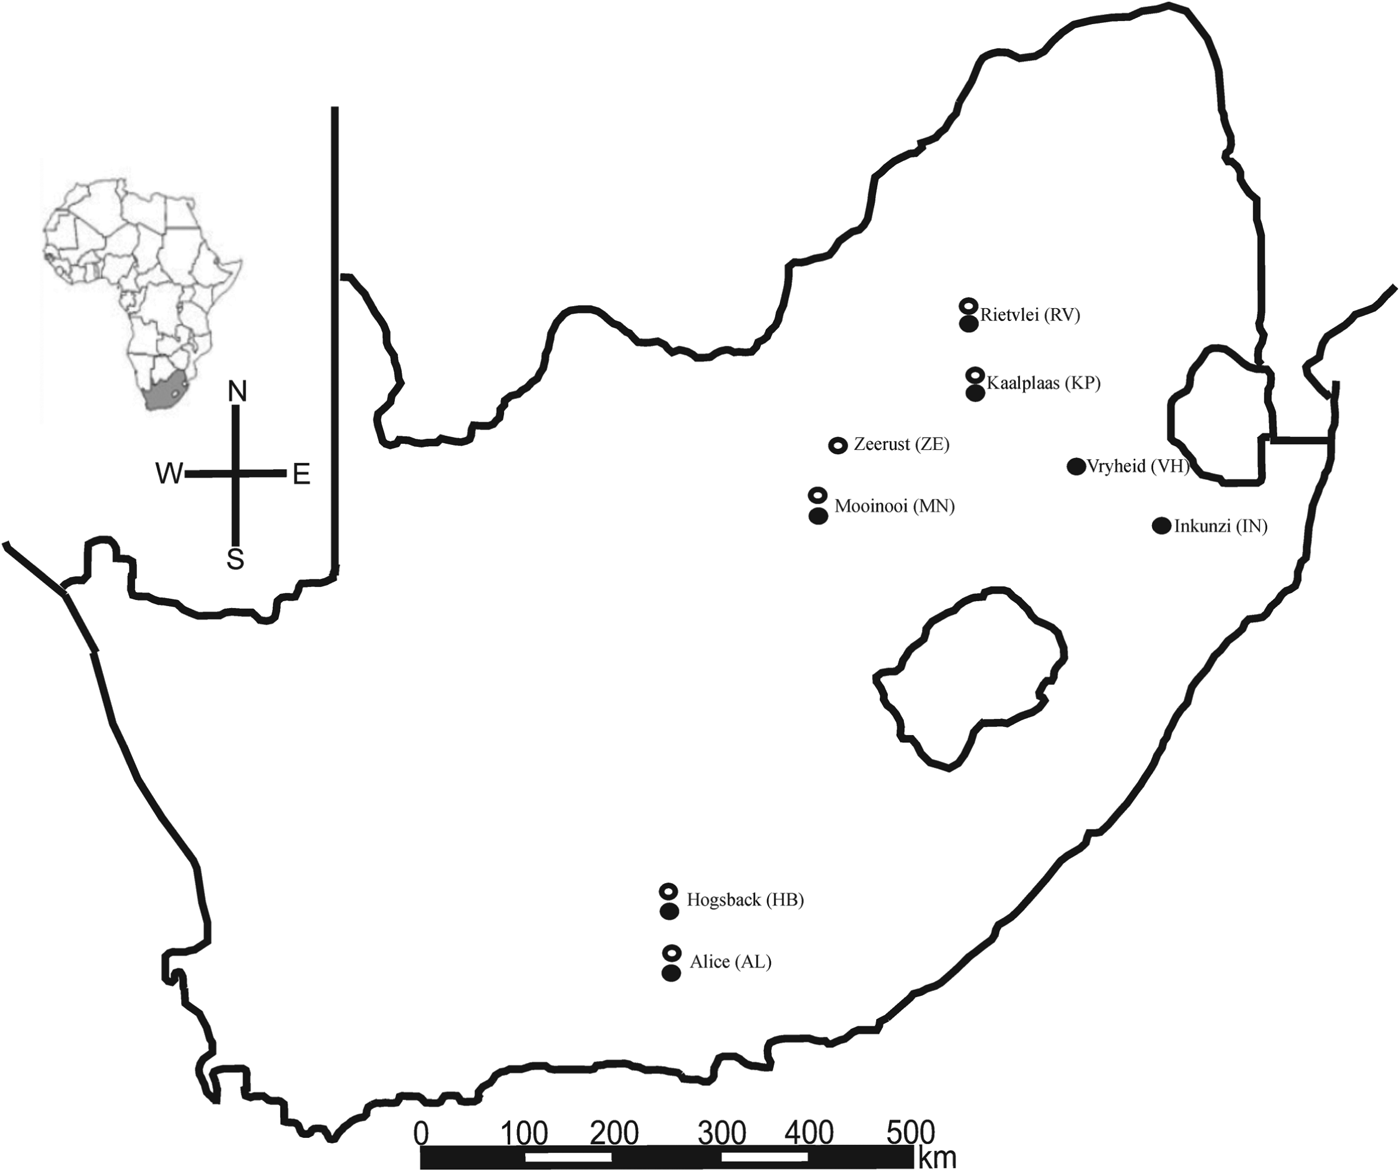
Hirst (Reference Hirst1925) and Zumpt (Reference Zumpt1961) lists the South African hosts of L. giganteus and L. muricola as being Rhabdomys dilectus, Rhabdomys pumilio, Lemniscomys rosalia, Mastomys natalensis, Dasymys incomtus (type host for L. giganteus), Aethomys chrysophilus, Micaelamys namaquensis, Saccostomys campestris, Otomys irroratus, Parotomys litteldalei, Rattus rattus and Tatera afra while several other hosts are recorded for the rest of sub-Saharan Africa. To achieve maximum host overlap at sampling sites, efforts focused on the eastern side of South Africa (see Skinner and Chimimba, Reference Skinner and Chimimba2005 for host distributions). Attempts were made to sample as many host species possible (Table 1) at eight different collection sites (Fig. 1). The mite Androlaelaps marshalii (Berlese, 1911) collected in this study from Tatera brantsii was used as an outgroup for some of the phylogenetic analyses. In instances where A. marshalii failed to amplify, the GenBank sequence of the more distantly related Dermanyssus apodis (FM897373.1) was also used as an alternative outgroup.

Fig. 1. Collection localities in South Africa from where Laelaps giganteus (filled circles) and L. muricola (open circles) were recorded.
Table 1. Collection localities, host species, total number of individuals per host species and number of host individuals that harboured either L. giganteus or L. muricola

Rodents were trapped using Sherman-type live traps that were set in trap lines (each trap 10 m apart). Trapping was done for a minimum period of 4 days (dependent on the trapping success). Adult hosts were selected for parasite screening and placed in a plastic bag and euthanized using an intra-peritoneal injection with sodium pentobarbitone (200 mg kg−1) (ethical approval for euthanasia method was granted by Stellenbosch University: SU-ACUM11-00004). Ectoparasites were obtained by brushing the pelage of the host using standard procedures (Ignoffo, Reference Ignoffo1958; Burger et al. Reference Burger, Chesh, Muñoz, Fredes, Ebensperger and Hayes2012). To prevent cross contamination between conspecific samples, brushes were cleaned with 100% ethanol after each use. Cross contamination among host species was avoided by using separate clean brushes for each host species at each site. Only female mites were selected for inclusion in the genetic analyses as there is a significant female bias on rodent hosts (1 male : 128 females per host; Matthee et al. Reference Matthee, Horak, Beaucournu, Durden, Ueckermann and McGeoch2007) and females also possess more distinct morphological characters for identification (Matthee and Ueckermann, Reference Matthee and Ueckermann2009). Mites were preserved in 100% ethanol for molecular and morphological analysis.
DNA extraction and sequencing
Total genomic DNA was extracted using a Macherey-Nagel kit (GmbH & Co.) following the protocol of the manufacturer. Whole animals were placed in the extraction buffer without grinding and digested at 56 °C for a minimum of 3 h. Individual extraction reactions were mixed every 30 min using a vortex. Following extraction, the remaining exoskeletons of all mites were stored individually and used for the morphological component of the study (see below). Extracted DNA was stored at −20 °C and later thawed for PCR use.
Universal primers LCO1490 and HCO2198 of COI were used to amplify 708 base pairs (bp) of the gene (Folmer et al. Reference Folmer, Black, Hoeh, Lutz and Vrijenhoek1994). Also, two nuclear genes were included in this study namely ITS1, for which 700 bp were amplified using the primers described in Roy et al. (Reference Roy, Dowling, Chauve and Buronfosse2008) and TropoM for which 570 bp were amplified as described in Roy et al. (Reference Roy, Dowling, Chauve and Buronfosse2010).
All PCR reactions were optimized and carried out using 25 μL reaction volumes with a GeneAmp® PCR system 2700 thermal cycler (Applied Biosystems). COI regions were amplified via a ‘cold start’ reaction consisting of a denaturation cycle of 1 min at 95 °C followed by a 10-cycle loop of 1 min at 95, 45 and 72 °C, respectively. A 30-cycle loop was then followed using the exact same conditions apart from increasing the 45 °C annealing temperature to 59 °C. All reactions were ended off by a final 5 min extension period at 72 °C. PCR conditions for ITS1 and TropoM followed Roy et al. (Reference Roy, Dowling, Chauve and Buronfosse2010) with annealing temperatures of 49 and 54 °C, respectively. After amplifications, 5 μL of the PCR products were visualized on a 1% agarose gel. The remainder of the PCR product was purified with a NucleoFast 96 PCR kit (Macherey-Nagel). Cleaned products were then cycle sequenced using BigDye Chemistry and analysed with an ABI 3730 XL DNA Analyzer (Applied Biosystems, Inc.).
Sequence processing and alignment
Sequences were authenticated using the BLASTN tool on GenBank (http://blast.ncbi.nlm.nih.gov/Blast.cgi) and the mtDNA sequences were also translated to amino acids with the online tool EMBOSS/Transec (www.ebi.ac.uk/Tools/emboss/transeq/index.html). All usable sequences were manually aligned and edited using BioEdit Sequence Alignment Editor v. 7.0.9 (Hall, Reference Hall2005). To avoid the inclusion of missing data and ambiguities, small end sections of the sequences were truncated.
Phylogenetic analyses
Phylogenetic relationships among individuals sequenced were firstly inferred using maximum parsimony (MP) in PAUP* v4.0b10 (Swofford, Reference Swofford2002). A heuristic search was run following the tree bisection-reconnection branch exchange method (TBR) with all characters assigned equal weights and unordered. Stability of the nodes on the MP tree was assessed with bootstrapping using 1000 re-sampling pseudo-replicates and the TBR method. Bootstrap values above 75% were considered well supported while bootstrap values below 75% were considered poorly supported (Felsenstein, Reference Felsenstein1985). Using the program JModeltest v. 2.1.2 (Guindon and Gascuel, Reference Guindon and Gascuel2003; Posada, Reference Posada2008) and the Akaike information criteria (AIC), the best-fit model of evolution was determined for each gene fragment (Akaike, Reference Akaike, Petrov and Csaki1973; Nylander, Reference Nylander2004). Using the latter as a guide for prior input, Bayesian analysis were performed in MrBayes v. 3.2 (Ronquist and Huelsenbeck, Reference Ronquist and Huelsenbeck2003), including five parallel Monte Carlo Markov chains. A total of five million generations were used while the chains were sampled every 100th generation. The generated samples were summarized with the sump command in MrBayes to determine statistical stationarity and based on these results 25% were discarded as burn-in. The PSRF (potential scale reduction factor) value was also used to assess whether the data were adequately sampled (Rambaut and Drummond, Reference Rambaut and Drummond2007). The sumt command in MrBayes was used to obtain statistical support values for the nodes on the trees. Trees were then visualized with the program FigTree v. 1.2.2 (http://tree.bio.ed.ac.uk/software/gtree/). Nodes with posterior probabilities (P)<0·95 were considered not significantly supported. After individual analyses, a concatenated dataset was created and analysed using Parsimony (as described above) and Bayesian analyses in a partitioned fashion for each gene fragment (COI, ITS1 and TropoM). The latter Bayesian analysis was run for 22 million generations (until the s.d. of split frequencies were below 0·01) including 58 representative specimens for which all three gene complements were available.
In order to also incorporate population level processes, the individual genes were also analysed in SplitsTree v. 4.5 (Huson and Bryant, Reference Huson and Bryant2006). For each gene, uncorrected P distances were used to draw a neighbour-net network (Bryant and Moulton, Reference Bryant and Moulton2004), using equal angle splits to present the relationships (Dress and Huson, Reference Dress and Huson2004).
Morphological analysis
All specimens sequenced were mounted in Heinze-PVA medium following the protocol stipulated in Matthee and Ueckermann (Reference Matthee and Ueckermann2009). Following the key of Evans and Till (Reference Evans and Till1979), 14 morphologically diagnostic characters were recorded (Table 2) and measured in micrometres using a Zeiss Axioscope Research microscope (Zeiss). Laelaps giganteus has a genital plate that is distinctly separate from the anal shield and is narrower relative to other species within the genus (especially L. muricola). The venter is inundated with short stout setae. Trochanter I has one spine and five small setae. Coxa I has one spine and one spine-like seta while coxae II–III each has two spines and coxa IV one spine (Hirst, Reference Hirst1925). In contrast, L. muricola has a smooth and fairly wide heart-shaped genital plate extending greatly behind the hind legs. Hairs on the venter are numerous, thick and longer than those of L. giganteus (Hirst, Reference Hirst1925). Trochanter I has six small setae, coxae II–III each with one spine and one acute and stout seta and coxa IV with one small spine. Morphological measurements were analysed with a ZEN Imaging Software system (Zeiss). To test for a significant size difference between specimens, 9–10 individuals from each genetic lineage were measured for all characters and the mean was calculated for each. To exclude the effects of missing measurements on the principal component analysis, the data for each measured character group was mean centred. This was done by determining the mean for each character group and deducting those values from each data point in the character group and dividing the subsequent value by the s.d. of the particular variable. The mean centred data were then normalized in the open source software program GNU Octave (www.gnu.org/software/octave/) in order to assign the same weight to each character. The first component (PC1) gave information on how samples differed from each other while the second component (PC2) showed how variables relate to each other.
Table 2. The morphological characters measured for three Laelaps lineages in micrometres following the nomenclature of Evans and Till (Reference Evans and Till1979) a

a Zeros in the table indicate that the particular appendage broke during DNA extraction and could not be measured.
RESULTS
Host and parasite demographics
By sampling eight localities, 228 specimens were collected from 10 different potential host species (Table 1). Of the 10 different Muridae host species that were collected only four carried the mites of interest (Table 1). The four-striped grass mouse, R. dilectus was the most common host collected at all sampling sites (with the exclusion of Zeerust). Based on morphology L. giganteus was only recorded from R. dilectus and the single-striped grass mouse, L. rosalia (Table 1). Laelaps muricola were collected at six localities from two host species, namely the Southern multimammate mouse, M. coucha, and the Namaqua rock mouse, M. namaquensis (Table 1). The remaining hosts were predominantly infested with mites belonging to the genus Androlaelaps. These findings do not deviate significantly from that reported by Matthee et al. (Reference Matthee, Horak, Beaucournu, Durden, Ueckermann and McGeoch2007).
Gene sequence characteristics
Attempts were made to sequence 84 Laelaps specimens for the COI locus, ITS1 and TropoM regions. We were successful in obtaining sequences for all specimens for COI and ITS1, but despite numerous attempts only managed to get 58 sequences for the TropoM gene (GenBank accession numbers: COI: KF805772–KF805856; ITS1: KF805857–KF805940; TropoM: KF505941–KF805998). Sampling data corresponded to the two morphologically recognized species L. giganteus (N = 40) and L. muricola (N = 44), respectively (Table 1). JModeltest selected the GTR+G model as the best-fit model of substitution for all three gene fragments. A total of 644 bp were analysed for the COI region and excluding the outgroup, this resulted in 522 (81·05%) invariant and 105 (16·30%) parsimony informative characters. The ITS1 region presented 468 base pairs, of which 382 (81·62%) were invariant and 47 (10·04%) parsimony informative while TropoM produced 464 useable base pairs, of which 384 (82·75%) were invariant and 44 (9·48%) parsimony informative characters.
Pair-wise divergence and phylogenetic reconstructions
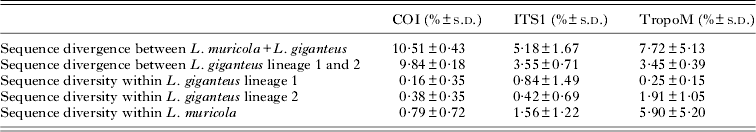
Bayesian and Parsimony analyses of the COI data revealed the existence of at least three monophyletic lineages (Fig. 2a). The three lineages support the distinction between the morphologically recognized L. muricola and L. giganteus and furthermore provide strong evidence for the existence of at least two genetic lineages within L. giganteus (Fig. 2a). The three genetic lineages are separated by between 9·84–10·51% mtDNA sequence divergence and 3·55–7·72% nuclear DNA divergence (Table 3). The distinctions of the three genetic clades are supported by intra-lineage sequence divergences that, apart from TropoM were markedly lower than inter-lineage sequence divergences (Table 3).

Fig. 2. (a) Bayesian phylogeny indicating the three major clades retrieved from the COI dataset. The two cryptic lineages within L. giganteus are indicated as L. giganteus lineage 1 and L. giganteus lineage 2, with L. muricola grouped sister to L. giganteus lineage 2. (b) Laelaps Neighbour-Net phylogenetic network of the ITS1 dataset indicating the three major groupings recovered in the COI phylogeny (labelled as such). Ambiguous signal and conflicts are indicated by multiple connections. (c) Laelaps Neighbour-Net phylogenetic network of the TropoM dataset indicating the three major groupings recovered in the COI phylogeny (labelled as such). Ambiguous signal and conflicts are indicated by multiple connections.
Table 3. Pair-wise genetic divergence values within and between the described Laelaps lineages

Parsimony and Bayesian analyses of the ITS1 data consistently support the recognition of the two recognized species, but analyses based on TropoM were unresolved (data not shown). This result is best illustrated by the Neighbour-net network analyses of the faster-evolving ITS1 data (Fig. 2b) when compared with the mixed signals obtained for TropoM (Fig. 2c). Combining the data in a single matrix provided robust support for the two recognized species but due to the TropoM data failed to support the strict monophyly of the two L. giganteus lineages (combined analyses not shown).
Morphological analysis
Morphological measurements of N = 29 mites originating respectively from each of the three clades (Fig. 2a and b) showed strong morphological differentiation between L. giganteus and L. muricola but show a large overlap in range sizes for all morphological characters that were measured for the two L. giganteus lineages (Table 2; Fig. 3a). A test of explained variance showed that more than 95% of the data was described by the first and second principal components. Comparing only the samples from the two genetic lineages in L. giganteus showed that no single component described the data; adding support to the finding that these two lineages are possibly cryptic species (Fig. 3b).

Fig. 3. (a) Principal component analysis of morphological characteristics recorded for the three Laelaps lineages. L. giganteus lineage 1 (N = 10) (diamond shapes) and L. giganteus lineage 2 (N = 9) (open triangles) and L. muricola (N = 10) (filled circles). (b) Principal component analysis of morphological characteristics recorded for two L. giganteus lineages. L. giganteus lineage1 (diamond shapes) and L. giganteus lineage 2 (open triangles).
DISCUSSION
The current study provides: (i) novel genetic data to support the currently recognized L. giganteus and L. muricola as distinct species; (ii) new insights into host range of L. giganteus and L. muricola in South Africa; and (iii) the first published genetic evidence for cryptic speciation in a mesostigmatid mite occurring in southern Africa. In concert, these findings allow for new insights into the taxonomy and evolution of L. giganteus and L. muricola. Broadly this study also contributes towards the global need for more investigations examining parasite biodiversity (de León and Nadler, Reference de León and Nadler2010).
The marked genetic differentiation between the two recognized species based on mtDNA and nuclear DNA data confirm the original morphological distinction between the two Laelaps species (Hirst, Reference Hirst1925). With the exception of some evidence (paraphyletic clustering for the TropoM dataset), phylogenetic analyses of all remaining datasets (together with the morphological measurements) support this taxonomic division. Contrary to published findings (Hirst, Reference Hirst1925; Zumpt, Reference Zumpt1961), these two species also seem to be ecologically differentiated based on host preferences. Laelaps giganteus was absent on eight of the 10 possible host species but instead was only recorded on Arvicanthini rodents, while L. muricola seems to be more of a rodent generalist but was never found on Rhabdomys. This absence of L. muricola on Rhabdomys is seemingly not seasonally influenced (see Matthee et al. Reference Matthee, Horak, Beaucournu, Durden, Ueckermann and McGeoch2007) and the host specificity is furthermore also in agreement with previous diversity studies based on much larger sample sizes (Matthee et al. Reference Matthee, Horak, van der Mescht, Ueckermann and Radloff2010; Froeschke et al. Reference Froeschke, van der Mescht, McGeoch and Matthee2013).
The most prominent finding of this study was the discovery of genetically differentiated clades within L. giganteus that are morphologically similar. These two lineages form well-supported monophyletic clades when two (COI and ITS1) of the three gene trees are considered and these lineages are separated by a mtDNA sequence divergence value of 9·84% (10·51% separate L. giganteus and L. muricola; it is also comparable to species level distinctions in other mesostigmatid mites; Roy et al. Reference Roy, Dowling, Chauve and Buronfosse2008, Reference Roy, Dowling, Chauve and Buronfosse2010; Knee et al. Reference Knee, Beaulieu, Skevington, Kelso and Forbes2012). Several factors can be put forward as to why the third genetic dataset (TropoM) did not recover the same monophyletic conclusions. Among these, the possible retention of ancestral polymorphisms cannot be discarded as a potential explanation and it is also possible that hybridization between individuals of the two species, and/or individuals belonging to the two L. giganteus lineages, could have resulted in some allele sharing at some loci (Ballard and Whitlock, Reference Ballard and Whitlock2004; Felsenstein, Reference Felsenstein2004; Maddison and Knowles, Reference Maddison and Knowles2006; Degnan and Rosenberg, Reference Degnan and Rosenberg2009; du Toit et al. Reference du Toit, Jansen van Vuuren, Matthee and Matthee2013b ). It is prudent that more genetic data are needed before a firm conclusion can be reached to explain the conflict in the TropoM data.
A concrete taxonomic revision is not possible at this stage since the samples reviewed in this study cover only a small area of the overall distribution of the formerly described L. giganteus (Hirst, Reference Hirst1925; Zumpt, Reference Zumpt1961). A second confounding difficulty with a revised taxonomy is that the type specimen for L. giganteus was described from Dasymys incomptus which was collected in Pulima, Ghana, West Africa (Zumpt, Reference Zumpt1961). Unfortunately, despite several attempts to sample D. incomptus locally, no host specimens could be retrieved in the present study. If the genetic pattern obtained for Laelaps can be seen as indicative for the entire species, then it is quite likely that L. giganteus sampled on D. incomptus may in fact also represent a distinct cryptic lineage, and this lineage will then have priority in name. What makes a proper taxonomic assessment also problematic is the fact that only the range of R. dilectus was sampled in the present study (which spans the mesic eastern side of South Africa; Skinner and Chimimba, Reference Skinner and Chimimba2005; Mucina and Rutherford, Reference Mucina and Rutherford2006). Previous studies indicate that L. giganteus is commonly found on R. pumilio also (occurring along the xeric western regions of South Africa; Matthee et al. Reference Matthee, Horak, Beaucournu, Durden, Ueckermann and McGeoch2007) but at least four distinct Rhabdomys species exist in the region (du Toit et al. Reference du Toit, Jansen van Vuuren, Matthee and Matthee2012). Several sibling species have also been described in D. incomptus based on chromosomal rearrangements (Volobouev et al. Reference Volobouev, Sicard, Aniskin, Gautun and Granjon2000). Given the narrow host range observed for L. giganteus in the present study, it is quite plausible that L. giganteus (senso stricto) may harbour significantly more cryptic diversity than is currently recognized. In turn the pattern presented in this study is also consistent with global trends suggesting that mites previously described as one species often harbour multiple cryptic lineages tightly linked to a primary host (Morelli and Spicer, Reference Morelli and Spicer2007; Roy et al. Reference Roy, Dowling, Chauve and Buronfosse2008; Shäffer et al. Reference Shäffer, Pfingstl, Koblmuller, Winkler, Sturmbauer and Krisper2010; Skoracka and Dabert, Reference Skoracka and Dabert2010; Martin et al. Reference Martin, Dabert and Dabert2010; Knee et al. Reference Knee, Beaulieu, Skevington, Kelso and Forbes2012).
In the present study we find strong evidence to suggest that host evolution played some role in the evolution of these ectoparasites since both L. giganteus lineages seem to follow a lifestyle reminiscent of a host-specific parasite (the two clades also showed strong host exclusivity independent of geography). This holds despite the fact that 10 different host species of this parasite were collected in partial sympatry. Unfortunately, our taxonomic sampling of hosts is not sufficient to make strong co-evolutionary conclusions but it is interesting to note that the average mtDNA and nuclear DNA sequence distances suggest a closer relationship between the two L. giganteus lineages. Along these lines, the hosts of the two L. giganteus lineages (R. dilectus and L. rosalia) detected in this study are also phylogenetically closely related in the ‘Arvicanthini’ group of Muroid rodents (Watts and Baverstock, Reference Watts and Baverstock1995; Ducroz et al. Reference Ducroz, Volobouev and Granjon2001; Steppan et al. Reference Steppan, Adkins, Spinks and Hale2005). Some molecular evidence also suggests that the type host of L. giganteus, D. incomptus, is basal to the Arvicanthini rodents (Ducroz et al. Reference Ducroz, Volobouev and Granjon2001). Contrasting to the pattern observed in L. giganteus, L. muricola was recorded on M. coucha (grass/plain dwelling rodent) and M. namaquensis (preferring rocky habitats). In support of the more generalist lifestyle, no interspecific genetic structure was recorded in this species despite the fact that one of its preferred hosts, M. namaquensis, has also been shown to contain at least two divergent genetic clades in the region covered by our study (Chimimba, Reference Chimimba2001; Russo et al. Reference Russo, Chimimba and Bloomer2010).
Although our findings contribute significantly towards a better understanding of the biology of Laelapinae mites, our study highlights the need for more fine-scale sampling across a larger geographic region. Pertinent to such a study would be to include D. incomptus and also the four ecologically differentiated Rhabdomys species (du Toit et al. Reference du Toit, Jansen van Vuuren, Matthee and Matthee2012), since if the species specificity of L. giganteus holds, several more undetected lineages may exist.
ACKNOWLEDGEMENTS
Private landowners as well as several nature conservation agencies are thanked for awarding us permission to conduct our research under the following permit numbers (Eastern Cape, CRO37/11CR; KZN wildlife OP4990/2010; and Gauteng CPF 6-0153). The following people are also thanked for field assistance and providing some of the samples used in this study: Nina du Toit, Luther van der Mescht, Götz Froeschke, Leigh Richards and Andrea Spickett. A special thanks to Fernando Nieuwveldt for help with the principal component analysis.
FINANCIAL SUPPORT
Financial support for this study was provided by the South African National Research Foundation (NRF), Stellenbosch University and Deutsche Forschungsgemeinschaft Grant awarded to Dr S. Matthee (NRF – UID 65744).