


INTRODUCTION
Variation in the number and frequency of transmission events from infected to susceptible hosts can profoundly alter the initial rate of spread and the subsequent equilibrium prevalence of infectious diseases (Anderson and May, Reference Anderson and May1991). Empirical studies have shown that the majority of transmission events take place within a small minority of the population (e.g. Perkins et al. Reference Perkins, Cattadori, Tagliapietra and Hudson2003), and that the number of secondary cases of infection that originate in the population are attributed to a few infectious individuals that lie beyond the expectations of a random distribution (Lloyd-Smith et al. Reference Lloyd-Smith, Schreiber, Kopp and Getz2005). In many of these systems we do not know why these individuals are responsible for so many transmission events. This could be because the infectious hosts have many more contacts with susceptible hosts, or because they spread more infectious ‘particles’ than others. To tease apart these hypotheses we need data on the heterogeneity of potential transmission contacts between hosts. Owing to the paucity of detailed data, a large proportion of mathematical models of disease dynamics assume that all infectious individuals have equal probability of causing a transmission event. Whilst this assumption has not prevented mathematical epidemiologists from gaining insight into the dynamics of infectious diseases (e.g. measles, Keeling and Grenfell, Reference Keeling and Grenfell1997; Earn et al. Reference Earn, Rohani, Bolker and Grenfell2000), there is a need for understanding how individual variation in transmission influences both transient and long-term parasite dynamics (Meyers, Newman and Pourbohloul, Reference Meyers, Newman and Pourbohloul2006; Bansal, Grenfell and Meyers, Reference Bansal, Grenfell and Meyers2007).
Heterogeneity in transmission can occur due to assortative mixing, where individuals tend to associate with others similar to them, creating sub-groups within a social network. This selective mixing allows parasite transmission to become pervasive in one sub-group and not in others by limiting the transmission of the pathogen within those sub-groups (Morris, Reference Morris and Mollison1995; Garnett and Anderson, Reference Garnett and Anderson1996; Eames, Reference Eames2007). For example, in the spread of HIV, the type of sexual partners tend to be stratified according to sexual activity and ethnicity (Barlow, Daker and White, Reference Barlow, Daker and White1997), such that initial infections spread quickly with a high basic reproduction number (R 0) but there is a limited spread between groups and the overall prevalence is lower than expected with random mixing (Eames, Reference Eames2007). The dynamic consequence of parasite transmission on an assortative (like-with-like) network is that the infection is less pervasive but more resilient to control interventions owing to the presence of sub-groups. On the other hand, dissasortative (like-with-unlike) mixing tends to result in an epidemic that is more diffuse across the network, but more responsive to targeted control – if super-spreaders can be identified (Newman, Reference Newman2002, Reference Newman2003). It is clear that the level of assortativity in host mixing is an important source of heterogeneity the quantification of which could give us relevant insight into the dynamics of infection within a population.
Not only are transmission contacts heterogeneous in social populations (Woolhouse et al. Reference Woolhouse, Dye, Etard, Smith, Charlwood, Garnett, Hagan, Hii, Ndhlovu, Quinnell, Watts, Chandiwana and Anderson1997; Lloyd-Smith et al. Reference Lloyd-Smith, Schreiber, Kopp and Getz2005), but also heterogeneities in intrinsic factors including host immune response, co-infections and host behaviour can all affect the shedding rate of infectious particles (See Wilson et al. Reference Wilson, Bjørnstad, Dobson, Merler, Poglayen, Randolph, Read, Skorping, Hudson, Rizzoli, Grenfell, Heesterbeek and Dobson2002 for a review). Empirical studies have identified a male host-bias in the prevalence of parasitic infection, which is particularly pronounced amongst macroparasitic helminths that infect mammals (Poulin, Reference Poulin1996; Moore and Wilson, Reference Moore and Wilson2002). This male-bias in prevalence implies that males produce a higher net number of infectious stages than females and consequently transmission is male-biased, a process not caught by mean-field mixing models unless the process considers each sex independently (for an example of a sex-structured model that captures the differences in infection between males and females with host age due to heterogeneous, sex- and age-dependent exposure in a macroparasite see Filipe et al. Reference Filipe, Boussinesq, Renz, Collins, Vivas-Martinez, Grillet, Little and Basáñez2005).
Interestingly, even when the sex-specific infection prevalence is approximately equal a strong sex-bias in transmission has been observed. For example, in a population of wild rodents Ferrari et al. (Reference Ferrari, Cattadori, Nespereira, Rizzoli and Hudson2004) recorded male mice (Apodemus flavicollis) having a negligibly higher prevalence (by 2%) than females of the gastrointestinal macroparasite Heligmosomoides polygyrus, but a clear male sex-bias in transmission. Removal of the helminth from the females, using anthelmintic treatment, had no effect on the prevalence or shedding intensity of the helminth infective stages in the males, but treating the males significantly reduced prevalence in females (Ferrari et al. Reference Ferrari, Cattadori, Nespereira, Rizzoli and Hudson2004). These findings implied that male mice contribute more to transmission than expected from the prevalence observed and that transmission in this host-parasite system is strongly male biased.
Given this source of heterogeneity in macroparasite transmission in this system, we aimed to determine whether the observed population level prevalence of H. polygyrus was a function of contacts between male and female mice (assortativity), and/or determined by differing strengths of sex-biased transmission. Using data from the same field sites and same system, A. flavicollis (Rodentia: Muridae) – H. polygyrus (Nematoda: Heligmosomatidae) as Ferrari et al. (Reference Ferrari, Cattadori, Nespereira, Rizzoli and Hudson2004), we investigated contact networks of rodent interactions and from these quantified the degree of male-male, female-female and mixed-sex contacts. Using a discrete time Susceptible-Infected (SI) model framework, we simulated helminth transmission on the empirically-derived networks. Using the model, we increased the level of male-biased transmission to determine whether increasing strengths of male-biased transmission could capture the empirical dynamics observed for this macroparasite. If sex-biased transmission were not important in driving macroparasite dynamics, then we would expect the prevalence of the macroparasite to be independent of the strength of sex-biased transmission. Additionally, if assortative mixing patterns among the mice (rather than sex-biased transmission) were important, then empirical macroparasite prevalence would be captured when the model assumed no sex-bias in transmission.
MATERIALS AND METHODS
Study area and live-trapping
Replicated populations of small mammals were monitored in mixed broadleaf woodland in the north-eastern Italian Alps, where the yellow-necked mouse, Apodemus flavicollis, was the only rodent species. We carried out Capture-Mark-Recapture (CMR) trapping sessions for two consecutive nights every two weeks. Live-trapping was carried out on 6 replicated trapping grids, of a square lattice design, with 8 by 8 traps (64 traps per grid). Trapping was conducted over a period of 6 months from May to October 2000, consisting of 14 trapping sessions. Within some trapping sessions the sex of the animal was not recorded for all animals, which prevented calculation of an assortativity index. These were excluded from analyses, which reduced the potential number of trap sessions used from 78 to 50. In 2001, the recorded prevalence of the parasitic nematode H. polygyrus in the rodent population was equal to 61% in males and 58% in females, with an equal number of males and females in the population so the sex ratio of infection was observed to be balanced (Ferrari et al. Reference Ferrari, Cattadori, Nespereira, Rizzoli and Hudson2004).
The traps used were multiple capture live-traps (Special Mouse 2, Ugglan, Grahnab, Sweden), set with a 15 m inter-trap distance such that the entire trapping grid covered 1·8 ha. Each individual caught was uniquely identified using a Passive Induced Transponder tag (Trovan ID 100, Ghislandi and Ghislandi, Covo (BG), Italy).
Defining potential transmission events
We defined a potential transmission event as the presence of a susceptible individual at a location where we estimated a free-living infective stage of H. polygyrus could be present, according to the previous presence of an infected individual that was shedding eggs. We constructed association matrices of contacts (i.e. who could have transmitted to whom); these are parasite-specific, since the development time of the free-living stages determines the temporal resolution of the data and so the structure of the transmission network (Cross et al. Reference Cross, Lloyd-Smith, Bowers, Hay, Hofmeyr and Getz2004). The macroparasite, H. polygyrus is a directly-transmitted nematode; eggs leave the host in faeces, hatch and develop through to third stage infective larvae after approximately 7 days. The temporal resolution of a contact was therefore defined according to the time point when the infective stages could be picked up passively by an individual as it utilizes space and then ingested during grooming or via contaminated food (Hernandez and Sukhdeo, Reference Hernandez and Sukhdeo1995; Anderson, Reference Anderson2000).
We defined the spatial aspect of a potential transmission contact as an individual caught in the same trap or in a directly adjacent trap (traps were 15 m apart) as another individual. Rodents deposit faeces as they move around their home range and susceptible individuals become infected when they passively pick up infective stages so that the transmission likelihood is a function of space sharing (Randolph, Reference Randolph1973, Reference Randolph1977). We have made two assumptions for a transmission contact: (1) Radio-tracking studies in this mice population have shown that the animals tend to utilize the immediate area surrounding traps in which they are caught (Stradiotto, unpublished PhD thesis). As such, individuals caught in adjacent traps within trapping sessions were assumed to have been using the same space and so formed a potential transmission contact; and (2) Temporally, a transmission relevant contact occurred when individuals shared space within a trapping session (14-day time-period) when the infective L3 larval stage will have developed from the eggs of an infected host (Keymer, Reference Keymer1986; Gregory, Keymer and Clarke, Reference Gregory, Keymer and Clarke1990). H. polygyrus eggs do not survive desiccation and therefore contacts are assumed not to occur if space sharing occurs over more than one trapping session (i.e. 14 days) apart.
Transmission network analysis
An association matrix was constructed for every observation session where details of the sex of each individual were recorded, for each of the replicated trapping grids, resulting in 50 matrices. Each matrix has a network of n nodes (individual rodents), where the dimensions are n by n matrix with binary entries indicating whether there is a potential transmission contact between two nodes (i, j) and a node's degree (k) is the number of edges (or contacts) that were estimated according to the spatial–temporal resolution described above. Each network consists of nodes (individual mice) that are linked by edges (transmission relevant contact for H. polygyrus), defined by space-sharing, to one or more other individuals of known sex.
We estimated an index of assortativity based on the sex of the rodent which was characterized by a quantity eij, which represents the fraction of edges on a network that connect a vertex of single sex (i) to mixed sex (j). The edges of the network were undirected such that contacts were two-way and the adjacency matrix was symmetric, i.e. transmission from individual i, j was equal to j, i. As such, either of the individuals could be infected and the infective stages could be transmitted between them in a space-sharing situation. We calculated the assortativity index (r) according to the following equation (see Newman, Reference Newman2003; Lusseau and Newman, Reference Lusseau and Newman2004),
which translates as the fraction of ties (e) between males (m) and females (f)
The assortativity index (r) produced values between −1 and +1, (analogous to a Pearson correlation between two continuous variables) where −1 is perfect dissasortative mixing, where all associations are of mixed sex and +1 is perfect assortative mixing, where all associations are of the same sex. A value of 0 represents a mid-range where mixing is random, or neutral. A generalized linear model (GLM) with appropriate error distribution was used to determine whether the level of assortativity depended upon the mean size of the network (mean number of individuals in each of the replicated grids), time (month), the contact rate or the trapping grid. Statistical significance was set at a P value <0·05.
All statistical analyses were performed using the R program (R version 2.5.0, 2007) with network analyses performed using ‘Statnet for R’ (Handcock et al. Reference Handcock, Hunter, Butts, Goodreau and Morris2003).
Simulating macroparasite transmission
We simulated a macroparasite epidemic on the empirically-derived transmission networks using a discrete time, chain binomial (Bailey, Reference Bailey1957), Susceptible-Infected (SI) mathematical model. At each time step, nodes were characterized as susceptible or infectious. Susceptible nodes became infected in the next time step with binomial probability ![]() where the sum was taken over infected (I) neighbours to whom the susceptible node was connected and βsex was the sex-specific transmission rate for those neighbours. Based on the empirical results of the assortativity index we simulated macroparasite transmission in the population. Statistical analyses of these results found that the assortativity index remained constant over time and so we randomly chose empirically-derived networks from each of the months sampled resulting in six different networks on which we chose to simulate macroparasite dynamics. This was done to determine whether the resulting dynamics would be consistent, because even though the assortativity index was constant, other network properties and structure may change over time affecting the dynamics of macroparasite infection.
where the sum was taken over infected (I) neighbours to whom the susceptible node was connected and βsex was the sex-specific transmission rate for those neighbours. Based on the empirical results of the assortativity index we simulated macroparasite transmission in the population. Statistical analyses of these results found that the assortativity index remained constant over time and so we randomly chose empirically-derived networks from each of the months sampled resulting in six different networks on which we chose to simulate macroparasite dynamics. This was done to determine whether the resulting dynamics would be consistent, because even though the assortativity index was constant, other network properties and structure may change over time affecting the dynamics of macroparasite infection.
The simulations were run under different scenarios; first under the null hypothesis that there was no host sex-bias in macroparasite transmission, where βm=βf, followed by simulations with both lower and higher strengths of male-bias in the transmission rate. The average transmission rate (β) was kept at a constant value of 0·02 day−1. This value represents the average number of infective stages ingested and establishing per day in a susceptible host, chosen because it gave rise to epidemics of realistic magnitude. The strength of the male host-bias in transmission was such that the overall transmission rate in the population remained constant, but the relative strength of the male versus the female transmission rate changed according to the following equation,
where βf, is the female transmission rate, βm is the male transmission rate and c is a constant representing the strength of the male-biased transmission relative to that of the females. This constant ranged from zero to ten, such that when c=0, transmission was entirely female-biased, when c=1 male and female transmission were equal (i.e. no sex-bias in transmission), as c>1 transmission becomes increasingly male-biased, and when c=10 the male-biased transmission is 10 times greater than that of the females.
We ran each simulation for a period of 100 days to simulate the average lifespan of A. flavicollis in our empirical system and to provide the same time-scale as the empirical observations. Additionally, the time-scale of the simulations was restricted to within a rodent cohort because it is not fully understood how births and deaths affect network connectivity. The time-step of each simulation was one day because individuals that were caught between trapping sessions were assumed to have been overlapping in space use on a daily basis. The simulation was repeated by seeding the epidemic stochastically from a node (individual rodent) and running it 1000 times for each network. We produced an average epidemic curve for each simulation, illustrating the macroparasite prevalence for differing strengths of male-biased transmission after 100 days. We assumed that infection was chronic and egg shedding occurred for life, i.e. there was no acquired or sterilizing immunity (Wakelin, Reference Wakelin1985), and that there was no strong density dependence in egg production rates (Gregory et al. Reference Gregory, Keymer and Clarke1990). We used this model to simulate macroparasite prevalence by varying the strength of macroparasite transmission between the mice sexes, which was used to emulate variation in shedding of the macroparasite infective stages between the sexes.
RESULTS
Variation in the transmission network
The mean size of the network, specifically the mean number of individuals in a network, changed over time, with smaller networks occurring in May (mean size of 17·09+/− s.e. 1·52), reaching the highest sizes in August (mean of 29·08+/− s.e. 0·76), when the rodent population typically reaches its peak density, reducing again to smaller sizes in October (See Fig. 1 for an example).
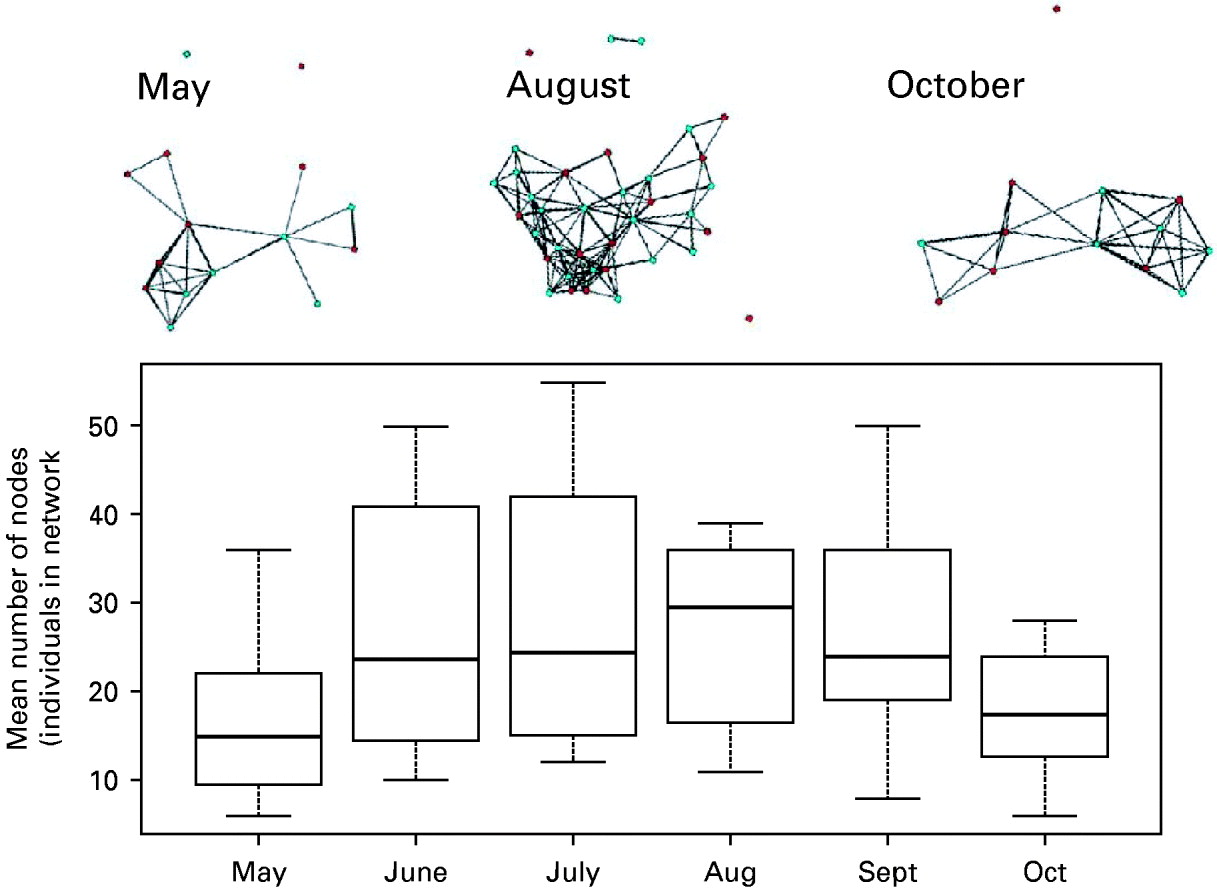
Fig. 1. Boxplot of the seasonal changes in the mean size of the transmission networks across time. The mean number of nodes (individuals) vary with time and are represented for each month as a mean value (horizontal bar), with the extreme values represented by the edge of the whisker and the 95% confidence limits as the outline of the box. Representative network graphs are shown, giving the contacts between males (blue) and females (red). The black lines between each individual represent a transmission relevant contact.
Despite the seasonal variation in the number of nodes in the transmission networks, the sex-ratio of the mice population was invariant over time (χ21,14=0·08; P=0·79; GLM with binomial errors), with a mean male: female ratio of 1·03+/− s.e. 0·02. Additionally, the contacts between the sexes remained constant, with the highest mean proportion of contacts occurring between males and females (mean=0·54+/− s.e. 0·01 2), followed by female-female contacts (mean=0·25+/− s.e. 0·01), with the male-male contacts (mean=0·21+/− s.e. 0·01) having the lowest proportion.
The assortativity index (r) remained constant during the sampling period, with a mean value of −0·13+/− s.e. 0·02, indicative of a disassortative population (Fig. 2). There were no significant differences in the assortativity index temporally (F 1,50=1·30; P=0·25; GLM with Poisson errors). However, spatially there were significant differences in the assortativity index between trapping grids (F 5,51=5·62; P<0·01; GLM with Poisson errors). The assortativity index was not related to either the size of the network (F 1,48=3·98; P=0·62; GLM with Poisson errors), or the mean number of contacts (F 1,49=4·00; P=0·10; GLM with Poisson errors).

Fig. 2. Assortativity coefficient (r), by sex, over time for a wild rodent population, with 95% confidence intervals shown. An assortativity coefficient of +1 signifies assortative mixing, of −1 dissasortative mixing, and equal to 0 random mixing. The solid line gives the mean coefficient with the dotted lines indicating the 95% confidence intervals.
Simulations of macroparasite transmission
We simulated macroparasite transmission in the rodent population using six different empirically-derived networks, with the same level of disassortative mixing. There was some variance in the simulated outcomes from different networks, but the pattern of the epidemic was consistent in that when there was zero male-biased transmission (i.e. transmission was entirely female-biased) the prevalence of the macroparasite in the mice population was moderate (approximately 32%), (Fig. 3). When male transmission was equal to that of females (i.e. the strength of male-biased transmission (c) was equal to 1), the mean overall macroparasite prevalence was predicted to be 73%, considerably higher than the empirical prevalence of 60% (61% in male mice and 58% in females). As transmission became more male-biased (c>1), the mean overall prevalence increased, up to an asymptote of 80% for c=1·5. With male-biased transmission strengths greater than 1·5 the macroparasite prevalence decreases, reaching an over all mean of 50% when the strength of male-biased transmission was 10 times that of the females, c=10 (Fig. 3).

Fig. 3. Prevalence of the macroparasite Heligmosomoides polygyrus in a wild rodent population (Apodemus flavicollis) according to simulated dynamics in a population where the mixing by sex is dissasortative and where the strength of male-biased transmission (c) ranged from zero to ten times greater than female transmission. Each shown level of male-biased transmission is the result of 1000 simulations from 6 different networks. The dotted lines indicate the 95% confidence intervals.
Since mixing patterns can produce sub-groups where infection takes place, we determined the proportion of the infected individuals that were males and the proportion that were females (i.e. the sex-ratio of infected individuals), (Fig. 4). When transmission was totally female-biased (i.e. the strength of male-biased transmission was equal to zero) of those hosts infected a significantly higher mean proportion were males (91%) compared to females (9%), which does not mirror empirical dynamics, where the sex-ratio of infected individuals was equal (Ferrari et al. Reference Ferrari, Cattadori, Nespereira, Rizzoli and Hudson2004). When transmission was not sex-biased in any direction (i.e. the value of parameter c was equal to 1) not only was the model-predicted mean overall macroparasite prevalence higher than empirical observations (73% compared with 60% respectively) (Fig. 3), but the sex-ratio of infected individuals was skewed, with infection being concentrated in the males (a mean of 82% of male mice being infected). As male-biased transmission increased, the model predicted that of the infected individuals the mean proportion of males decreased while that of females increased, indicating that as male-biased transmission increased so the sex-ratio of infected individuals became more balanced (Fig. 4). It was not until the male-bias in transmission was 10 times that of the females that the sex ratio of infected individuals became equal, mirroring the empirical dynamics of H. polygyrus in A. flavicollis in northern Italy.

Fig. 4. Model predictions of the sex ratio of individuals infected with the macroparasite Heligmosomoides polygyrus in a wild rodent population. The dynamics were simulated (1000 simulations) on a transmission network and given an increasing strength of male-biased transmission, which ranged from zero to ten times greater than female transmission. When the sex-ratio is equal the model captures the empirical dynamics of the system. The dotted lines indicate the 95% confidence intervals and the solid line the mean.
DISCUSSION
In this study of a natural wild rodent-parasitic nematode system we asked the question: to what extent are the interactions between male and female rodents assortative (single sex) or disassortative (mixed sex) and can this explain the empirical macroparasite prevalence observed at a population level and also the sex ratio of infected hosts? In conjunction with the empirically-derived networks (by observation of A. flavicollis–H. polygyrus populations), we asked ‘what strength of male host-biased transmission predicts empirical patterns of macroparasite prevalence and the sex ratio of infected hosts?’ We produced transmission networks of rodent interactions, based on space sharing and quantified the degree of mixing by the discrete characteristic of sex, over a 6 month period in a wild population of the yellow-necked mouse. We found the transmission networks to be disassortative (r=−0·13+/−0·02) in that mixed sex transmission contacts were more prevalent than female-female or male-male contacts and that this was seasonally constant. This pattern contrasted with previous work with wildlife populations where the population has been observed to be stratified according to single-sex interactions, i.e. assortatively mixed (Lusseau and Newman, Reference Lusseau and Newman2004).
The invariant nature of the assortativity index we recorded was a surprising result considering that social interactions between these rodents are proposed to be a function of the breeding status of the hosts, and that there is a distinct breeding season that peaks in August (Flowerdew, Reference Flowerdew1984). As such we expected this seasonality to be reflected in the measured assortativity index. The invariant disassortative patterns observed here could reflect mixed-sex contacts according to a prolonged breeding season over the data collection period of May through October, which can occur in food-abundant years (Flowerdew, Reference Flowerdew1984). Alternatively, the temporal and spatial resolution of our observations may not have enabled us to detect the subtleties of interactions during the breeding season and our observations instead are a function of the actual long-term social structure of the population, where males maintain discrete territories that overlap with the home range of several females.
If the rodents' social structure, in terms of the dissasortative mixing patterns observed, was important in determining the macroparasite prevalence in the rodent population, then our simulations would have predicted a value closer to the 60% prevalence observed and a balanced sex-ratio of infected individuals (as recorded in the field) when no sex-bias in transmission was assumed (c=1). However, when no sex-bias in transmission was assumed, the model predicted that the epidemic would be focused in the males, with 82% of those mice infected belonging to the male sex. This leads us to conclude that in this host-parasite system the hosts' social structure is not the only factor important in predicting empirical macroparasite dynamics. Additionally, the dynamics of H. polygyrus tend to be seasonal, prevalence of infection peaking in April and declining thereafter (Gregory et al. Reference Gregory, Montgomery and Montgomery1992), and as such the invariant disassortative mixing patterns alone will not capture the macroparasite dynamics. To reflect empirical observations, a male-bias in macroparasite transmission that is an order of magnitude greater than female transmission must be imposed on the social structure.
We found that when the male-bias in transmission was 10 times greater than that of the females a balanced sex-ratio of infection among the hosts, plus a mean population prevalence of 50% were predicted. This scenario captures more closely the empirically-observed prevalence for this population (Ferrari et al. Reference Ferrari, Cattadori, Nespereira, Rizzoli and Hudson2004) and we conclude that the strength of male-biased transmission in this population is likely to be high. As such, the males of the rodent population are the super-spreaders, on account of the large number of infective stages they transmit. It is heterogeneity at an individual level, rather than the mixing patterns observed at a population level, that is important in the dynamics of this macroparasite. Previous papers have attempted to address the mechanisms that produce super-spreaders (individuals disproportionately involved in transmission). In general, intrinsic factors including host immune response, co-infections and host behaviour can all affect the shedding rate of infectious particles/stages (Wilson et al. Reference Wilson, Bjørnstad, Dobson, Merler, Poglayen, Randolph, Read, Skorping, Hudson, Rizzoli, Grenfell, Heesterbeek and Dobson2002). Specifically for this system, male-biased transmission has been proposed to be a function of a compromised male immune response resulting in increased parasite fecundity, hatching of parasite eggs (parasite fertility) or survival of the free-living infective L3 stages (Ferrari et al. Reference Ferrari, Rosà, Pugliese and Hudson2007).
Although the disassortative structure of the population alone did not predict the empirical dynamics observed in this population, network structure could still be important for (directly-transmitted) macroparasite dynamics because infection tends to spread across disassortative networks. As such, disease control is likely to be more effective on a dissasortative network than on an assortative one because treatment of, in this case the male hosts, would have an effect on the rest of the network as those individuals are strewn across the network, so treating them treats all parts of the network at once (Newman, Reference Newman2003). Newman (Reference Newman2002, Reference Newman2003) also suggests that targeted intervention in a disassortative network is more effective than targeted control in an assortative network, because assortative networks are highly resilient to the removal/treatment of individuals (nodes), primarily because of the presence of sub-groups (Eames, Reference Eames2007). More generally, the epidemiological implications of our results suggest that, given the predictions of the model and if transmission appeared to be strongly biased towards one of the sexes, any disease control efforts on a population level would be highly effective if that particular sex were preferentially treated. Another consideration for disease control on a network is that the impact of treatment will only follow the expected patterns provided that treatment does not alter the contact structure of the population. In animal populations the social network is often dynamic, for example individuals may respond to the infectious status of others (Kavaliers and Colwell, Reference Kavaliers and Colwell1995).
There is an increasing use of networks in ecology to study interactions in animal populations and disease (Proulx, Promislow and Phillips, Reference Proulx, Promislow and Phillips2005). Networks offer a useful approach when a population is heterogeneous, as natural populations often are (Bansal et al. Reference Bansal, Grenfell and Meyers2007). Whilst this study provides insights into the heterogeneous nature of macroparasite transmission within a natural rodent host population, there are limitations with using this approach. The transmission network and its properties are a function of the assumptions made. The number of nodes and contacts between them are a function of the spatial and temporal resolution of the data and may change given greater temporal and spatial resolution. This is a common problem when documenting social networks and has been shown to change the properties of the network in other wildlife populations (Cross et al. Reference Cross, Lloyd-Smith, Bowers, Hay, Hofmeyr and Getz2004). We have addressed only sex-specific differences in parasite prevalence. Variation in parasite intensity at the individual scale is likely also to be an important driver of transmission dynamics given the often overdispersed distribution of parasite number per host in populations. In ongoing work we will address the correlation between network characteristics and individual variation in parasite load. Additionally, we do not simulate a time-scale longer than a cohort because we do not know how births and deaths affect network connectivity. Understanding the dynamics of recruitment into the network on topology is a key challenge here and in network models in general.


