INTRODUCTION
The number of parasites colonizing a host is considered an important determinant of epidemiological and co-evolutionary processes (Read and Taylor, Reference Read and Taylor2001; Brown et al. Reference Brown, Hochberg and Grenfell2002). For the host, higher and/or more diverse parasite loads may impair its ability to fight infection and thus reduce fecundity or survival (Anderson and May, Reference Anderson and May1978; Ebert et al. Reference Ebert, Zschokke-Rohringer and Carius2000; Read and Taylor, Reference Read and Taylor2001). For the parasite, the sharing of potentially limiting resources among co-infecting strains may limit per capita reproductive success and transmission (e.g., Ebert et al. Reference Ebert, Zschokke-Rohringer and Carius2000; Bell et al. Reference Bell, de Roode, Sim and Read2006; Ben-Ami et al. Reference Ben-Ami, Mouton and Ebert2008a). Hence, how parasites are distributed among hosts may influence population regulation and genetic diversity of both host and parasite (Anderson and May, Reference Anderson and May1978; Jaenike, Reference Jaenike1996; Poulin, Reference Poulin1998). Over many generations, levels of multiple infection are expected to affect the evolution of within-host growth and virulence (Brown et al. Reference Brown, Schmid-Hempel and Schmid-Hempel2003; Schjørring and Koella, Reference Schjørring and Koella2003).
In standard epidemiological models, the frequency of multiple infection is determined by the density of hosts and parasites in the population and the transmission probability once they come into contact (Anderson and May, Reference Anderson and May1979). In the simplest case, the spatial distribution of hosts and parasites is homogenous, infectious contacts occur randomly, all hosts are equally susceptible and all parasites equally infective. The expected number of parasites per host in a population then follows a Poisson distribution, with a given mean number of parasites and a distribution around that mean. Under the Poisson law, the mean equals the variance, and deviations from a random distribution can be described as over- or underdispersion (variance/mean ratio is greater or less than 1). Thus, if deviations from random occur, populations may show the same mean number of parasites per host, but with different distributions. In epidemiological terms, this generates differences both in prevalence and in the frequency of multiply infected hosts, which, in turn, can strongly influence the force of infection and the spread of the parasite (Jaenike, Reference Jaenike1996). For example, overdispersion (or aggregation) refers to a clumped distribution of parasites, with many hosts carrying no or only a few parasites and few hosts carrying many parasites (Poulin, Reference Poulin1998). Aggregation is predicted to limit parasite transmission in the population, thereby reducing the negative effects on host population growth (Anderson and May, Reference Anderson and May1978; Jaenike, Reference Jaenike1996).
Non-random or aggregated distributions are well known for macroparasites and ectoparasites (Poulin, Reference Poulin1998; Shaw et al. Reference Shaw, Grenfell and Dobson1998; Elston et al. Reference Elston, Moss, Boulinier, Arrowsmith and Lambin2001) as well as for certain microparasites (Lord et al. Reference Lord, Barnard, Day, Hargrove, McNamara, Paul, Trenholme and Woolhouse1999). Causes of non-randomness broadly fall into 2 classes. First, they may be linked to the transmission process if assumptions of theoretical mass action models are not met. Second, they may result from within-host reproduction or from within-host interactions, altering parasite load at later stages of infection. Here, we focus on the first type of causes. For example, deviations from random mass action can arise from spatially and temporally heterogeneous distributions of host or parasite (Hall et al. Reference Hall, Duffy, Tessier and Caceres2005) or from within-population differences in levels of innate, acquired or stage-dependent resistance (Poulin, Reference Poulin1998; Shaw et al. Reference Shaw, Grenfell and Dobson1998; Boag et al. Reference Boag, Lello, Fenton, Tompkins and Hudson2001; Galvani, Reference Galvani2003; Karvonen et al. Reference Karvonen, Hudson, Seppala and Valtonen2004). In natural systems, it is difficult to assess the relative importance of these factors because they often vary simultaneously and their experimental manipulation can be complicated (Tanguay and Scott, Reference Tanguay and Scott1992; Karvonen et al. Reference Karvonen, Hudson, Seppala and Valtonen2004). One solution is to simulate their action experimentally by using appropriate (i.e. sufficiently small) host-parasite systems under controlled conditions in the laboratory.
We investigated ecological and genetic determinants of multiple infection and aggregation in experimental microcosms of the protozoan Paramecium caudatum and its bacterial parasite Holospora undulata. This micronucleus-specific parasite is horizontally transmitted by immobile infectious stages ingested by the paramecia during food uptake. The relatively small size of the micronucleus and the relatively large size of these transmission stages suggest that only a limited number of parasites can establish simultaneously on a new host. First, we tested whether the probability of multiple infection increases with infectious dose and whether patterns of aggregation occur and vary with dose. Second, we used several host clones to test whether the mean and distribution of multiple infection varies with host genotype. In particular, we tested how a first wave of infection affects patterns of (multiple) infection following a second wave. Third, we tested how patterns of multiple infection were affected by the spatial distribution of host and parasite in our microcosms as well as by the age of host genotype.
MATERIALS AND METHODS
Study system
Paramecium caudatum occurs in Eurasian freshwater ponds and lakes. Like all ciliates, P. caudatum has 2 nuclei. The polyploid macronucleus serves a vegetative function, whereas the diploid micronucleus is active mainly during sexual reproduction (analogous to the germ line of multicellular organisms).
The gram-negative Holospora undulata belongs to the alpha-Proteobacteria, together with symbionts, such as Rickettsia and Wolbachia spp. (Amann et al. Reference Amann, Springer, Ludwig, Görtz and Schlaifer1991). The filter-feeding paramecia ingest the S-shaped (10–15 μm) infectious forms during food uptake. The ingested infectious forms come into contact with the membrane of the digestive vacuole to produce a vesicle transporting the parasite to the micronucleus. Already during these first steps of infection, the bacterial cells begin to change morphology and gene activity (Dohra and Fujishima, Reference Dohra and Fujishima1999). Once in the micronucleus, infectious forms differentiate into the functionally and morphologically very different reproductive forms. The first visible signs (>6 h) of this process are constrictions that mark the points where the cell will undergo the first fissions (16–24 h). At least until the 8-cell stage, fissioning cells remain aligned so that the ‘mother’ infectious form can still be reliably identified. With each fission, cells become smaller, until they develop into the typical round-shaped (3 μm) reproductive forms, which continue to multiply and eventually fill out the entire micronucleus (infectious forms themselves do not replicate). After 7–10 days, reproductive forms can differentiate back into infectious forms, released during cell division or when the host dies. Details of the parasite life cycle are described by Fokin (Reference Fokin2004) and Görtz and Dieckmann (Reference Görtz and Dieckmann1980). In inoculation experiments, only few of the ingested infectious forms establish infections; typically, most infections (>95%) occur during the first 24 h following inoculation (Fokin, Reference Fokin2004; Fels and Kaltz, Reference Fels and Kaltz2006; see also Results section), possibly because paramecia begin to avoid ingestion (D. Fels and O. Kaltz, unpublished data). Thus, by fixing an individual during the first 24 h following infection, we can determine the number of parasites establishing an infection in the micronucleus; further, there is a time window (2–3 days after infection), in which recent primary infections (now at the reproductive stage and beginning to fill out the micronucleus) can readily be distinguished from new, secondary infections (infectious forms; see Experiment 2).
Origin of material
Six host clones were used. Clones K4, K6 and K9 originated from sexual crosses between 2 Japanese strains (Restif and Kaltz, Reference Restif and Kaltz2006). Clones O3, OB and T2 were derived from single individuals from strains of German origin (provided by H.-D. Görtz, University of Stuttgart, Germany). Mass cultures of these clones were kept at 23°C in a sterile medium made of organically grown salad (Lactuca sativa, ground up with a mortar and pestle after 2 days of desiccation at 80°C), at a concentration of 0·7 g/l in Volvic™ mineral water, to which we added the bacterium Serratia marcescens (strain A173, Institut Pasteur, Paris, France) as food resource.
Inocula were prepared from an infected base culture, originally provided by H.-D. Görtz. The preparation of inocula is described in detail by Millot and Kaltz (Reference Millot and Kaltz2006). Briefly, infected paramecia were concentrated by centrifugation, then crushed with a tissue homogenizer. Infectious forms of the parasite were separated from debris through density-gradient centrifugation, with Percoll™ (90%; Sigma Chemicals, France) as the dense phase. The density of infectious forms in the inoculum was measured with a haemocytometer.
Experiment 1: Inoculum dose and (multiple) infection success
To investigate the effect of inoculum dose on the probability of (multiple) infection, we set up 50 ml tubes, containing 100 uninfected paramecia (clone OB), in 1 ml of diluted (20%) medium. Inocula were added at 8 concentrations: 0·5, 1, 2, 4, 8, 16, 32, or 64 infectious forms (IF) per μl, with 2–4 replicate tubes per dose. At 24 h following inoculation, ~60 individuals were sampled from each replicate and fixed with lacto-aceto-orcein (Görtz and Wiemann, Reference Görtz and Wiemann1989). Infection status and the number of infectious forms present in the micronucleus of infected individuals were determined at 1000× magnification (phase contrast).
Statistical analyses were carried out using the statistical package JMP (SAS, 2003) or SAS (SAS, 1996). In this and the other experiments, variation in the proportion of (multiply) infected individuals was analysed by means of logistic regression (Analysis of Deviance=ANODEV), using the SAS GENMOD procedure. Variation in (log-transformed) mean number of parasites infecting a host was analysed by means of ANOVA. In Exp. 1, we tested for a relationship between (log-transformed) parasite dose and (multiple) infection success. Further, we performed G-tests (Zar, Reference Zar1984) to establish whether the distribution of parasite infectious stages successfully infecting the hosts was different from a random, Poisson distribution. Data from replicate tubes with the same dose were combined, after verifying that the distribution of infectious stages did not significantly differ between them (not shown). Because of the low infection success, we also combined tubes from the 3 lowest doses. From means and variances of the number of parasites per host, we calculated the coefficient of dispersion [(variance – mean)/mean] to quantify parasite aggregation; we chose this estimator because of its simplicity and its straightforward interpretation [for a discussion of different estimators, see Poulin (Reference Poulin1998) or Elston et al. (Reference Elston, Moss, Boulinier, Arrowsmith and Lambin2001) ].
Experiment 2: Patterns of multiple infection following single and sequential inoculation
A first inoculation was to test whether multiple infection was disproportionately rare or frequent (i.e. aggregated) and whether such patterns varied with host genotype. A second inoculum followed 48 h after the first, which allowed us to measure the frequency of secondary infections when a first cohort of parasites had already established.
Inoculation 1
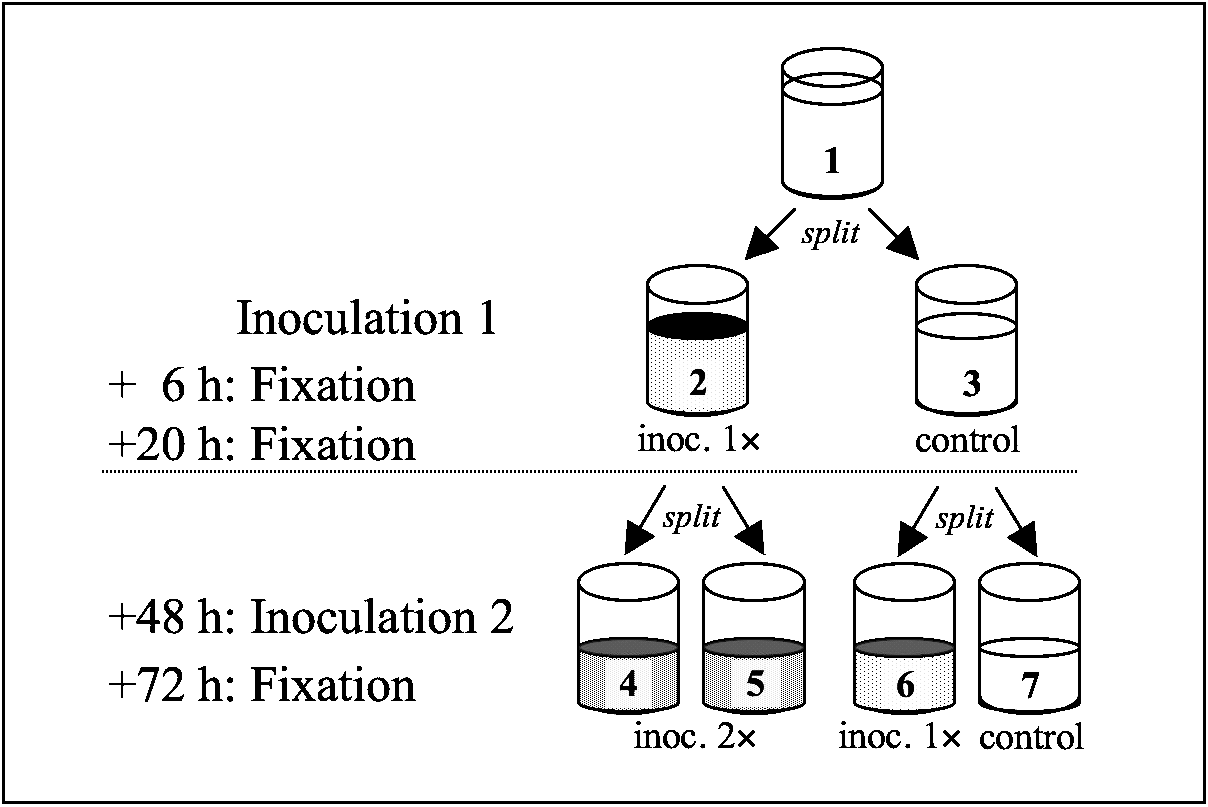
Two replicate cultures from each of 5 host clones (K4, K6, K9, O3, T2) were grown to ‘carrying capacity’. From each replicate culture, 2 assay tubes were established. One tube received an inoculum, while the other remained untreated (Fig. 1). Six and 20 h following inoculation, ~80 individuals from each assay tube were fixed and the number of infectious forms in their micronucleus determined.
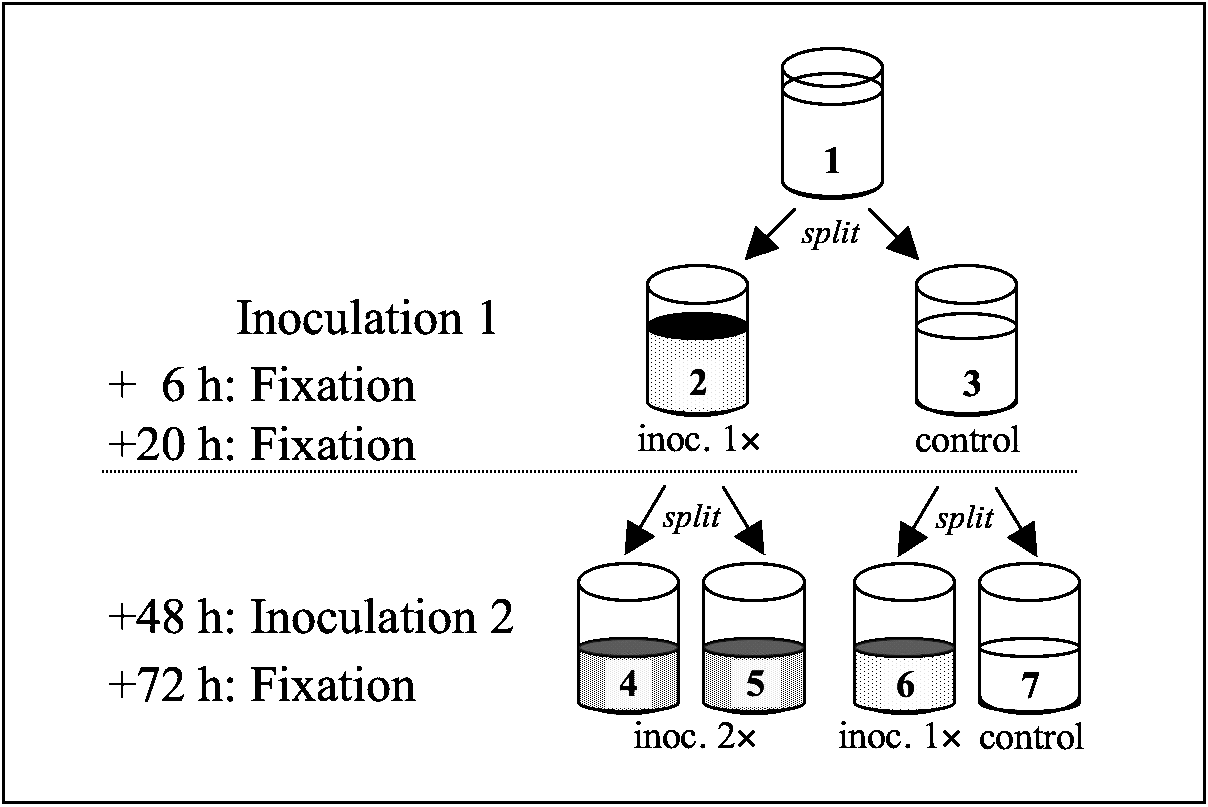
Fig. 1. Design of Exp. 2. For each of 5 host clones, 2 replicate base cultures at carrying capacity were used. Each base culture (1) was split into 2 tubes (each with 2500 paramecia in 10 ml): one tube (2) inoculated with 7×10⁵ infectious forms (500 μl), the other untreated (3). Samples were fixed at 6 and 20 h following inoculation to measure infection success. At 48 h post-inoculation, each tube received 5 ml of medium and was then split into 2 new tubes and inoculated with 1·6×106 infectious forms (500 μl). Thus, tubes (4) and (5) were inoculated twice, tube (6) was newly inoculated. Samples were fixed 24 h following inoculation. Tube (7) remained untreated and was not further considered for this experiment.
Inoculation 2
At 48 h following inoculation 1, we divided the content of each tube into 2 ‘daughter’ tubes, to which we added a new inoculum (Fig. 1). For control tubes not inoculated in round 1, only 1 of the daughter tubes was inoculated in round 2. At 24 h after the second inoculation, we fixed 40–50 individuals per assay tube. At this point, new and old infections could be distinguished. Infections from the first inoculation were at the reproductive stage, new infections from the second inoculation could be identified as infectious forms. Thus, sequential infections harboured both reproductive and infectious forms in the micronucleus.
For statistical analysis, we used ANODEV and ANOVA to examine among-clone variation in (multiple) infection probability and in infection intensity (mean number of parasites per host) after the first inoculation. Separately for each host clone, we tested for deviations from random distributions of infectious forms in infected micronuclei (G-tests). Coefficients of dispersion were compared among host clones (one-way ANOVA). Further, we used a factorial ANODEV for the analysis of how host clone identity and infection status after inoculation 1 (control, exposed-uninfected, infected) influenced infection probability in inoculation 2. For this latter analysis, we combined the proportion of infected individuals in each of the 3 categories over sister tubes [tubes (4) and (5) in Fig. 1; total n=30].
Experiment 3: Vertical distribution of host and parasite in the microcosms
In our inoculation experiments, tubes were not shaken continuously, which likely produced a vertical density gradient of infectious forms. Furthermore, we typically observed groups of paramecia either near the surface or at the bottom of the tube, ‘grazing’ on salad particles. To quantify this spatial heterogeneity, we prepared 16×50 ml tubes, each containing ~2400 uninfected paramecia (clone K9) in 10 ml of medium, to which we added 7×10⁵ infectious forms. Tubes were agitated once and then left ‘unshaken’. Densities of paramecia and infectious forms were measured after 6 and 24 h, by gently inserting a micropipette and taking samples from immediately under the surface and from near the bottom of the tube. Density of infectious forms was determined with a haemocytometer, paramecia were counted under a dissecting microscope. We compared statistically the densities of paramecia or infectious stages at the surface versus the bottom of the tubes by means of paired t-tests, 6 and 24 h after mixing.
Experiment 4: Multiple infection in shaken versus unshaken microcosms
Spatial patchiness of host and parasite in unshaken tubes (see Exp. 3) could have caused variation in exposure to the parasite and thus an aggregated distribution of parasites within infected hosts (see Exp. 2). To test this hypothesis, we performed an inoculation experiment in unshaken and shaken tubes. Shaken tubes were agitated on a shaker (IKA-VIBRAX™) to homogenize the spatial distribution of infectious forms in the tube. Another potential cause of aggregation was within-clone variation in susceptibility to infection. The clonal mass cultures were established several months before the experiment and, over time, physiologically or genetically distinct clonal lineages may have established within our cultures. To test this proposal, we isolated 4 individuals from each of 2 clonal mass cultures (K3, K9) and propagated them as independent clonal lineages for 3 weeks prior to the experiment. New clonal lineages and old mass cultures were tested under ‘shaken’ and ‘unshaken’ conditions (n=20 tubes in total). Protocols for inoculation and fixation were identical to those described in Exp. 1. Populations were fixed 12 and 24 h following inoculation. Variation in infection success between clones, treatments and type of culture (old versus new) was analysed by means of a factorial ANODEV. Factorial ANOVA was used to analyse variation in infection intensity.
RESULTS
Experiment 1: Inoculum dose and (multiple) infection success
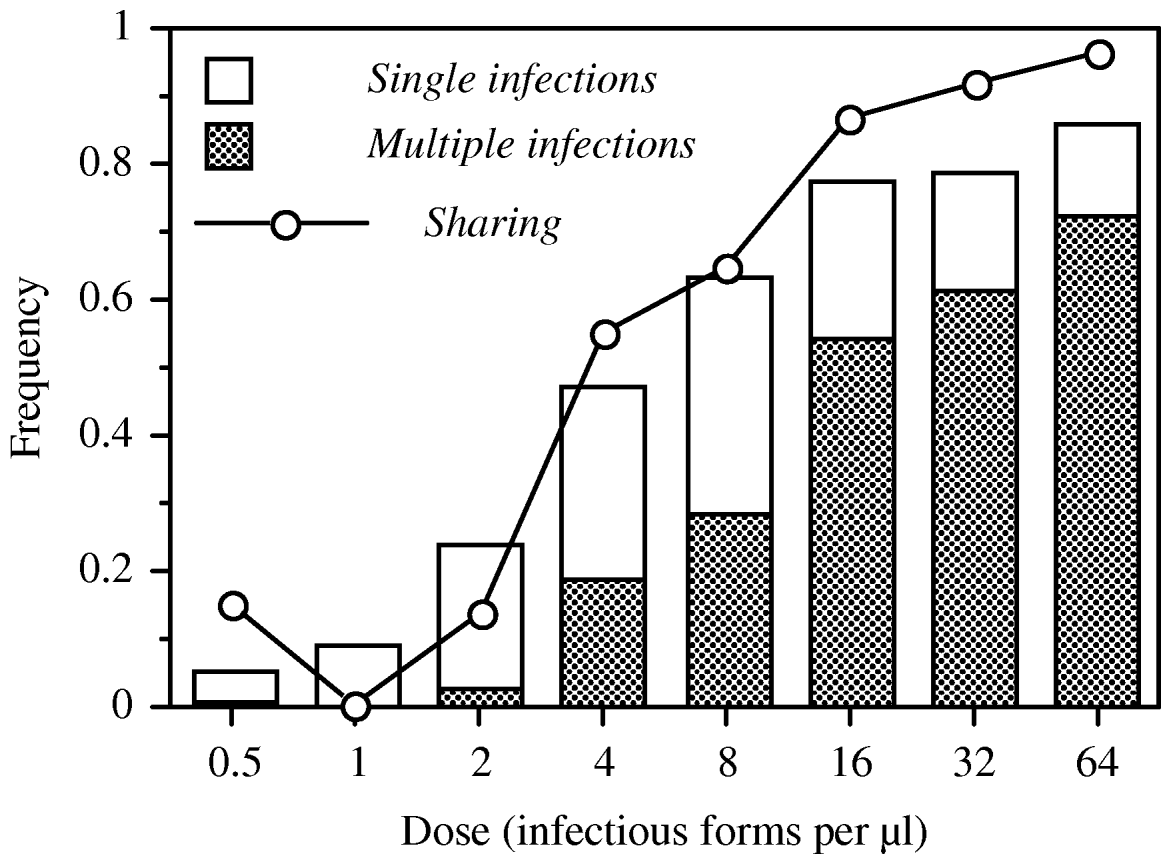
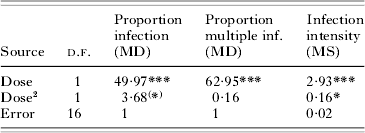
We observed significant linear and second-order effects of parasite dose on infection probability, the frequency of multiply infected hosts and infection intensity (Table 1). These relationships were sigmoidal, with low levels of (multiple) infection at the 3 lowest doses and saturation at the highest doses (Fig. 2). The level of host sharing, i.e. the proportion of successfully infecting parasites that share a host with other parasites, was positively correlated with parasite dose (Fig. 2). At low doses, <25% of the successful parasites shared a host [mean number of parasites per infected host: 1·06±0·04 (standard error of the mean, s.e.)], whereas the level of sharing exceeded 90% at the 2 highest doses (mean parasites per host: 3·14±0·40 s.e.; maximum: 11).
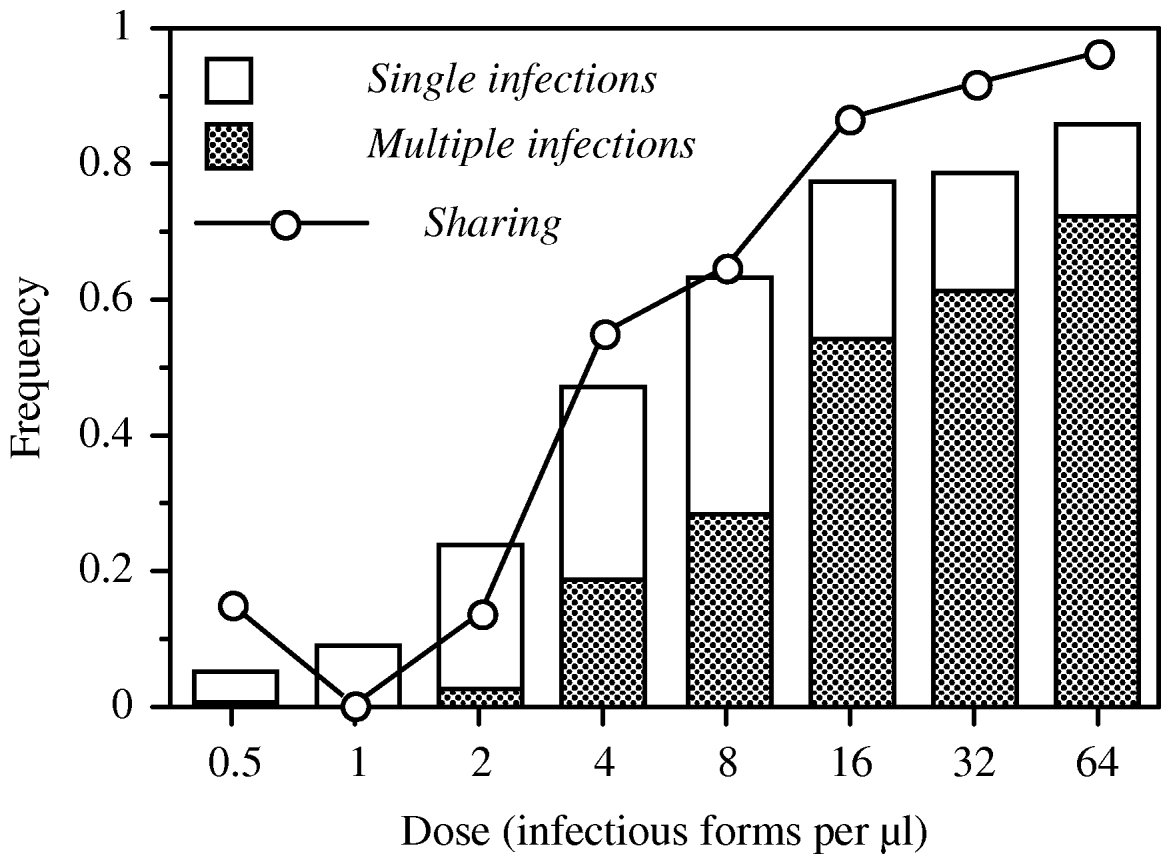
Fig. 2. Patterns of infection over an infectious dose gradient in Exp. 1 (20 h after inoculation). Bars show the prevalence (=mean proportion of infected individuals), the shaded area within each bar indicates the fraction of individuals infected with more than 1 parasite. The dotted line shows the level of sharing (=proportion of successfully infecting parasites that share the host with at least 1 other parasite).
Table 1. Effects of parasite dose (=log-transformed number infectious forms per μl) on infection success in Exp. 1
(Variation in the proportion of infection and of multiple infection was analysed by means of Analysis of Deviance, based on a logistic regression, from which mean deviances (MD) were used to calculate pseudo-F tests. Models were scaled so that the error MD was set to 1. Variation in infection intensity (=log-transformed number of parasites infecting individual hosts; mean per replicate assay tube, excluding uninfected individuals) was analysed by means of Analysis of Variance (MS=mean square). Third-order dose effects were non-significant in all analyses.)
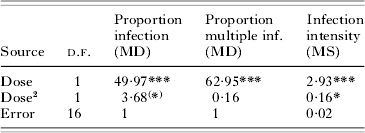
(*) P=0·073; ** P=0·0178; *** P<0·0001.
Overall, the coefficient of dispersion was significantly different from 0 (0·20±0·09 s.e.; t-test: t=1·20, d.f.=18, P=0·0413), indicating a general pattern of parasite aggregation within hosts. However, detailed analysis of the distributions at each dose level revealed significant deviations from random only at the 2 highest doses (32 infectious forms/μl: G-test: G=7·42, d.f.=4, P=0·0390; 64 infectious forms/μl: G=16·68, d.f.=6, P=0·0090).
Experiment 2: Multiple infection after single and sequential inoculation
Inoculation 1
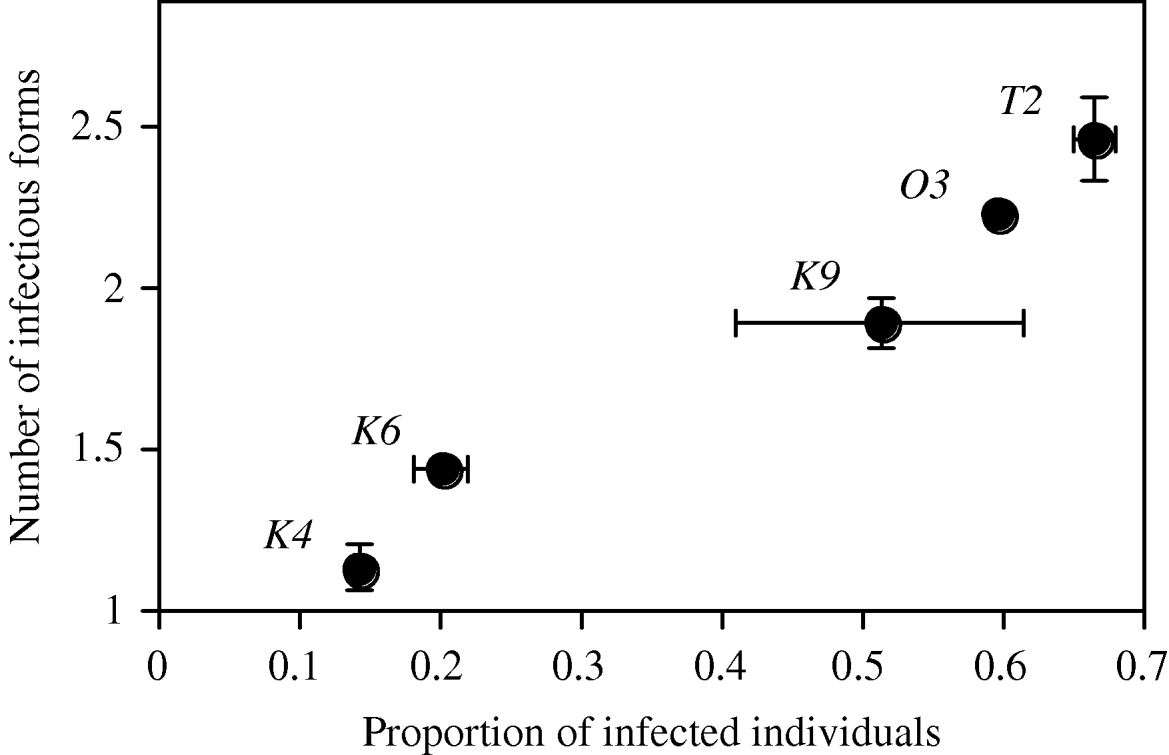
All 10 inoculated tubes showed infections (mean prevalence: 0·42±0·07 s.e.). Two host clones were relatively resistant (K4 and K6, prevalence ⩽0·20), the 3 others relatively susceptible (K9, 03 and T2, prevalence >0·5; effect of host clone: F 4,5=25·00, P=0·0017; Fig. 3).

Fig. 3. Relationship between prevalence (=proportion of infected individuals) and infection intensity (number of parasites infecting individual hosts, excluding uninfected individuals) in Exp. 2, 20 h after inoculation. Means and standard error of the mean are shown per host clone, averaged over 2 assay tubes.
Single infections were harboured by 51% of the infected individuals. Of the multiply infected hosts, 24% carried more than 3 infectious forms in the micronucleus (maximum: 9; overall mean=2·76±0·18 s.e.). Host clones varied significantly in the proportion of multiply infected hosts (F 4,5=9·41, P=0·0151), and more susceptible host clones also showed a higher infection intensity (r=0·98, n=5, P=0·0028; Fig. 3). The level of sharing ranged from <20% in the more resistant clones to ~90% in the more susceptible clones (Table 2).
Table 2. Patterns of multiple infection after the first inoculation in Exp. 2, shown for each host clone and replicate tube and based on pooled data from fixations 6 and 20 h after inoculation
(Mean infection intensity (=number of infectious forms per host) is shown with and without uninfected hosts. Sharing refers to the proportion of successfully infecting parasites that find themselves together with other parasites within the same host. Expected values were calculated from a Poisson distribution with the same mean number of parasites infecting hosts. The coefficient of dispersion (CD) was taken as [(Variance – mean)/mean], with the mean and variance of the number of parasites; if the distribution of parasites is random, CD equals 0; for aggregated distributions, CD>0. G-tests were performed to test whether distributions were significantly different from a random (Poisson) distribution.)

(*) P=0·05; * P<0·05; ** P<0·01; *** P<0·0005.
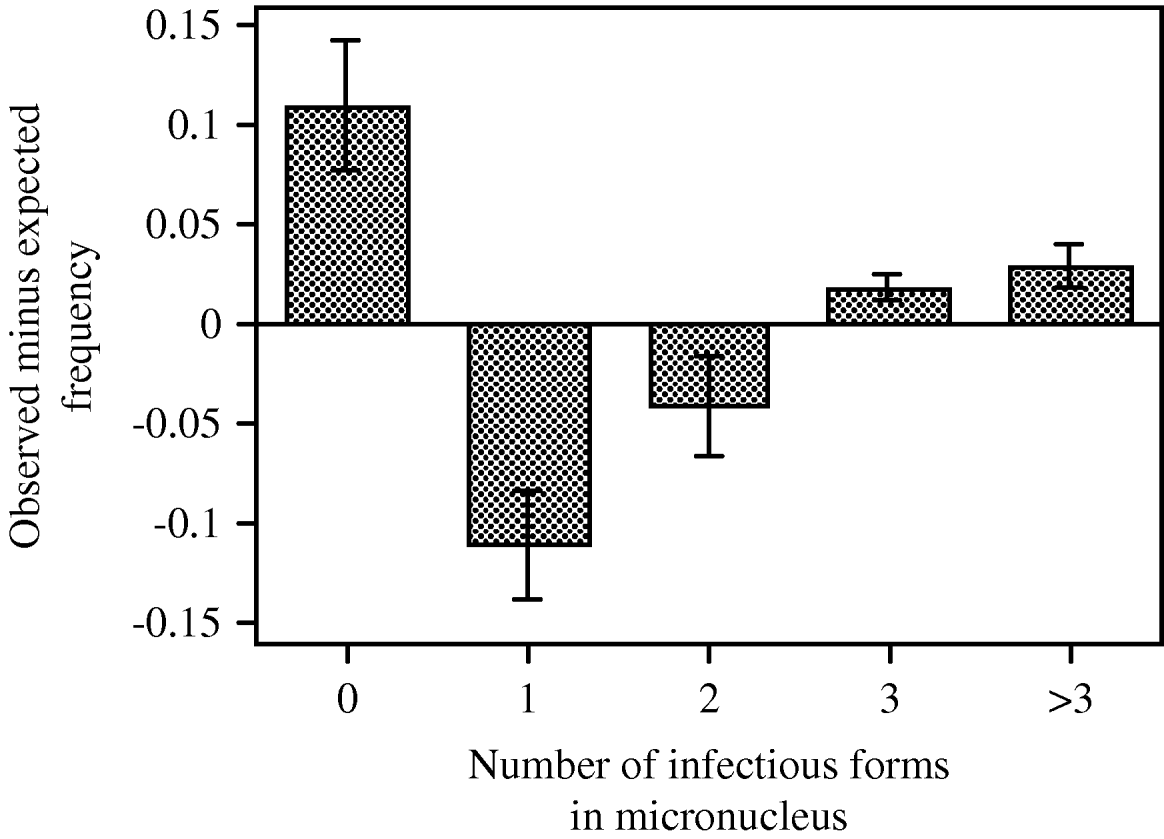
Preliminary analyses showed an increase in mean prevalence between 6 h (proportion of infected hosts: 0·30±0·04 s.e.) and 20 h post-inoculation (0·42±0·07 s.e.; t=2·58, d.f.=9, P=0·0295). However, the proportion of multiply infected hosts, mean infection intensity and the distribution around this mean did not significantly differ between the two time-points (paired t-tests, all P>0·3), and we therefore combined data from both fixations to increase the sample size for the G-tests. For almost all replicate tubes, these tests revealed significant deviations from a random distribution of the intensity of infection (Table 2). The mean coefficient of dispersion (CD=0·61±0·15 s.e.; t=4·06, d.f.=9, P=0·0154) indicated a general pattern of aggregation. We observed more uninfected individuals and more multiply infected individuals with a larger number of infectious forms than would be expected for a given mean and a random distribution around this mean (Table 2 and Fig. 4).

Fig. 4. Differences between mean (±s.e.) observed and expected frequencies of paramecia that remained uninfected or became infected by 1, 2, 3 or more infectious forms. Values averaged over 5 host clones, with data combined over 2 measurements (6 and 20 h after first inoculation, Exp. 2), then averaged over 2 assay tubes. Expected frequencies based on a Poisson distribution.
Inoculation 2
Overall infection success (0·13±0·02 s.e.; 28/30 tubes with new infections) was less than after the first inoculation, but relative levels of resistance of the 5 clones were highly positively correlated between inoculations (r=0·98, n=5, P=0·0023). As for inoculation 1, we detected a significant overall pattern of aggregation for inoculation 2 (CD=0·26±0·07 s.e.; t=3·50, d.f.=27, P=0·0016; effect of host clone: F 4,23=0·45, not significant).
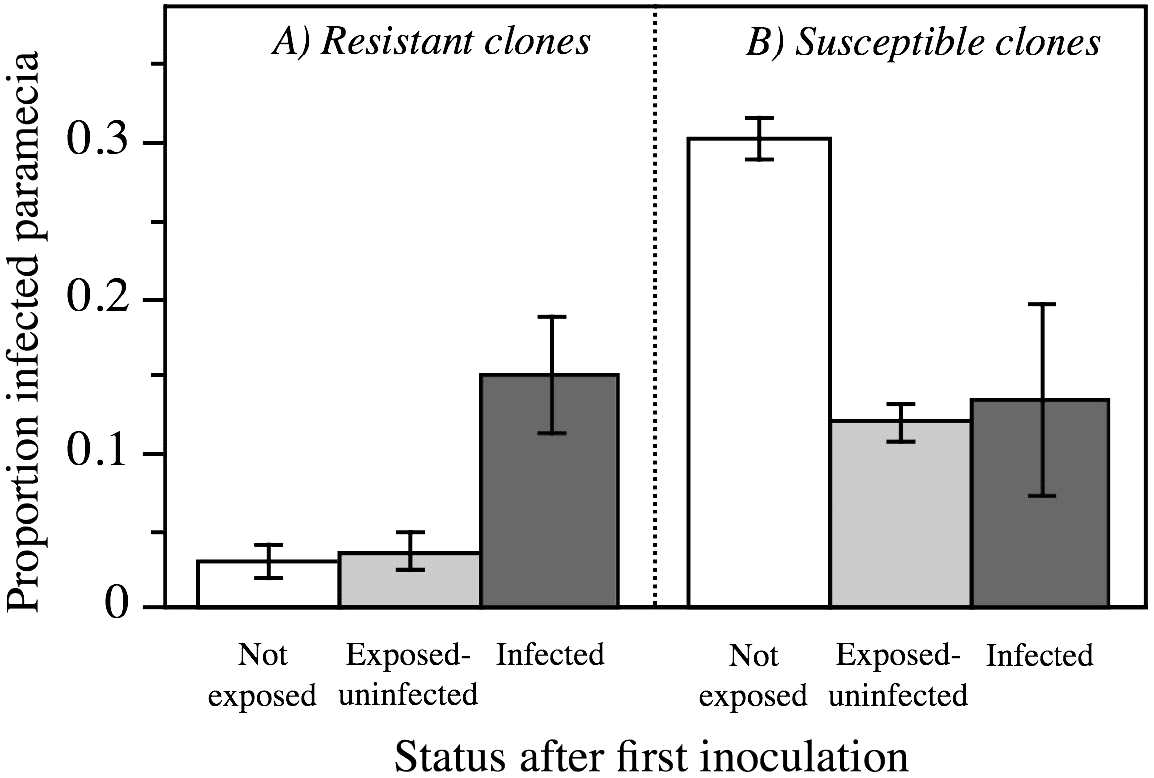
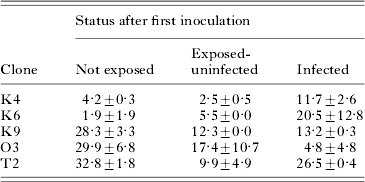
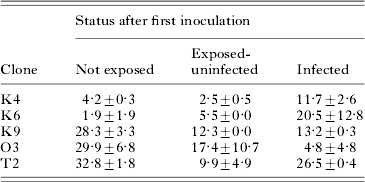
Previous exposure to, or infection with, the parasite affected the probability of new infection, but this differed for different host clones (infection status after the first inoculation×host clone interaction: F 8,15=2·83, P=0·0395; Table 3). For the 2 more resistant clones (K4 and K6), already infected individuals were more susceptible to additional infection (relative to uninfected individuals; Fig. 5A), whereas for the less resistant clones (K9, O3 and T2), already infected individuals were less susceptible to additional infection (Fig. 5B). Previously exposed (but uninfected) individuals of the resistant host clones remained as resistant as the non-exposed controls (Fig. 5A). In contrast, for the less resistant clones, previous exposure rendered uninfected individuals more resistant to new infection (relative to previously unexposed controls; Fig. 5B). Levels of aggregation did not significantly differ between previously exposed and control tubes (F 1,18=0·13, not significant).

Fig. 5. Mean (±s.e.) proportion of individuals that became infected during the second inoculation in Exp. 2, as a function of infection status after the first inoculation (48 h earlier). (A) More resistant host clones (K4, K6); (B) more susceptible host clones (K9, O3, T2). ‘Not exposed’=tube not inoculated; ‘Exposed-uninfected’=individuals uninfected after first inoculation; ‘Infected’=individuals infected after first inoculation. Means and s.e. calculated from clone means.
Table 3. Mean percentage (±s.e.) of individuals that became infected during the second inoculation in Exp. 2, as a function of infection status after the first inoculation (48 h earlier)
(Means shown for 5 host clones. Values first averaged over sister assay tubes [(4) and (5), Fig. 1], then averaged over replicate base cultures (n=2). ‘Not exposed’=tubes not inoculated in inoculation 1; ‘Exposed-uninfected’=individuals uninfected after inoculation 1; ‘Infected’=individuals infected after inoculation 1.)
Experiment 3: Vertical distribution of host and parasite in the microcosms
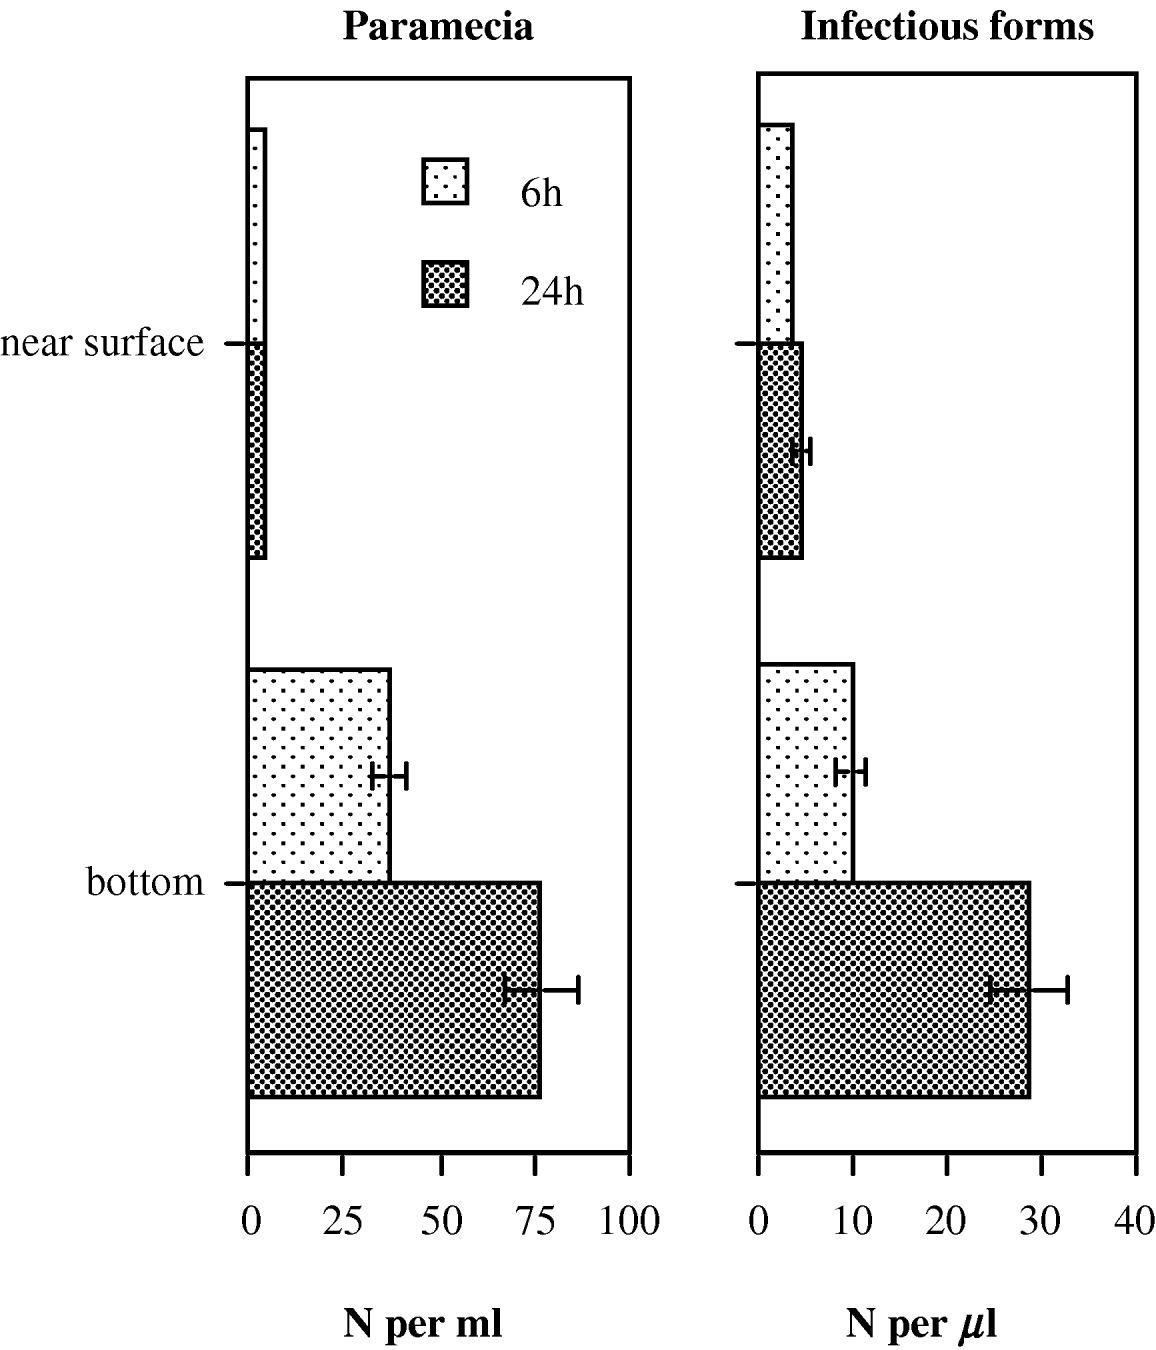
By 6 h after mixing, both the paramecia and the free infectious stages of the parasite had built up a strong vertical stratification, with far higher densities at the bottom of the tube (t>4·0, d.f.=15, P<0·01; Fig. 6). After 24 h, densities at the bottom had increased further, whereas densities near the surface had not changed significantly (t>7·5, d.f.=15, P<0·0001; Fig. 6). Thus, within a few hours, both paramecia and infectious stages were concentrated in a small volume at the bottom of the tube.
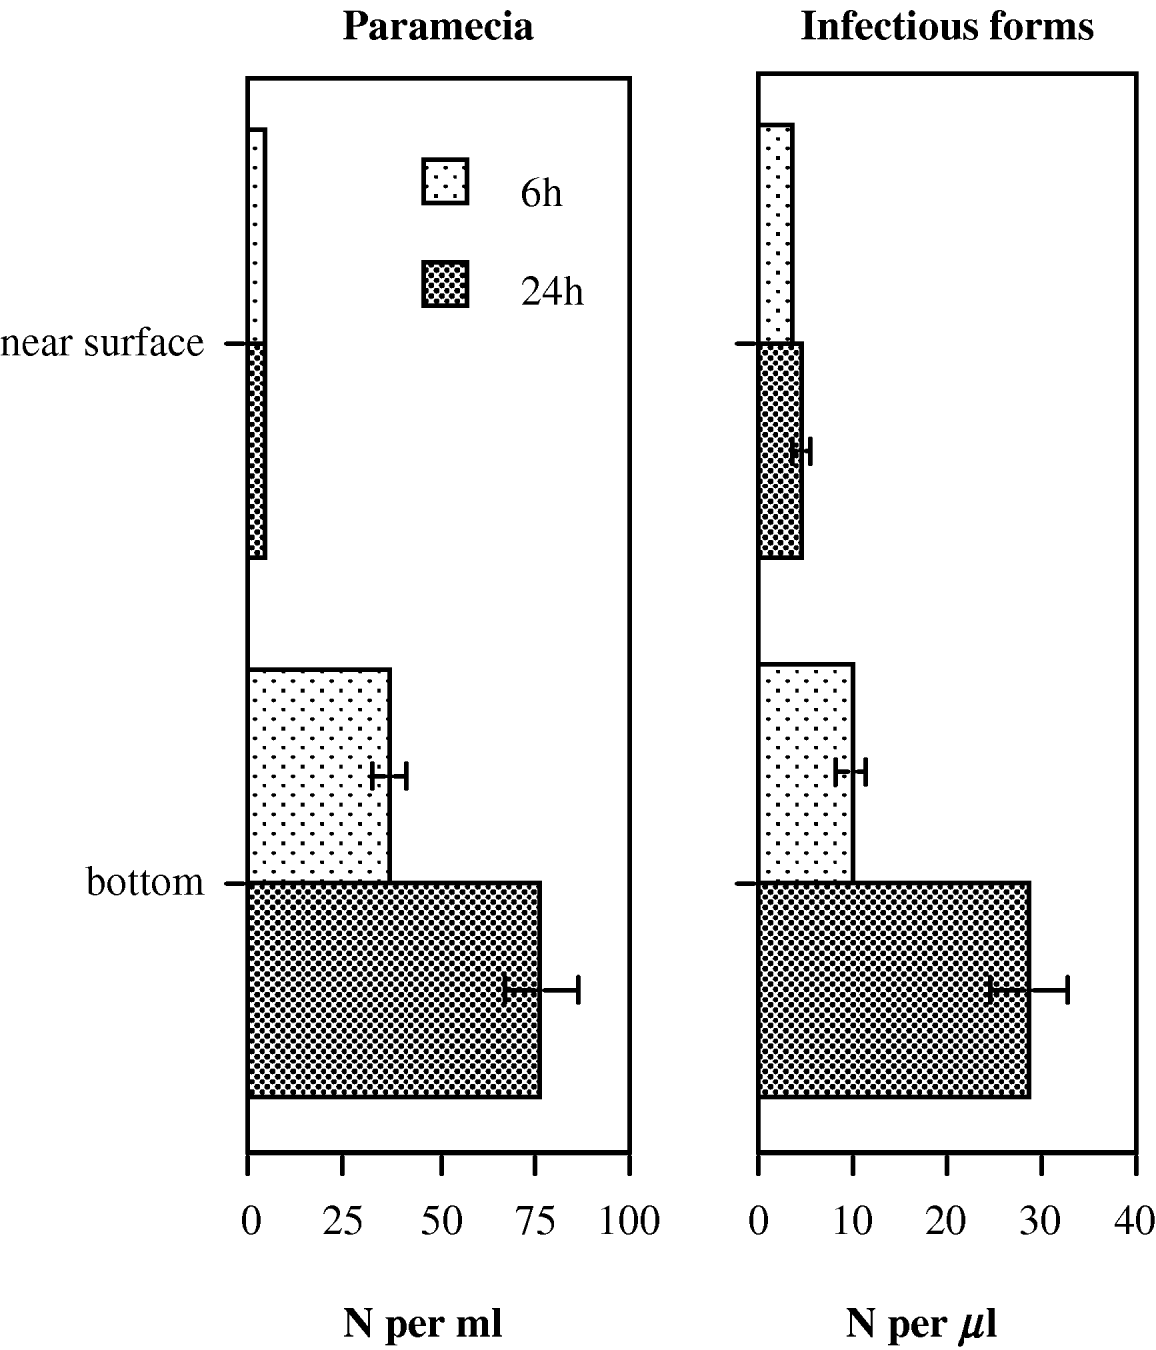
Fig. 6. Mean (±s.e.) densities of host (paramecia) and parasite (immobile infectious forms from an inoculum), measured near the surface and near the bottom of an assay tube (10 ml volume), 6 and 24 h after mixing. Tubes were left unshaken after mixing.
Experiment 4: Patterns of multiple infection in shaken vs. unshaken microcosms
Neither infection success nor the degree of aggregation differed significantly between measurements taken 12 and 24 h following inoculation (not shown). Therefore, we pooled data from the 2 measurements for further analyses. Overall infection success (0·156±0·009 s.e.) was low and the majority of infections were single infections (524/600=87%); most multiple infections were double infections (68/75). Nonetheless, across all tubes, we found a significant level of aggregation of parasites within hosts (mean coefficient of dispersion: 0·11±0·03 s.e.; t=34·86, d.f.=19, P<0·0001).
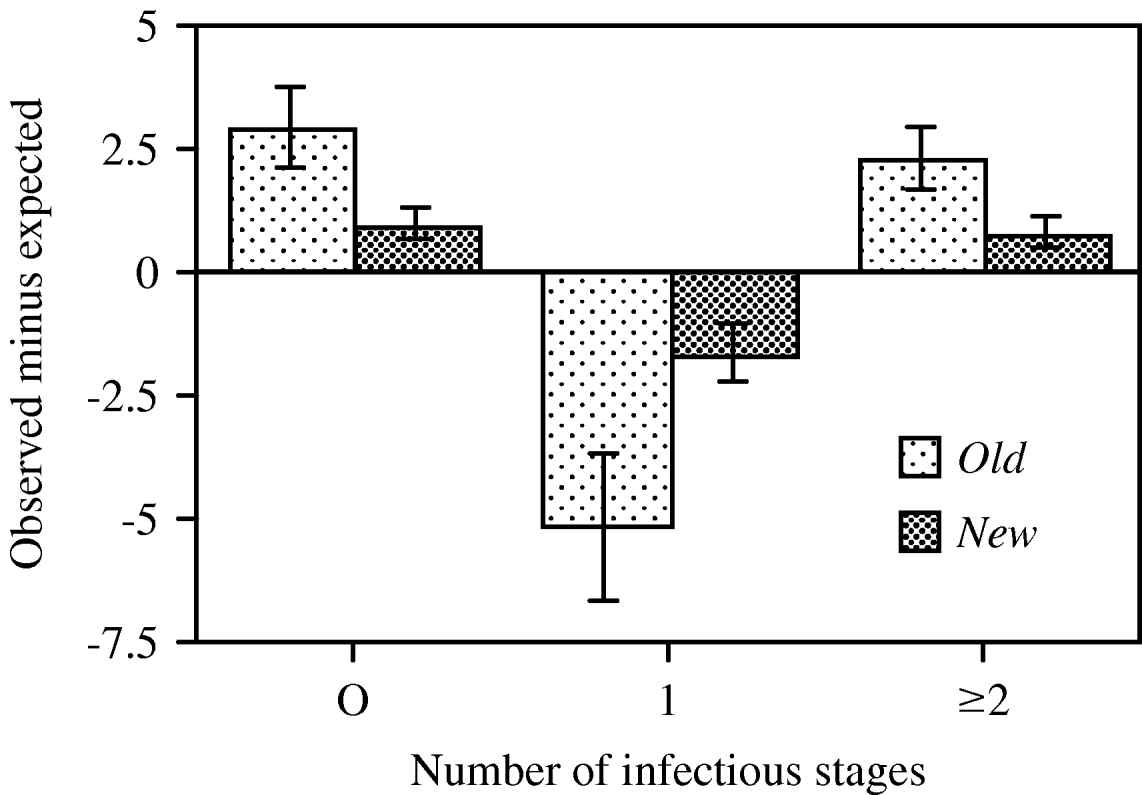
Infection probability in shaken tubes (0·188±0·008 s.e.) was significantly higher than that in unshaken ones (0·126±0·010; F 1,17=22·89, P<0·0001; all other terms in the factorial ANODEV: P>0·2). However, the two treatments did not significantly differ in their coefficient of dispersion (CD, F 1,16<1, not significant) and thus shaking the tubes did not seem to affect aggregation. However, we observed (marginally) significant differences in CD between the two host clones (F 1,17=4·27, P=0·0544) and between the two types of cultures (F 1,17=9·71, P=0·0063). The distribution of parasites was more overdispersed in the old clonal mass cultures (CD=0·27±0·08 s.e.), whereas distributions in newly derived clonal cultures were closer to random (Poisson) distributions (CD=0·07±0·03 s.e.; Fig. 7).
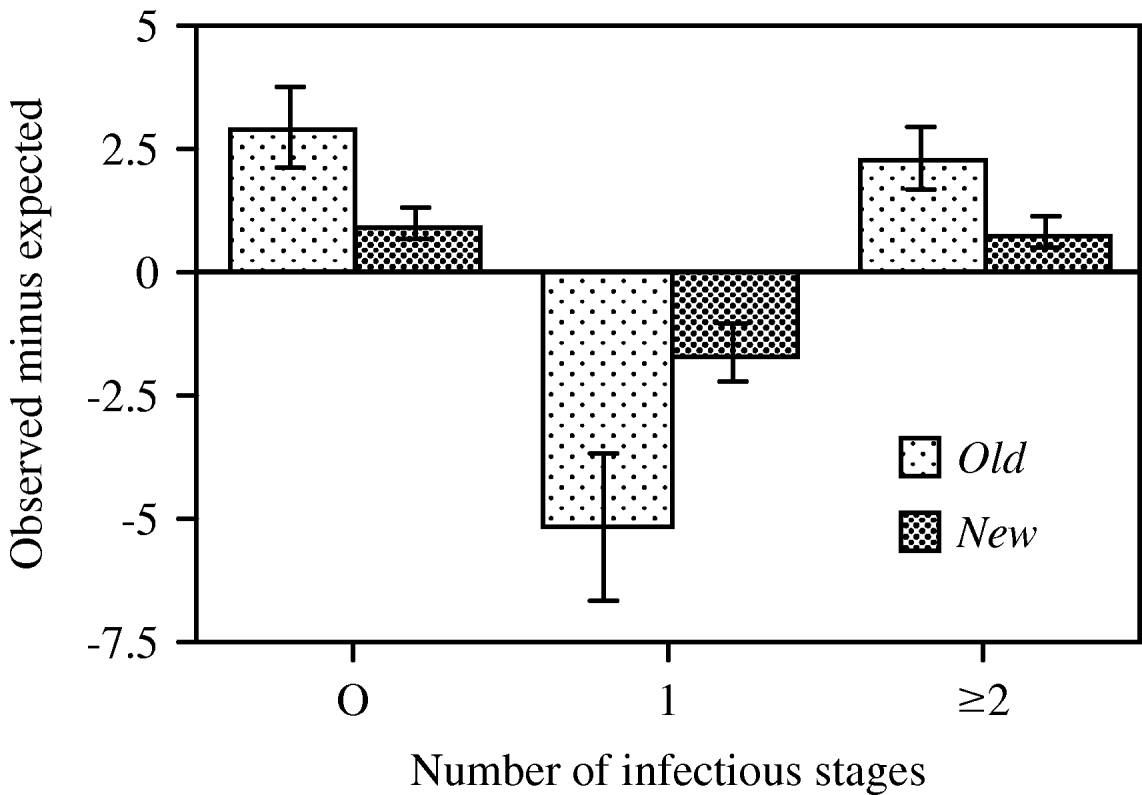
Fig. 7. Differences between mean (±s.e.) observed and expected numbers of paramecia that remained uninfected or became singly (1) or multiply (2+) infected, shown for old and newly derived clonal mass cultures, 24 h after inoculation in Exp. 4. Old cultures were established several months, new cultures 3 weeks prior to the experiment. Values averaged over 2 host genotypes (K3, K9) and 2 treatments (shaken, unshaken); old cultures: n=4, new cultures: n=16. Expected values based on a Poisson distribution.
DISCUSSION
Multiple infection
Experiment 1 represents one of the first quantitative assessments of dose-dependent transmission and multiple infections for the genus Holospora. It revealed sigmoidal relationships between parasite dose and levels of prevalence and multiple infection, similar to observations for Daphnia microparasites (Regoes et al. Reference Regoes, Hottinger, Sygnarski and Ebert2003; Ben-Ami et al. Reference Ben-Ami, Regoes and Ebert2008b). An advantage of our system is that measurements can be taken immediately after infection and before within-host development or growth occurs; therefore, the present results indicate that (multiple) infection probability was directly linked to host-parasite encounter rates. Whether the shape of our curves conforms to random mass-action transmission would require more rigorous mathematical analysis (Regoes et al. Reference Regoes, Hottinger, Sygnarski and Ebert2003) and larger sample sizes. However, the significant parasite overdispersion already shows deviations from a purely random mass-action process, at least at higher doses.
Under natural conditions, dose may vary with host density, prevalence, or rates of release of transmission stages. These epidemiological parameters are largely unknown for natural populations of the Paramecium-Holospora system, but the range of doses used here produced considerable variation in the proportion of parasites sharing a host, from <20% at low doses to ~90% at the highest doses, which corresponded to initial parasite loads of 1–4 infectious forms, on average. As each infectious form generates 4 multiplying daughter cells, even such small initial differences may strongly influence subsequent parasite intensity of infection. Indeed, we observed significant dose effects on within-host growth, concomitant reduction in latency time and virulence in other experiments (O. Kaltz and O. Sakwinska, unpublished data). This illustrates the potential role of parasite dose as a modifier of within-host competition and disease development (Poulin, Reference Poulin1998; Ebert et al. Reference Ebert, Zschokke-Rohringer and Carius2000; Timms et al. Reference Timms, Colegrave, Chan and Read2001; Regoes et al. Reference Regoes, Ebert and Bonhoeffer2002).
In Exp. 2, more susceptible host clones had higher levels of multiple infection, confirming previous results (Fels and Kaltz, Reference Fels and Kaltz2006). This relationship is plausible if each contact with the parasite (i.e. the ingestion of an infectious form) leads to infection with a certain probability, depending on the level of resistance of a host clone. The genetic correlation suggests that the epidemiological relevance of multiple infection depends on the genetic composition of the host population. In less-resistant populations, we expect stronger within-host interactions because multiple infection is more frequent and more parasites infect individual hosts.
The results from the sequential inoculation further indicate that genetic factors (resistance) can interact with epidemiological factors (infection history) to determine the probability of multiple infection. Indeed, when a primary infection had already established, the probability of secondary infection could not be predicted anymore from the degree of resistance of a host clone (see also Tanguay and Scott, Reference Tanguay and Scott1992). Different mechanisms may underlie this observation. In the 2 more resistant host clones, already infected hosts became more susceptible to secondary infection (relative to controls or exposed-but-uninfected individuals). Hosts are unlikely to be physiologically weakened by infection at this early stage (Restif and Kaltz, Reference Restif and Kaltz2006), but possibly these individuals represent a generally less resistant fraction of the population, more likely to become infected in both rounds of inoculation. Alternatively, to prevent its elimination during the first days of establishment (Fokin and Skovorodkin, Reference Fokin and Skovorodkin1997), the parasite may suppress host resistance, thereby facilitating secondary infections, as is known for multicellular organisms (Cox, Reference Cox2001; Boete et al. Reference Boete, Paul and Koella2004). In contrast, in the 3 more susceptible host clones, primary infection and even previous exposure to the parasite appeared to increase resistance against secondary infection. In various organisms, physical or chemical contact with the parasite activates immune responses or induces behavioural defences (Poulin, Reference Poulin1998; Kiesecker et al. Reference Kiesecker, Skelly, Beard and Preisser1999; Kaltz and Shykoff, Reference Kaltz and Shykoff2001; Frank, Reference Frank2002). For example, in the present system, upon contact with the first inoculum, paramecia may avoid further ingestion of the parasite (Nakamura and Fujishima, Reference Nakamura and Fujishima2006). Finally, exposed or infected individuals may communicate the presence of a parasite within the population (Traniello et al. Reference Traniello, Rosengaus and Savoie2002; Engelberth et al. Reference Engelberth, Alborn, Schmelz and Tumlinson2004; Pulkkinen, Reference Pulkkinen2007). Indeed, infection with Holospora changes gene expression in the host (Hori and Fujishima, Reference Hori and Fujishima2003; Nakamura et al. Reference Nakamura, Aki, Aikawa, Hori and Fujishima2004) and this altered state may be perceived by other individuals through chemical or other cues (D. Fels, unpublished data). Such signals may have a detection threshold and require a sufficient number of senders. This would explain why we observed induced resistance in the susceptible clones, but not in the more resistant ones, where fewer individuals were infected. For the time being, these explanations remain speculative, partly because we do not know the (co)evolutionary history of our host clones and this parasite. Nonetheless, recent investigations in our laboratory have demonstrated that resistance against H. undulata evolves in experimental populations (Lohse et al. Reference Lohse, Gutierrez and Kaltz2006), and, in part, this increased resistance seems to be caused by modified filtering behaviour of evolved paramecia (C. Benedet and O. Kaltz, unpublished data). The evolution of increased resistance is expected to reduce the force of infection and levels of multiple infection in the population.
Aggregation
Aggregated distributions of parasites within hosts can reflect deviations from random mass-action transmission, for example, due to within-population variation in ecological and genetic factors determining the probability of contact and infection (Poulin, Reference Poulin1998). Here, we demonstrated patterns of aggregation for a microparasite (Exps 1, 2 and 4). Generally, uninfected hosts and more heavily infected hosts were more frequent than expected by chance. We had hypothesized that this was caused by the heterogeneous spatial distribution of paramecia and infectious forms in our static microcosms (Exp. 3). Indeed, shaken microcosms produced higher infection rates than unshaken ones (Exp. 4), presumably because of increased encounter rates. However, static and shaken tubes did not significantly differ in aggregation. In part, this may be due to the low overall infection success in this experiment, and thus low statistical power. Alternatively, the spatial distribution of the paramecia is dynamic, so that exposure to the parasite is homogeneous among host individuals, independent of the heterogeneous vertical distribution of the parasite. However, the present results point to yet another source of heterogeneity. Newly derived host clones showed significantly lower levels of aggregation than did older cultures with the same genetic background. In these clones, which were several months old, genetically or physiologically distinct lineages may have arisen that differ in resistance. This within-population heterogeneity in resistance may cause higher levels of parasite aggregation.
As discussed, within-population heterogeneity may also be induced by previous contact (or infection) with the parasite. Therefore, in the second inoculation in Exp. 2, levels of aggregation in previously exposed populations should have been higher than in control populations. However, this was not the case. Again, the statistical power of this test was low because of the low overall infection success, and it is also possible that this induced heterogeneity contributes relatively little to the observed levels of aggregation. More generally, in clonal organisms, such as Paramecium, effects of host heterogeneity in resistance can be tested explicitly by assembling populations with host clones of variable resistance (e.g. Ben-Ami et al. Reference Ben-Ami, Regoes and Ebert2008b).
Implications
Multiple infection is considered one of the most important evolutionary drivers of parasite life-history and virulence. We have identified genetic and epidemiological (dose and infection history) factors modifying both mean and variance of levels of multiple infection and generating deviations from random mass action predictions. Such deviations can influence population regulation of both host and parasite (Anderson and May, Reference Anderson and May1978; Jaenike, Reference Jaenike1996), but the question arises as to whether they would substantially alter general predictions concerning the role of multiple infection. For example, does a model on multiple infection with random mass action and a given mean of multiple infection differ from a model with the same mean, but a larger variance (i.e. with aggregation)? At least, the situation may become more complicated (McCallum et al. Reference McCallum, Barlow and Hone2001). Aggregated parasites are concentrated in a smaller number of hosts, and this aspect on its own may intensify selection for more competitive parasites. However, a stronger concentration of parasites also reduces prevalence. This may feed back on the force of infection, thereby reducing the frequency of multiple infection and, thus, the intensity of within-host competition (Gandon et al. Reference Gandon, Jansen and van Baalen2001). Changes in the force of infection may also influence optimal levels of resistance in the population (Restif and Koella, Reference Restif and Koella2004), which, in turn, affects the frequency of multiple infection, and so on.
In conclusion, the present results illustrate that there may be no simple, general rule governing the relative importance of multiple infection and within-host selection processes for the evolution of parasite life history (Gandon et al. Reference Gandon, Jansen and van Baalen2001). In some populations it may be more important than in others, depending on their precise ecological, epidemiological or genetic characteristics. How the different factors precisely interact remains to be investigated, both theoretically and experimentally.
This study was supported by a grant “A.C.I. Jeunes Chercheurs du Ministère d'Education et de Recherche” to O.K. We thank Hélène Magalon for statistical advice and two anonymous reviewers for their comments.


