INTRODUCTION
The microsporidia are obligate endocellular parasites related to fungi (Thomarat et al. Reference Thomarat, Vivares and Gouy2004; Vossbrinck et al. Reference Vossbrinck, Andreadis, Weiss, Lindsay and Weiss2004) which infect most animal taxa, and some protists (Canning and Vávra, Reference Canning, Vávra, Lee, Leedale and Bradbury2000). They can reach high prevalence in farm animals and in aquaculture (Weiss, Reference Weiss2005) and are frequently found causing opportunistic infections in immunocompromised humans (e.g. Molina et al. Reference Molina, Sarfati, Beauvais, Lémann, Lesourd, Ferchal, Casin, Lagrange, Modigliani and Derouin1993). In consequence, their study is of economic, veterinary and medical importance (Texier et al. Reference Texier, Vidau, Viguès, El Alaoui and Delbac2010). In addition, microsporidian infections can have strong detrimental effects on the fitness of their hosts (e.g. Stirnadel and Ebert, Reference Stirnadel and Ebert1997; Otti and Schmid-Hempel, Reference Otti and Schmid-Hempel2008; Ryan and Kohler, Reference Ryan and Kohler2010). Hence, they can have a major impact on the demography of natural populations (Ebert et al. Reference Ebert, Lipsitch and Mangin2000).
Microsporidia are frequently found infecting natural populations of the brine shrimp Artemia (Codreanu, Reference Codreanu1957), where they can alter biomass production (Martinez et al. Reference Martinez, Larsson and Morales1989, Reference Martinez, Vivarès, Rocha, Fonseca, Andral and Bouix1992). However, these parasites can be difficult to study due to their small size, and only a few species infecting Artemia spp. have been characterized (Ovcharenko and Wita, Reference Ovcharenko and Wita2005). In this paper, we combine phylogenetic, microscopic and experimental approaches to characterize two ecologically important microsporidian species (Rode et al. Reference Rode, Lievens, Flaven, Segard, Jabbour-Zahab, Sanchez and Lenormand2013). Both species cause infections which are localized in the intestinal epithelium, are small, and hence difficult to detect. To overcome this problem of detection, we developed species-specific molecular markers that allow infections to be detected within 3–6 days post-infection. We did not detect macroscopic signs of infection by these parasites, in contrast to other species where ‘white-spots’ visible to the naked eye often indicate the presence of a microsporidian infection (e.g. Codreanu, Reference Codreanu1957; Martinez et al. Reference Martinez, Larsson, Amat and Vivarès1994). Finally, we demonstrate that both species have a direct life cycle with horizontal transmission between hosts and that they are likely to be specific to the genus Artemia. This study shows that molecular methods are particularly useful to detect and discriminate between cryptic parasites that can remain unnoticed with microscopic techniques, despite being highly prevalent in host populations.
MATERIALS AND METHODS
Molecular detection and characterization
To investigate microsporidiosis, we sampled 133 Artemia parthenogenetica Bowen and Sterling, 1978 and 147 Artemia franciscana Kellogg, 1906 in different salterns around Aigues-Mortes (Southern France) during the summer and winter of 2008. Adult specimens were preserved in 96% ethanol and dried in 96-well plates at 56 °C. DNA was extracted using Sigma Extraction Solution (Sigma, Germany; extraction in 30 μL at 95 °C for 10 min, 20 °C for 10 min, product diluted with 50 μL of sterile deionized water). We screened for microsporidian infection using PCR with microsporidian-specific small subunit (SSU) ribosomal DNA primers (V1f/530r, Baker et al. Reference Baker, Vossbrinck, Maddox and Undeen1994; Weiss et al. Reference Weiss, Zhu, Cali, Tanowitz and Wittner1994). PCR amplifications were carried out in a total volume of 20 μL containing 2 μL of 10X PCR buffer (Eurogentec), 0·5 μ m of each primer, 1·8 mm MgCl2, 1 mm dNTPs (Eurogentec), 1 U of RedGoldStar® Taq polymerase (Eurogentec) and 1 μL of DNA extract. A negative control (PCR mix alone) was included on each extraction plate. The thermal profile consisted of a 2 min initial stage at 94 °C, followed by 35 cycles at 94 °C for 30 s, 60 °C for 1 min, and 72 °C for 2 min, with a final extension at 72 °C for 5 min. 5 μL of the PCR product was separated by electrophoresis on a 2% agarose gel containing 0·5 lg mL−1 GelRed™ (Biotium, USA) and visualized under UV light. The quality of the DNA template was checked by an additional PCR on all samples using host microsatellite primers (Apdq02TAIL/EU888845, Af-B10/EU 888838, Muñoz et al. Reference Muñoz, Green, Figuerola, Amat and Rico2008); negative samples were excluded from analysis. 67 positive PCR products were sequenced using an ABI prism 3130xl genetic analyser with an ABI Prism Big Dye Terminator Kit (Applied Biosystems, Warrington, UK). Approximately 340 bp of SSU rDNA sequence was generated for each parasite isolate; from these we detected two divergent sequences identified as Microsporidium 1 and 2 (hereafter Msp1 and Msp2). Each microsporidian sequence was found in both Artemia host species. Species-specific primer sets were designed to amplify the Msp1 and Msp2 sequences (Msp1p2f/Msp1p3r and Msp2p1f/Msp2p3r respectively, Table 1).
Table 1. Description of species-specific (Msp1p2f/Msp1p3r and Msp2p1f/Msp2p3r) and universal (734F/1537R) primers used to amplify partial SSU rDNA regions from the Msp1 and Msp2 microsporidian parasites

a Vossbrinck et al. (Reference Vossbrinck, Baker, Didier, Debrunner-Vossbrinck and Shadduck1993).
b The length of the sequences amplified with the 734F/1537R primers varied between Msp1 (∼520 pb) and Msp2 (∼530 bp).
Phylogenetic analyses
To investigate Msp1 and Msp2 phylogeny, we sequenced an additional, larger fragment (∼1250 bp) of the SSU rRNA using nested PCRs. We first amplified a fragment with the V1F/1537R primers (Vossbrinck et al. Reference Vossbrinck, Baker, Didier, Debrunner-Vossbrinck and Shadduck1993) in two Msp1-infected individuals and one Msp2-infected individual. We subsequently amplified nested fragments with the V1F/HG4R primers (Vossbrinck et al. Reference Vossbrinck, Baker, Didier, Debrunner-Vossbrinck and Shadduck1993; Gatehouse and Malone, Reference Gatehouse and Malone1998) and the 734F/1537R primers (Table 1). Sequences were blasted against GenBank sequences. To construct the tree, we selected the closest matches consisting of characterized microsporidian sequences (Vossbrinck and Debrunner-Vossbrinck, Reference Vossbrinck and Debrunner-Vossbrinck2005; Wang et al. Reference Wang, Solter, T'sui and Wang2005; Tourtip et al. Reference Tourtip, Wongtripop, Stentiford, Bateman, Sriurairatana, Chavadej, Sritunyalucksana and Withyachumnarnkul2009; Stentiford et al. Reference Stentiford, Bateman, Small, Moss, Shields, Reece and Tuck2010, Reference Stentiford, Bateman, Dubuffet, Chambers and Stone2011), and also used Msp2 sequences from Israel and the USA, which were found in a phylogeographic study of Msp1 and Msp2 (Rode et al. submitted). All sequences are given in Table S1 – in Online version only. Thelohania parastaci was used as an outgroup. Sequences were aligned using the ClustalW algorithm in BioEdit v7.0.9 (http://www.mbio.ncsu.edu/bioedit/bioedit.html). To objectively remove ambiguously aligned regions, the online version of the program Gblocks (Castresana, Reference Castresana2000, www.phylogeny.fr) was first applied to the full dataset, allowing small final blocks and relaxed flanking regions (final length ∼342 bp). A more stringent option (i.e. allowing large final blocks and strict flanking regions) was also used to analyse a restricted dataset including only sequences longer than 1 kb (excluding the following sequences: Hepatospora spp., Enterospora canceri, Enterocytozoon hepatopenaei and Myospora metanephrops, final length ∼720 bp). We determined the best model for the base frequencies and substitution rates based on AICc using jModelTest 2.1.1 (TrN model with a gamma variation of mutation rate across sites, and including a fitted proportion of invariable sites for the complete dataset; Guindon and Gascuel, Reference Guindon and Gascuel2003; Darriba et al. Reference Darriba, Taboada, Doallo and Posada2012). Maximum likelihood analyses were carried out using Phyml v3.0 (Guindon et al. Reference Guindon, Dufayard, Lefort, Anisimova, Hordijk and Gascuel2010) and the robustness of nodes was assessed with 100 bootstrap replications. Mean pairwise genetic distances between Msp1/Msp2 and their related monophyletic clades (for which several sequences were available) were calculated using Mega 5 (Tamura et al. Reference Tamura, Peterson, Peterson, Stecher, Nei and Kumar2011) using the Kimura 2-parameter model with gamma variation across sites. Sequences of the newly characterized lineages (Msp1: JX915758, JX915759; Msp2: JX915760) have been deposited in GenBank.
Light and transmission electron microscopy
To characterize the two microsporidian species, we established laboratory cultures infected either with Msp1 or Msp2, using wild-caught samples. As both Msp1 and Msp2 cannot be vertically transmitted through cysts (Rode et al. Reference Rode, Lievens, Flaven, Segard, Jabbour-Zahab and Lenormandin press), we established uninfected laboratory cultures with nauplii hatched from cysts isolated from two populations (Site 9, 2010, N43°32′25″-E4°13′26″, Pont l'Abbé, 2011, N43°32′40″-E4°9′17). Three A. parthenogenetica females infected with Msp1 and three A. franciscana females infected with Msp2 were used for microscopy analyses. Two A. parthenogenetica and two A. franciscana females from uninfected cultures were used as negative controls. Each female was cut in half; the anterior part was PCR-tested to confirm infection status and the posterior part was fixed in 2·5% glutaraldehyde in Sorensen's buffer (0·1 m, pH 7·4) and kept overnight at 4 °C. Specimens were washed in Sorensen's buffer and post-fixed in the dark for 2 h, in 0·5% osmium tetroxide at room temperature. After washing in three changes of Sorensen's buffer, the specimens were dehydrated in a graded ethanol series (30–100%) before being embedded in EMbed-812 (Electron Microscopy Sciences, Fort Washington, USA) using an Automated Microwave Tissue Processor for Electronic Microscopy (Leica EM AMW, Bensheim, Germany). Semi-thin (1 μm) and ultra-thin sections (70 nm, Leica-Reichert Ultracut E) were collected at different levels of each block. Semi-thin sections were stained with toluidine blue to identify suitable target areas with a light microscope. Ultra-thin sections of these areas were mounted on uncoated copper grids and counterstained with uranyl acetate and subsequently observed using a Hitachi 7100 transmission electron microscope (TEM) at the Centre de Ressources en Imagerie Cellulaire (CRIC, Montpellier, France). We examined different tissues (hypoderm, musculature, intestinal epithelium, ovaries), as well as the haemocoel of each infected individual. Measurements were made using the on-board calibrated measuring software of the TEM.
Transmission mode and life cycle of Msp1 and Msp2
A complete and rational classification of microsporidia requires that the description of new species includes information on their life cycle and transmission behaviour (Becnel, Reference Becnel1992). These characteristics are also important for our understanding of the ecology and evolution of this group. First, in order to test for horizontal transmission of infection between hosts, we placed ∼20 individuals from uninfected cultures in 10-L tanks containing a mix of A. franciscana individuals from cultures infected either by Msp1 or Msp2 (replicated three times). Hence, transmission could occur through the ingestion of spores released from the decomposing tissues of dead hosts and/or from spores released with the faeces of living hosts. After 3 weeks, five A. parthenogenetica individuals from each tank were randomly selected and PCR-tested. Second, in order to test for vertical transmission of infection to Artemia spp. nauplii, we isolated cultured A. parthenogenetica females of known infection status (n(Msp1)=6), n(Msp2)=6) and wild-caught A. parthenogenetica (n=4) and A. franciscana (n=9) females of unknown infection status. All females were maintained individually (A. parthenogenetica females) or with males (A. franciscana females) in 300 mL jars filled with 50 g L−1 artificial seawater (Instant Ocean, Aquarium Systems, Mentor, Ohio). To prevent horizontal transmission, jars were checked twice daily and any newborn nauplii were immediately transferred to new medium, after which the female was killed and preserved in 96% ethanol. 220 nauplii were recovered. To maximize the chance of detecting microsporidian infection, PCR tests were performed on pools of 3 to 5 sibling individuals of different ages (mean=16·4 d, min=0 d, max=38 d).
In order to investigate the possibility that these parasites infect other hosts co-occurring with Artemia in the Aigues-Mortes salterns, we used PCR to test for the presence of infection in heterotrichous cilitates (n=20), harpacticoida copepods (n=6) and Potamonectes cerisyi beetles (n=2). Host DNA quality was checked using universal primers for the COI mitochondrial gene (LCO1490/HCO2198, Folmer et al. Reference Folmer, Black, Hoeh, Lutz and Vrijenhoek1994).
Visible signs of infection
Artemia often exhibit ‘white-spots’ upon microsporidian infection (Codreanu, Reference Codreanu1957; Martinez et al. Reference Martinez, Vivarès, Rocha, Fonseca, Andral and Bouix1992, Reference Martinez, Larsson, Amat and Vivarès1994). Since Artemia in Aigues-Mortes exhibit such white-spots on their cuticle or in the posterior part of their digestive tracts, we investigated association of these symptoms with Msp1 and/or Msp2 infection. We sampled A. parthenogenetica and A. franciscana individuals (n=1243) in three salterns in Aigues-Mortes in May 2011 and recorded the presence of white-spots on the cuticle and in the digestive tract using a stereomicroscope. Upon observation, individuals were killed and placed in ethanol in 96-well plates and PCR-tested for Msp1 and Msp2 infection using the aforementioned species-specific primers. We analysed the presence of white-spots on the cuticle and digestive tract separately using generalized linear models with a Bernoulli distribution (package ‘stats’ in R 2.14.2). We tested the influence of Msp1 and Msp2 infection, host species and their interactions using likelihood ratio tests.
Timing of Msp1 and Msp2 detection by PCR
To measure the latency of PCR detection after infection, we placed 20 A. parthenogenetica and 20 A. franciscana uninfected recipient individuals in contact with 30 Msp1-, 30 Msp2-infected and 20 co-infected donor individuals. To get an average latency across different host genetic backgrounds, we used recipient hosts from different populations (A. franciscana and A. parthenogenetica: Aigues-Mortes, France, A. parthenogenetica: LaMata, Spain. A. franciscana: San Francisco Bay, CA, USA). Donors were kept above recipients in the water column using a tank with two compartments separated by nylon mesh (0·2 mm), which allowed microsporidian spore contamination, but prevented donor and recipient hosts from mixing. After 2 days, half of the recipients were killed and placed in ethanol (Treatment 1, Exposure and Incubation Day 1–2, Fig. 1). The remaining recipients were placed in new medium in the absence of donors for another 4 days (Treatment 2, Exposure and Incubation Day 1–2 + Incubation Day 3–6, Fig. 1). We also placed uninfected individuals in similar tanks for 6 continuous days, in the presence (Treatment 3, Exposure and Incubation Day 1–2+Incubation Day 3–6+Exposure Day 3–6, Fig. 1) or absence (Control) of infected donor individuals (n=20 and 10, respectively). Treatments and controls were replicated twice. All recipient individuals were PCR-tested for infection by Msp1 or Msp2 using the above-mentioned species-specific primers. We analysed the probability of detection using generalized linear models with a binomial distribution (package ‘Stats’ in R 2.14.2). More specifically, we introduced three indicator variables nested within treatments: Exposure and Incubation Day 1–2, Incubation Day 3–6, Exposure Day 3–6, which reflect the increasing chance of infection in the control, treatment 1, treatment 2 and treatment 3. We tested whether each of these variables was significantly different from zero using likelihood ratio tests and we checked for overdispersion in the best model.

Fig. 1. Timing of Msp1 and Msp2 detection by PCR. In the control, individuals were kept isolated in the absence of infected donors (Control). For all other treatments, recipient hosts (Uninf.) were placed underneath infected hosts (Inf.) for 2 days. After these 2 days, 25% of the recipient hosts were killed and conserved in ethanol (Treatment 1), 25% were kept isolated in the absence of infected donors for 4 additional days (Treatment 2), and the remaining 50% were kept with infected donors for 4 additional days (Treatment 3). Detection time was investigated by comparing the reference control (Ctrl) to three indicator variables (Var1: Exposure and incubation Day 1–2, Var2: Incubation Day 3–6, Var3: Exposure Day 3–6). All treatments were replicated twice.
RESULTS
Detection and prevalence
As explained above, we successfully developed primers specific to Msp1 and Msp2. These primers were used to estimate the prevalence of Msp1 and Msp2 in the original sample (147 A. franciscana and 133 A. parthenogenetica). The two parasites were highly prevalent: 39·5% in A. franciscana, 75·2% in A. parthenogenetica for Msp1; 52·4% in A. franciscana, 21·8% in A. parthenogenetica for Msp2.
Phylogeny
We recovered 1211 and 1238 bp SSU fragments (excluding the V1F and 1537R primer sites) for the longest sequences of Msp1 and Msp2, respectively. The phylogenetic reconstruction based on all well-known related taxa indicated that: (1) Msp1 and Msp2 were included in a microsporidian clade comprised of species infecting mostly the intestinal epithelium of insect and crustacean hosts (Fig. 2). (2) Msp1 belonged to a group including well-known species from the Endoreticulatus and Cytosporogenes genera known to mainly infect the gut epithelium of insects (Group 1, Fig. 2). Msp1 divergence with these two genera was low (average divergence of 3·5% with Endoreticulatus species and 6·6% with Cytosporogenes species, Table S2 – in Online version only). Molecular divergence with other species from this group was similar (∼6·0%, Table S2). (3) Msp2 was closely related to a first group, which included the genera Endoreticulatus and Cytosporogenes along with Msp1, and to a second group including different genera: Nucleospora, Paranucleospora, Desmozoon, Enterocytozoon, Enterospora, Hepatospora (Group 1 and Group 2, respectively, Fig. 2). Msp2 was twice as divergent from Group 2 as from Group 1 (22·5 and 11·7% respectively, Table S3 – in Online version only), which was likely due to a higher rate of molecular evolution within Group 2 (Fig. 2). (4) The exclusion of short sequences revealed that Group 1, 2 and Msp2 were a sister group to Group 3 including Orthosomella and Libermannia species (Fig. S1 – in Online version only). The latter species were on average more divergent from Group 1 and Group 2 than from Msp2 (18·5, 21·9 and 14·5% respectively, Table S3). Overall, phylogenetic positions were qualitatively similar when excluding shorter sequences (Fig. S1).

Fig. 2. Maximum likelihood tree of the SSU rDNA of Msp1 and Msp2 along with related microsporidian species infecting crustacean and non-crustacean hosts. Names of species infecting the digestive tract epithelium appear in bold. The host species of undescribed microsporidia appear between parentheses. Numbers above branches indicate bootstrap supports from 100 resamplings (only values above 70 are reported). Bootstrap supports for the two nodes showing Msp2 as a sister species to Group 2 and Group 3 as a sister taxa to Group 1 were very low (32% and 36% respectively).
Light and transmission electron microscopy study of Msp1 (Anostracospora rigaudi n. g., n. sp.)
The results from the light and TEM microscopy are summarized in Table S4 – in Online version only. Semi-thin sections of Msp1-infected individuals (as checked by PCR) were examined for tissue infection using light microscopy. Msp1 infections were restricted to enterocytes. Parasitophorous vacuoles filled the space between the nucleus and the brush border (Fig. 3A). The number of mature spores in parasitophorous vacuoles estimated from sections ranged between 32 and 64 (Fig. 3B and C). Enterocytes with parasitophorous vacuoles were released in the intestinal lumen (Fig. 3D). Free parasitophorous vacuoles including immature and mature spores were also shed in the intestinal lumen (Fig. 3E). Msp1-infected cells were not hypertrophied. TEM observations confirmed the localization of Msp1 in the intestinal epithelium. The earliest stages observed were unikaryotic ribosome-rich meronts delimited by a single cytoplasmic membrane (Fig. 4A). Initial merogony did not involve a parasitophorous vacuole and occurred in direct contact with host cell cytoplasm (Fig. 4A). Merogonial divisions could not be observed, but likely occurred by plasmotomy of a merogonial plasmodium (Fig. 4B). The number of successive merogonial divisions could not be determined. Sporogony started with the development of a spore wall primordium that progressively thickened (Fig. 4C and D). Sporonts were also unikaryotic (Fig. 4B and D). They developed within a parasitophorous vacuole (Fig. 4D), sometimes together with meronts (Fig. 4B). Sporoblasts were likely to divide by plasmotomy of a sporogonial plasmodium, as suggested by the constriction in Fig. 4E. Sporoblast maturation involved an increased ribosome concentration resulting in electron-dense late sporoblasts (Fig. 5A–C). Sporoblasts with a developing invasion apparatus were sometimes observed together with mature spores in the same parasitophorous vacuole (Fig. 5A). Spores were unikaryotic and oval; their size was small: 1·3×0·7 μm. The Msp1 polaroplast comprised an external lamellar part (Fig. 5D and F) and an internal vesicular part (Fig. 5G). Spore walls had a reduced thickness (55 nm, Fig. 5D, E and G) and consisted of an internal, electron-lucent chitinous endospore (40 nm) and a thinner external electron-opaque exospore (15 nm). Spore wall thickness was reduced to 25 nm at the apex of the spore (Fig. 5F and G). The polar tube (60-nm diameter) was isofilar with five or six coils aligned in one or two rows (Fig. 5C and E).

Fig. 3. Light micrographs of semi-thin sections showing Msp1 (Anostracospora rigaudi n. g., n. sp.) infecting the intestinal epithelium of Artemia parthenogenetica. (A) Parasitophorous vacuoles (arrowheads) within an enterocyte (E) containing immature and mature spores. Release of parasitophorous vacuoles (arrows) into the intestinal lumen (IL). Scale bar=2·5 μm. (B and C) Parasitophorous vacuoles with sporoblasts and mature spores. Scale bar=2 μm. (D) Enterocyte containing a parasitophorous vacuole being shed into the intestinal lumen (IL). N: nucleus. Scale bar=3 μm. (E) Parasitophorous vacuole (arrow) released into the intestinal lumen (IL), containing both early (white arrowhead) and late (black arrowhead) microsporidian stages. N: nucleus. Scale bar=2·5 μm.

Fig. 4. Transmission electron micrographs of Msp1 (Anostracospora rigaudi n. g., n. sp.) infecting the intestinal epithelium of Artemia parthenogenetica. (A) Four uninucleate meronts (M) limited by a cytoplasmic membrane (arrowhead) in direct contact with host cell cytoplasm. N: nucleus; HCN: host cell nucleus. Scale bar=500 nm. (B) Parasitophorous vacuole (arrows) filled with meronts (M) and sporonts (Sp) (the former likely resulting from merogonial division by plasmotomy, arrowheads). HCN: host cell nucleus. Scale bar=500 nm. An enlargement of the rectangular area is shown on micrograph C. (C) Membrane of the parasitophorous vacuole (arrow), meront (M) cytoplasmic membrane (white arrowhead) and sporont (Sp) cytoplasmic membrane coated with a thick sporont wall (black arrowhead). Scale bar=200 nm. (D) Uninucleate sporont with a thick membrane (black arrowhead) within a parasitophorous vacuole (arrow). Scale bar=500 nm. (E) Early uninucleate sporoblasts (Sb) likely resulting from sporogonial division by plasmotomy (arrowhead) within a parasitophorous vacuole (arrow). N: nucleus. Scale bar=500 nm.

Fig. 5. Transmission electron micrographs of Msp1 (Anostracospora rigaudi n. g., n. sp.) infecting the intestinal epithelium of Artemia parthenogenetica. (A) Uninucleate sporoblasts (Sb) with a developing polar tube (PT) together with mature spores (S) within a parasitophorous vacuole (arrow). N: nucleus. Scale bar=500 nm. (B) Sporoblasts showing developing rolled polar tube (PT) within a parasitophorous vacuole (arrow). Scale bar=500 nm. (C) Sporoblast showing a polar tube with 6 coils. Scale bar=100 nm. (D) Apex of a mature spore showing the polar cap (PC), the anchoring disc (AD) and the lamellar polaroplast (LP). Scale bar=100 nm. (E) Detail of a mature spore with 5 polar tube coils aligned in 2 rows (PT) and a spore wall comprising the thick electron-lucent chitinous endospore (En) and the thin electron-dense exospore (Ex). Scale bar=100 nm. (F) Apex of the spore showing the spore wall (SpW), the anchoring disc (AD), the lamellar polaroplast (LP) and the manubrium of the polar tube (PTM) of a mature spore. Scale bar=100 nm. (G) Apex of the spore showing the spore wall (SpW), the polar cap (PC) and the vesicular polaroplast (VP). Scale bar=100 nm.
Light and transmission electron microscopy study of Msp2 (Enterocytospora artemiae n. g., n. sp.)
Semi-thin sections of Msp2-infected individuals (as checked by PCR) were examined for tissue infection using light microscopy. Msp2 infections were restricted to enterocytes. Parasitophorous vacuoles filled the space between the nucleus and the brush border (Fig. 6A).

Fig. 6. Light micrographs of semi-thin sections showing Msp2 (Enterocytospora artemiae n. g., n. sp.) infecting the intestinal epithelium of Artemia franciscana. (A) Parasitophorous vacuole (arrow) within an enterocyte. N: Nucleus; IL: intestinal lumen. Scale bar=3 μm. (B) Parasitophorous vacuole with immature (white arrowhead) and mature (black arrowhead) spores. Scale bar=2 μm. (C) Parasitophorous vacuole (arrow) containing a parasite stage with two nuclei. HCN: host cell nucleus. Scale bar=2 μm. (D) Parasitophorous vacuole (arrow) containing mainly mature spores (estimated as up to 55 in sections) shed into the intestinal lumen (IL). HCN: host cell nucleus. Scale bar=3 μm. (E) Parasitophorous vacuoles (arrow) released together into the intestinal lumen (IL). E: enterocyte; HCN: host cell nucleus. Scale bar=2·5 μm.
The number of immature and mature spores in parasitophorous vacuoles estimated from sections ranged between 64 and 128 (Fig. 6B, D and E). Enterocytes with parasitophorous vacuoles were released in the intestinal lumen (Fig. 6D). Free parasitophorous vacuoles were also observed in the intestinal lumen (Fig. 6E). TEM observations confirmed the localization of Msp2 in the intestinal epithelium. The earliest stages observed were unikaryotic ribosome-rich meronts delimited by a single cytoplasmic membrane (Fig. 7A) and included in a parasitophorous vacuole (Fig. 7A and B). Merogonial divisions occurred by binary fission, as suggested by the occurrence of meronts with only two nuclei (Fig. 7C). The number of merogonial divisions could not be estimated. Sporonts and further developmental stages were found within a parasitophorous vacuole (Fig. 7D and E). Sporogonial division occurred by plasmotomy (Fig. 7D). Sporoblasts were found in the same vacuole as meronts and sporonts, showing an important delay in the developmental cycle (Fig. 8A), while mature spores were found in the same vacuole as late sporoblasts (Fig. 8D). Sporoblasts were uninucleate and appeared darker than meronts (Fig. 8A and B). Sporoblast maturation was characterized by the development of the invasion apparatus including the anchoring disc and the polar tube (Fig. 8B and E). The polar tube comprised a straight anterior part (manubrium) and a rolled posterior part (Fig. 8E). The polaroplast developed secondarily in late sporoblasts (Fig. 8D, F and G). Spores were unikaryotic, subspherical and small (1·2×0·9 μm). Spore walls were 80 nm thick (Fig. 8H and I) and consisted of an external electron-dense exospore (15 nm) and an internal electron-lucent chitinous endospore (65 nm). Spore wall thickness was reduced to 45 nm at the apex of the spore (Fig. 8H). The polar tube (100 nm diameter) was isofilar with four coils aligned in one row (Fig. 8F). The polaroplast comprised an internal lamellar part (Fig. 8H and I) and a very large external vesicular part (Fig. 8H and I; the low resolution of the polaroplast structures might be due to the low concentration of osmium tetroxide used for the post-fixation).
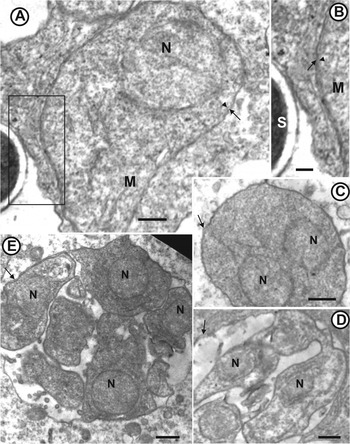
Fig. 7. Transmission electron micrographs of Msp2 (Enterocytospora artemiae n. g., n. sp.) infecting the intestinal epithelium of Artemia franciscana. (A) Ribosome-rich uninucleate meront (N: nucleus) with a cytoplasmic membrane (arrowhead) and included within a parasitophorous vacuole (arrow). Scale bar=500 nm. An enlargement of the rectangular area is shown on micrograph B. (B) Cytoplasmic membrane (arrowhead) of the meront (M) and parasitophorous vacuole (arrow). S: mature spore. Scale bar=220 nm. (C) Meront with two nuclei (N), likely resulting from a binary division. Arrow: parasitophorous vacuole. Scale bar=500 nm. (D) Chain of uninucleate sporonts resulting from the division of a sporontal plasmodium by plasmotomy. Arrow: parasitophorous vacuole; N: nucleus. Scale bar=500 nm. (E) Parasitophorous vacuole (arrow) with uninucleate sporonts in section. N: nucleus. Scale bar=500 nm.

Fig. 8. Transmission electron micrographs of Msp2 (Enterocytospora artemiae n. g., n. sp.) infecting the intestinal epithelium of Artemia franciscana. (A) Uninucleate meront (M), sporont (Sp) and early sporoblasts (ESb) within the same parasitophorous vacuole (arrow). N: nucleus. Scale bar=500 nm. (B) Uninucleate early sporoblast with developing polar tube (PT) and anchoring disc (AD). SpW: sporont wall; N: nucleus. Scale bar=200 nm. (C) Enlargement of the early sporoblast in B, showing the cytoplasmic membrane (arrowhead) coated with a thick continuous sporont wall (SpW). Scale bar=100 nm. (D) Electron-dense late sporoblasts (LSb) with developing polar tube (PT) and anterior part of the invasion apparatus (AD: anchoring disc, P: polaroplast). Parasitophorous vacuole (arrow) including late sporoblasts (LSb) and spores (S) ejected into the intestinal lumen. V: intestinal villi. Scale bar=500 nm. (E) Early sporoblast with developing anchoring disc (AD) and polar tube (PT) around the nucleus (N). Scale bar=500 nm. (F) Late sporoblast with a developing polar tube manubrium (PTM), anchoring disc (AD) and vesicular polaroplast (VP) at the apex. At the posterior part, 6 coils of the polar tube (PT) are aligned in one row. Scale bar=500 nm. (G) Apex of a late ribosome-rich sporoblast with a developing invasion apparatus (AD: anchoring disc; PTM: polar tube manubrium) and a polaroplast (P). Scale bar=100 nm. (H) Uninucleate mature spore with a section of the polaroplast at the apex (LP: lamellar polaroplast; VP: vesicular polaroplast). PV: posterior vacuole; En: electron-lucent chitinous endospore; Ex: electron-dense exospore. Scale bar=100 nm. (I) Spore cytoplasmic membrane (arrow) and spore wall composed of the endospore (En) and the exospore (Ex). A transversal section of the polar tube (arrowhead) is surrounded by the cytoplasm and the lamellar polaroplast (LP). Scale bar=100 nm.
Transmission mode and life cycle of Msp1 and Msp2
Three weeks after their introduction into the tanks containing Msp1- or Msp2-infected A. franciscana individuals, the prevalence of infection in A. parthenogenetica hosts was 100 and 70% respectively (n=5 individuals tested per tank). Hence, horizontal transmission seemed to be efficient for both Msp1 and Msp2. Transmission probably resulted from filter-feeding of spores released in the faeces of infected hosts, as in related microsporidia (Ebert et al. Reference Ebert, Lipsitch and Mangin2000).
We examined the progeny of 25 potentially infected females to investigate whether they would transmit infection vertically. A posteriori verification of their infection status revealed that 5 A. parthenogenetica females were infected by Msp1, 7 A. parthenogenetica and 4 A. franciscana females were infected by Msp2, and 9 females (4 A. parthenogenetica and 5 A. franciscana) were not infected. No infection was found in the 32 nauplii produced by Msp1-infected females. Hence vertical transmission of Msp1 to nauplii was unlikely. Regarding Msp2, one pool of 3 nauplii was detected as being infected, among the 128 nauplii tested. This might indicate rare vertical transmission. However, the other 7 siblings of the positive nauplii were not infected, which is at odds with the usual finding that the vertical transmission of microsporidia is correlated at the within-clutch level (e.g. Dunn and Hatcher, Reference Dunn and Hatcher1997). Furthermore, we did not see or detect any infection in the ovaries. This mode of transmission has not been described for gut microsporidia in related groups (Groups 1, 2, Fig. 2) and is inconsistent with the overall biology of the microsporidia infecting these tissues. Hence our finding is more likely to result from DNA contamination or early horizontal transmission before nauplii were isolated rather than from vertical transmission per se. We conclude that both microsporidian species are likely to be exclusively horizontally transmitted.
Although sample sizes were limited, we did not detect Msp1 or Msp2 infections in the few other species co-occurring with Artemia in the Aigues-Mortes salterns. Both microsporidia are therefore likely to be specific to the Artemia genus and to have direct life cycles.
Visible signs of infection
The presence of white-spots on the cuticle differed between A. parthenogenetica and A. franciscana, as A. parthenogenetica individuals were three times more likely to display white-spots (P<0·01, Table 2). However, the presence of white-spots on the cuticle did not depend on infection by either Msp1 or Msp2 (P>0·05, Table 2). Similarly, the presence of white-spots in the posterior part of the digestive tract was independent of host species and of infection by Msp1 or Msp2 (P>0·05, Table 2). Overall, there was no association between white-spots and Msp1 or Msp2 infection.
Table 2. Analyses of the presence of white-spots on the cuticle (A) or on the posterior part of the digestive tract (B)

** P<0·01.
Timing of Msp1 and Msp2 detection by PCR
In the infection experiments, some individuals in the negative controls were found to be infected with Msp1 (Table 3), and subsequent tests of the laboratory cultures used to supply the uninfected hosts for the experiment revealed that one A. parthenogenetica culture was infected with Msp1. However, this Msp1-contamination did not affect our conclusions, as the effects of the three indicator variables were calculated relative to the controls. The proportion of Msp1- or Msp2-infected individuals, as detected by PCR, did not increase after 2 days of exposure to the parasite (Exposure and Incubation Day 1–2, P>0·05, Table 3). In contrast, for both Msp1 and Msp2, this proportion increased strongly after the 4 days of additional incubation (Incubation Day 3–6, P<0·001, Table 3). This result demonstrates that Msp1 and Msp2 DNA is detectable by PCR between 3 and 6 days post-inoculation. Lastly, the proportion of Msp1- or Msp2-infected individuals was similar when individuals were continuously exposed to parasites throughout days 1–6 and when individuals were only exposed for days 1–2 and subsequently isolated (Exposure Day 3–6, P>0·05, Table 3). Two non-exclusive hypotheses could explain this result. First, infection probability could differ between individuals, all susceptible individuals being infected in the first 2 days with no subsequent infection. Second, infection could be undetectable until 5–6 days post-inoculation, with only early-infected individuals being detected in all treatments.
Table 3. Analyses of Msp1 (A) and Msp2 (B) spore detection probability. Intercepts represent detection probability in the control (logit scale). The three variables are given relative to the intercept and were fitted using the control and the three treatments (Treatment 1: Exposure and Incubation Day 1–2, Treatment 2: Exposure and Incubation Day 1–2+Incubation Day 3–6, Treatment 3: Exposure and Incubation Day 1–2+Incubation Day 3–6+Exposure Day 3–6)
*** P<0·001.
DISCUSSION
Phylogenetic analyses indicate that both Msp1 and Msp2 belong to a clade of microsporidia that mostly infect the intestinal epithelium of arthropods (insects and crustaceans). Light and ultrastructural examination of Msp1- and Msp2-infected hosts confirmed that only the gut is affected.
Comparison of Msp1 and Msp2 with other microsporidia infecting Artemia
Only two of the six known microsporidian species infecting Artemia spp. are gut-specific (Ovcharenko and Wita, Reference Ovcharenko and Wita2005). The first species, Unikaryon exiguum, infects Romanian A. parthenogenetica and is morphologically similar to Glugoides intestinalis (previously named Pleistophora intestinalis, Codreanu, Reference Codreanu1957). However, the size of the spores is larger in U. exiguum (3·2–2·6 μm) than in Msp1 and Msp2 (1·3–0·7 μm for Msp1, 1·2–0·9 μm for Msp2). Unikaryon exiguum also differs from Msp2 as its parasitophorous vacuole appears only during merogony and its sporonts divide by binary fission (Codreanu and Codreanu-Balcescu, Reference Codreanu and Codreanu-Balcescu1980). The second intestinal species is Ordospora duforti (previously named Endoreticulatus duforti, Martinez et al. Reference Martinez, Vivarès and Bouix1993; Larsson et al. Reference Larsson, Ebert and Vávra1997), whose meronts have rosette-like division, in contrast to Msp2 whose meronts divide by binary fission. Ordospora duforti also has different spore features when compared with Msp1 and Msp2: the spore wall is twice as thick (140–150 nm for O. duforti vs. 55 and 80 nm for Msp1 and Msp2, respectively) and the number of polar tube coils and rows is greater (2 rows, 8–11 coils for O. duforti, 1–2 rows, 6 coils for Msp1 and 1 row, 4 coils for Msp2). Msp1 and Msp2 are also different from the other microsporidian species known to infect Artemia. Nosema artemiae is clearly different as it remains diplokaryotic during the whole cycle (Martinez et al. Reference Martinez, Larsson, Amat and Vivarès1994). Gurleya dispersa and Pleistophora myotropha do not infect the gut but the haemocoel and muscle tissue, respectively (Codreanu, Reference Codreanu1957). The spore sizes of both species are also larger (5·0–5·9 μm for G. dispersa and 5·5–6·9 μm for P. myotropha). Finally, Vavraia anostraca infects the haemocoel and musculature in addition to the gut (Martinez et al. Reference Martinez, Vivarès, Rocha, Fonseca, Andral and Bouix1992), and has different morphological features (merogonial division by plasmotomy, dimorphic oval spores with 2·8–3·5 μm-long microspores, anisofilar polar tube with 12–18 coils). Hence, this is the first report of Msp1 and Msp2 infection in Artemia species.
Characterization of Anostracospora rigaudi n. g., n. sp. and Enterocytospora artemiae n. g., n. sp.
Phylogenetic analyses based on the SSU rDNA revealed that Msp1 and Msp2 are related to three groups of microsporidia (Fig. 2). Msp1 is included in the first group, along with various gut-infecting species and two species that do not infect gut epithelia (Mrazekia macrocyclopis and Vittaforma corneae; Silveira and Canning, Reference Silveira and Canning1995; Issi et al. Reference Issi, Tokarev, Voronin, Seliverstova, Pavlova and Dolgikh2010). Hence, we will only compare Msp1 to other gut microsporidia from Group 1: Endoreticulatus schubergi (Cali and Garhy, Reference Cali and Garhy1991), Cystosporogenes operophterae (Canning et al. Reference Canning, Barker, Nicholas and Page1985; Canning and Curry, Reference Canning and Curry2004), Crispospora chironomi (Tokarev et al. Reference Tokarev, Voronin, Seliverstova, Pavlova and Issi2010) and G. intestinalis (Larsson et al. Reference Larsson, Ebert, Vávra and Voronin1996). Msp1 differs from these species as its parasitophorous vacuole develops only during sporogony. The number of sporoblasts in the parasitophorous vacuole is intermediate in Msp1 (32–64) compared with G. intestinalis (16), E. schubergi (32) and C. operophterae (>128); no data are available for C. chironomi. Msp1 has the smallest spores in the group (1·3×0·7 μm, compared with 2·5×1·5 μm for E. schubergi, 2·7×1·6 μm for C. operophterae, 2·4–2·7×1·1–1·7 μm for G. intestinalis and 2×1·5 μm/2·5×1·5 μm for the first and second type of spores of C. chironomi, respectively). The thickness of the spore wall of Msp1 (55 nm) is comparable to that of C. chironomi (60 nm) and E. schubergi (50 nm), but thinner than the spore wall of G. intestinalis (80–85 nm) and C. operophterae (125 nm). C. chironomi, G. intestinalis and Msp1 have few coils (4, 5 and 5–6, respectively), as compared with E. schubergi (7–9) and C. operophterae (10–12). The polar tube diameter is similar in Msp1, C. chironomi and G. intestinalis (60, 85 and 77–85 nm, respectively), but smaller than in E. schubergi (100 nm) and C. operophterae (120 nm). Interestingly, the parasitophorous vacuole of Msp1 is persistent and remains intact when excreted with spores in the intestinal lumen. Such a persistent vacuole has also been described in Cystosporogenes (Kleespies et al. Reference Kleespies, Vossbrinck, Lange and Jehle2003), but is absent in the related E. schubergi where the fragile parasitophorous vacuole disappears in late sporogony (Cali and Garhy, Reference Cali and Garhy1991).
Msp2 is related to Group 1, 2 and 3 (Fig. 2). We compare Msp2 to a subset of species from Groups 1, 2 and 3: Msp1, G. intestinalis (Larsson et al. Reference Larsson, Ebert, Vávra and Voronin1996) (Group 1), Desmozoon lepeophterii (Freeman and Sommerville, Reference Freeman and Sommerville2009), Enterocytozoon bieneusi (Desportes et al. Reference Desportes, Charpentier, Galian, Bernard, Cochand-Priollet, Lavergne, Ravisse and Modigliani1985), E. hepatopenaei (Tourtip et al. Reference Tourtip, Wongtripop, Stentiford, Bateman, Sriurairatana, Chavadej, Sritunyalucksana and Withyachumnarnkul2009), Hepatospora eriocheir (Stentiford et al. Reference Stentiford, Bateman, Dubuffet, Chambers and Stone2011) (Group 2), Libermannia covasacrae (Sokolova et al. Reference Sokolova, Lange, Mariottini and Fuxa2009), Orthosomella operophterae (Canning, Reference Canning1960) (outgroup in the phylogeny). In particular, we do not include E. canceri (Stentiford et al. Reference Stentiford, Bateman, Longshaw and Feist2007), Nucleospora salmonis (Chilmonczyk et al. Reference Chilmonczyk, Cox and Hedrick1991) and Paranucleospora theridion (Nylund et al. Reference Nylund, Nylund, Watanabe, Arnesen and Karlsbakk2010) in this comparison as they infect cell nuclei. Merogony occurs within a parasitophorous vacuole in Msp2, H. eriocheir, G. intestinalis and L. covasacrae, whereas it occurs in direct contact with the host cell cytoplasm in Msp1, O. operophterae and in other species from Group 2. Hence, this character appears to evolve very quickly in this lineage. Meronts are unikaryotic in Msp2 as in all other species considered except D. lepeophterii and L. covasacrae. Merogonial division is by binary fission in Msp1, Msp2 and L. covasacrae, contrary to all other species where it occurs by plasmotomy, by rosette-like division (H. eriocheir) or by binary fission followed by plasmotomy (D. lepeophterii). The sporogonial division is by plasmotomy in Msp1, Msp2, and all other species considered, except in E. hepatopenaei, and L. covasacrae where it occurs by binary fission. The development of the invasion apparatus occurs in isolated sporoblasts in Msp1, Msp2, G. intestinalis, D. lepeophterii, L. covasacrae and O. operophterae, while it starts in the sporogonial plasmodium in E. bieneusi, E. hepatopenaei and E. canceri. The number of sporoblasts within the parasitophorous vacuole is greater in Msp2 (64–128) compared with Msp1 (32–64), O. operophterae (12), and G. intestinalis (16) (no data available for E. hepatopenaei, H. eriocheir, D. lepeophterii, E. bieneusi and L. covasacrae). Msp2 spores are subspherical (1·2×0·9 μm) and have lower eccentricity than the more oval Msp1 spores (1·3×0·7 μm). Msp2 and E. hepatopenaei (1·1×0·7 μm) have the smallest spore size compared with all other species considered (1·5×0·8 μm for E. bineusi, 1·7×1·0 μm for H. eriocheir, 2·2–3·4×1·1–1·7 μm for L. covasacrae, 2·3×1·8 μm for D. lepeophterii, 2·4–2·7×1·1–1·7 μm for G. intestinalis, 3·5×1·2 μm for O. operophterae). The thickness of the spore wall is similar in Msp1, O. operophterae, E. hepatopenaei and H. eriocheir (50–55 nm) and larger in all other species (D. lepeophterii: 75 nm, Msp2: 80 nm, G. intestinalis: 80–85 nm, L. covasacrae: 120 nm), except E. bieneusi (30–35 nm). The polar tubes of Msp2, H. eriocheir and L. covasacrae are the thickest (diameters 100, 120 and 120 nm respectively), compared with Msp1 (70 nm), D. lepeophterii (65–85 nm), E. bieneusi (75 nm), O. operophterae (75 nm), G. intestinalis (77–85 nm) and E. hepatopenaei (90 nm). The number of polar tube coils is small in Msp2 (4), L. covasacrae (3–5) and E. bieneusi (4–7), as compared with Msp1 and E. hepatopenaei (5–6), D. lepeophterii and G. intestinalis (5–8), O. operophterae (6–7) and H. eriocheir (7–8).
Based on molecular and ultrastructural evidence, Msp1 and Msp2 have not been previously described and constitute new species. We propose to name them Anostracospora rigaudi and Enterocytospora artemiae respectively. Both species are likely to be exclusively horizontally transmitted, given the rate of horizontal transmission observed in the laboratory (>50%) and the lack of infection detected in nauplii produced by infected mothers (although we cannot completely rule out the possibility of low-level vertical transmission in E. artemiae). As spores are released into the intestinal lumen while the host is alive, transmission probably occurs among living hosts. In this case, new hosts are infected by filter-feeding spores in the water column, as in related microsporidia (Ebert, Reference Ebert1994; Ebert et al. Reference Ebert, Lipsitch and Mangin2000). This study illustrates the usefulness of molecular markers to characterize and discriminate among microsporidia infecting gut tissues.
Taxonomic summary for Anostracospora rigaudi n. g., n. sp. (Msp1)
Phylum: Microsporidia Balbiani, 1882
Family: incertae sedis
Genus: Anostracospora n. g.
Closely related to the genera Endoreticulatus and Cystosporogenes, based on SSU rDNA phylogeny (Fig. 2). All life cycle stages with isolated nuclei. Merogony in direct contact with host cell cytoplasm. Sporogony by plasmotomy within a parasitophorous vacuole. Meiosis not observed. Mature spores ovoid. Polar tube isofilar. No production of xenomas.
Type species:Anostracospora rigaudi n. sp.
Type hosts:Artemia franciscana Kellogg, 1906, A. parthenogenetica Bowen and Sterling, 1978.
Prevalence of infection: 39·5% (58/147) in A. franciscana, 75·2% in A. parthenogenetica (100/133). Prevalence based on samples collected in 2008 in Aigues-Mortes, France.
Phenotypic effects: Strong negative effect on the probability of reproduction in female hosts (Rode et al. Reference Rode, Lievens, Flaven, Segard, Jabbour-Zahab and Lenormandin press). Effect on host survival not studied. Strong positive effect on host swarming and surfacing behaviour (Rode et al. Reference Rode, Lievens, Flaven, Segard, Jabbour-Zahab, Sanchez and Lenormand2013).
Locality: Southern France, Ukraine (Rode et al. Reference Rode, Lievens, Flaven, Segard, Jabbour-Zahab and Lenormandin press)
Genbank accession: JX915758, JX915759 (Aigues-Mortes, Fance).
Transmission: Horizontal transmission, most likely with the faeces of infected individuals.
Site of infection: Intestinal epithelium, no production of syncytia or xenomas. Infection is characteristically found in the zone between the brush border and the nucleus. Infected cells are not hypertrophied.
Merogony: Uninucleate meronts develop in direct contact with host cytoplasm (unknown mode of division).
Sporogony: Uninucleate sporonts divide by plasmotomy within a parasitophorous vacuole. Asynchronous development with meronts and sporonts found in the same vacuole. The parasitophorous vacuole including mature spores is released intact into the gut lumen.
Spore: Mature spores uninucleate, ovoid and small (1·3×0·7 μm). The spore wall is 55-nm thick. The polar tube is isofilar with 5–6 coils (diameter: 60 nm) arranged in one or two rows of coils.
Parasitophorous vacuole: Initiated at the beginning of sporogony.
Types: Syntypes in resin block No. PC0709125, on slide No. PC0709126 and copper grid No. PC0709127.
Deposition of types: Resin block No. PC0709125 (infected A. parthenogenetica female specimen), slide No. PC0709126 (intestinal semi-thin sections of an infected A. parthenogenetica female) and copper grid No. PC0709127 (intestinal ultra-thin sections of an infected A. parthenogenetica female showing developing and mature spores) were deposited in the collection of the Muséum National d'Histoire Naturelle (MNHN), 75231, Paris, France.
Etymology: Genus named after the order Anostraca Sars, 1867. Species named after Thierry Rigaud who kindly conducted the first PCR tests to check microsporidian infection in Artemia spp.
Taxonomic summary for Enterocytospora artemiae n. g., n. sp. (Msp2)
Phylum: Microsporidia Balbiani, 1882
Family: incertae sedis
Genus: Enterocytospora n. g.
Polytomous position with two different groups including the genera Endoreticulatus and Enterocytozoon based on SSU rDNA phylogeny (Fig. S1 – in Online version only). All life cycle stages with isolated nuclei. Merogonial reproduction by binary division within a parasitophorous vacuole. Sporogony by plasmotomy within a parasitophorous vacuole. Meiosis not observed. Mature spores subspherical. Polar tube isofilar. No production of xenomas.
Type species:Enterocytospora artemiae n. sp.
Type hosts:Artemia franciscana Kellogg, 1906, A. franciscana monica Verrill, 1869, A. parthenogenetica Bowen and Sterling, 1978.
Prevalence of infection: 52·4% (77/147) in A. franciscana, 21·8% in A. parthenogenetica (29/133). Prevalence based on samples collected in 2008 in Aigues-Mortes, France.
Phenotypic effects: No effect on the probability of reproduction in female hosts (Rode et al. submitted). Effect on host survival not studied. Strong positive effect on host swarming and surfacing behaviour (Rode et al. Reference Rode, Lievens, Flaven, Segard, Jabbour-Zahab, Sanchez and Lenormand2013).
Locality: Southern France; Mono Lake, CA, USA; Great Salt Lake, UT, USA; Eilat and Ein Evrona salterns, Eilat, Israel (Rode et al. submitted).
Genbank accession: JX915760 (Aigues-Mortes, France), JX839889 and JX915761 (Great Salt Lake, UT, USA), JX915754 and JX915755 (Mono Lake, CA, USA), JX915756 and JX915757 (Ein Evrona, Eilat, Israel).
Transmission: Horizontal transmission, most likely with the faeces of infected individuals.
Site of infection: Intestinal epithelium, no production of syncytia or xenomas. Infection is characteristically found in the zone between the brush border and the nucleus. Infected cells are not hypertrophied.
Merogony: Uninucleate meronts divide by binary fission within a parasitophorous vacuole.
Sporogony: Uninucleate sporonts divide by plasmotomy within a parasitophorous vacuole. Asynchronous development with meronts, sporonts and sporoblasts found together within the parasitophorous vacuole. Development of sporoblasts and mature spores together within the parasitophorous vacuole. The parasitophorous vacuole, including mature spores, is released intact into the gut lumen.
Spore: Mature spores uninucleate, subspherical and small (1·2×0·9 μm). Spore wall is 80-nm thick. The polar tube is isofilar with 4 coils (diameter: 100 nm) arranged in one row of coils.
Parasitophorous vacuole: Initiated at the beginning of merogony.
Types: Syntypes in resin block No. PC0709128, on slide No. PC0709129 and copper grid No. PC0709130.
Deposition of types: Resin block No. PC0709128 (infected A. franciscana female specimen), slide No. PC0709129 (intestinal semi-thin sections of an infected A. franciscana female) and copper grid No. PC0709130 (intestinal ultra-thin sections of an infected A. franciscana female showing developing and mature spores) were deposited in the collection of the MNHN, 75231, Paris, France.
Etymology: Genus name describes the site of infection. Specific epithet describes host genus.
Detection of cryptic infection
Obtaining accurate and reliable estimates of parasite prevalence in the field is a prerequisite to the study of their ecology and their impact on host populations. However, infection by gut microsporidia is often cryptic as they often leave no macroscopic traces in their host (Ebert, Reference Ebert2005) and because they can be difficult to distinguish from the intestinal flora (especially when their size is similar to bacteria, as is the case for the two species described here). Even for species with larger spores, such as U. exiguum, their prevalence in natural populations is difficult to estimate (Codreanu, Reference Codreanu1957). We developed species-specific molecular markers and investigated the phenotypes of hosts infected by A. rigaudi or E. artemiae. Surprisingly, we found no significant association between infection by either parasite and the presence of white-spots on the cuticle or posterior part of the digestive tract. Thus, this cue is not associated with A. rigaudi or E. artemiae infection. These white-spots could represent infections by other microsporidian species or viruses known to produce white spots in Artemia and other crustacean hosts (Li et al. 2003; Escobedo-Bonilla et al. Reference Escobedo-Bonilla, Alday-Sanz, Wille, Sorgeloos, Pensaert and Nauwynck2008). Macroscopic symptoms of infection such as ‘white-spots’ could in principle be an attractive method to measure microsporidian prevalence in Artemia populations, provided that a non-ambiguous association is made with infection of a given stage of the relevant parasite(s). As far as we know, this has not been clearly demonstrated, even if N. artemiae and V. anostraca are probably responsible for these ‘white-spots’ (Codreanu, Reference Codreanu1957; Martinez et al. Reference Martinez, Vivarès, Rocha, Fonseca, Andral and Bouix1992, Reference Martinez, Larsson, Amat and Vivarès1994). Hence, PCR assays with specific markers such as those developed in this and other studies (e.g. Hogg et al. Reference Hogg, Ironside, Sharpe, Hatcher, Smith and Dunn2002; Weigl et al. Reference Weigl, Körner, Petrusek, Seda, Wolinska, Becnel, Andreadis, Wittner, Weiss and Ben-Ami2012) remain the most accurate method to reliably detect microsporidian infections and to accurately estimate their prevalence in the field. In addition, these molecular techniques allow morphologically similar species to be distinguished within 3–6 days of hosts being infected. A similar time-to-detection period has been found in a Nosema species infecting silkworms (Hatakeyama and Hayasaka, Reference Hatakeyama and Hayasaka2002). This period likely corresponds to the time necessary for spore germination and meront multiplication before microsporidian DNA can be detected by PCR.
In conclusion, we report the existence of and characterize two new microsporidian species. Despite their prevalence, these cryptic species have remained unnoticed for several reasons: (1) they do not cause macroscopic symptoms, (2) they are localized in the intestinal tract, and are mixed with a diversity of other microorganisms when directly observed on Artemia squashes, (3) they are small enough to be confounded with bacteria in the same size range, (4) they grow in the intestinal epithelium which is renewed with each host moult, preventing their proliferation to some extent. We developed molecular markers to detect their presence and discriminate between these two similar species. These methods offer a useful complement to microscopic techniques to study the ecology and evolution of these important but cryptic intracellular parasites.
ACKNOWLEDGEMENTS
The authors are grateful to C. Cazevieille and C. Sanchez for their technical assistance. We thank T. Rigaud and M.-P. Dubois for their advice and help regarding the molecular and microscopic investigations of microsporidiosis. We also thank three anonymous reviewers for their useful comments.
FINANCIAL SUPPORT
Financial support was provided by the QuantEvol ERC grant (T. L.) and a French Ministry of Research fellowship (N. O. R.).