INTRODUCTION
The genus Cryptosporidium is currently estimated to comprise 25 species (Ryan and Xiao, Reference Ryan, Xiao, Caccio and Widmer2014), the majority of which infect the epithelium of the small intestine and the colon. Most cases of human cryptosporidiosis are caused by two related species, Cryptosporidium parvum and Cryptosporidium hominis. As the morphology of the intracellular developmental stages and of the oocysts from different species is often indistinguishable, genetic markers have played an important role in elucidating the taxonomy of the genus and the epidemiology of cryptosporidiosis. The first effort to develop genetic markers dates back 23 years (Laxer et al. Reference Laxer, Timblin and Patel1991). Genotyping methods have since evolved with the technology. Simple sequence repeats (SSRs) were rapidly adopted as genetic markers because they tend to be polymorphic between and within Cryptosporidium species (Feng et al. Reference Feng, Rich, Akiyoshi, Tumwine, Kekitiinwa, Nabukeera, Tzipori and Widmer2000; Strong et al. Reference Strong, Gut and Nelson2000; Caccio et al. Reference Caccio, Spano and Pozio2001), and because alleles are easily identified by electrophoretic fractionation on gels or capillary systems. The availability of the C. parvum and the partial sequence of the C. hominis genome (Abrahamsen et al. Reference Abrahamsen, Templeton, Enomoto, Abrahante, Zhu, Lancto, Deng, Liu, Widmer, Tzipori, Buck, Xu, Bankier, Dear, Konfortov, Spriggs, Iyer, Anantharaman, Aravind and Kapur2004; Xu et al. Reference Xu, Widmer, Wang, Ozaki, Alves, Serrano, Puiu, Manque, Akiyoshi, Mackey, Pearson, Dear, Bankier, Peterson, Abrahamsen, Kapur, Tzipori and Buck2004) has enabled the identification of numerous SSRs. In other eukaryotic lineages, SSRs evolve relatively quickly by acquiring or losing repeat units, and are mostly found in non-coding regions of the genome (Tautz, Reference Tautz1989; Madesis et al. Reference Madesis, Ganopoulos and Tsaftaris2013). In contrast, many of the longer SSRs in C. parvum and C. hominis are within open reading frames and encode long stretches of potentially glycosylated serine and threonine residues (Barnes et al. Reference Barnes, Bonnin, Huang, Gousset, Wu, Gut, Doyle, Dubremetz, Ward and Petersen1998). The putative antigenicity of these proteins in apicomplexan parasites has suggested that the evolution of such polymorphisms is driven by selective pressure for antigenic diversification (Escalante et al. Reference Escalante, Lal and Ayala1998).
To increase the ability of SSR markers to distinguish among isolates from a same species, multiple markers are often combined into multi-locus genotyping tools (Mallon et al. Reference Mallon, MacLeod, Wastling, Smith, Reilly and Tait2003; Gatei et al. Reference Gatei, Hart, Gilman, Das, Cama and Xiao2006, Reference Gatei, Das, Dutta, Sen, Cama, Lal and Xiao2007; Tanriverdi and Widmer, Reference Tanriverdi and Widmer2006; Chalmers et al. Reference Chalmers, Hadfield, Jackson, Elwin, Xiao and Hunter2008). As the cost of Sanger sequencing has dropped, allelic polymorphisms have also been identified by direct sequencing of PCR products. The wide adoption of polymorphic SSRs to genotype C. parvum and C. hominis raises questions about the impact on epidemiological investigations of scoring the length of repetitive sequences vs sequencing the same or other, non-repetitive polymorphic loci. Using a sample of 69 C. hominis isolates from four countries, Gatei et al. (Reference Gatei, Hart, Gilman, Das, Cama and Xiao2006) compared the ability of multi-locus sequencing and multi-locus length polymorphism to distinguish isolate from different countries. These authors concluded that sequencing increased genotype resolution as compared to length polymorphism but their conclusions were based on a visual comparison of phylogenetic trees and were not supported by statistical analysis.
Taking advantage of the availability of a diversified set of C. parvum amplicon length and matching amplicon sequences from a previously published survey (Drumo et al. Reference Drumo, Widmer, Morrison, Tait, Grelloni, D'Avino, Pozio and Caccio2012), here we assessed to what extent the outcome of a hypothetical survey of C. parvum isolates depends on the genotyping method.
MATERIALS AND METHODS
Samples and genotyping
Fecal samples positive for Cryptosporidium oocysts were collected in Italy as part of a previously published study (Drumo et al. Reference Drumo, Widmer, Morrison, Tait, Grelloni, D'Avino, Pozio and Caccio2012). Fecal DNA was genotyped using seven polymorphic SSR markers (MM5, MM18, MM19, TP14, MS1, MS9 and GP60). PCR amplicons were fractionated on a capillary electrophoresis instrument (QiaXcel; Qiagen) and the amplicon length inferred by comparing to a size standard. For each marker, one PCR product representative of each estimated amplicon size was sequenced using the PCR primers as follows. PCR amplicons were purified using the QIAquick® PCR Purification Kit (QIAGEN®, Hilden, Germany) and sequenced in both directions using an ABI PRISM® BigDye™ Terminator Cycle Sequencing Kit (Applied Biosystems®, Life Technologies™, Carlsbad, CA, USA). The sequencing reactions were analysed using the ABI PRISM® 3100 automatic sequencer (Applied Biosystems®) and SeqMan™ 7·0 (DNASTAR®, Madison WI, USA). BioEdit 7·2·3 software program (Tom Hall, Ibis Therapeutics, Carlsbad, CA, USA) was used to assemble the sequences. Sequences were deposited in GenBank under accession numbers KP265906-KP265926.
Data analysis
The analyses are based on four SSR markers (MM5, MM19, MS9 and GP60) for which amplicon length and amplicon sequence for at least six isolates was available. MM5 is a repeat of the 3-nucleotide motif CTT located in C. parvum gene cgd6_4290 (C. hominis Chro.60491). MM19 (Morrison et al. Reference Morrison, Mallon, Smith, MacLeod, Xiao and Tait2008) is repeat of motif TGGACG located in C. parvum gene cgd8_4840 (C. hominis Chro.80556) encoding a low-complexity protein with two MYB domains. MS9 (Mallon et al. Reference Mallon, MacLeod, Wastling, Smith, Reilly and Tait2003) is a repeat of motif TGGATC located in hypothetical C. parvum gene cgd5_2850 (C. hominis Chro.50089). Finally, GP60 is a TCA repeat located in the well-studied gene cgd6_1080 (C. hominis Chro.60138) encoding a sporozoite surface glycoprotein (Cevallos et al. Reference Cevallos, Zhang, Waldor, Jaison, Zhou, Tzipori, Neutra and Ward2000; Strong et al. Reference Strong, Gut and Nelson2000). Cryptosporidium hominis isolate TU502 sequences homologous to MM5, MM19, MS9 and GP60 were imported from the Cryptosporidium Genomics Resource database CryptoDB (Heiges et al. Reference Heiges, Wang, Robinson, Aurrecoechea, Gao, Kaluskar, Rhodes, Wang, He, Su, Miller, Kraemer and Kissinger2006). The TU502 allele length at each locus was inferred from the genomic location of the PCR primers.
Phylip formatted (Felsenstein, Reference Felsenstein1995) pairwise SSR distance matrices were computed for each marker using GenAlEx (Peakall and Smouse, Reference Peakall and Smouse2012). For single-locus analyses, the SSR distance between two samples is equal to the square of the difference in estimated amplicon lengths, where the length is expressed in number of nucleotides. For multi-locus data, the squared allele length difference is summed over all loci (MM5, MM19, MS9 and GP60).
For each marker, DNA sequences were aligned using Clustal Omega (Sievers et al. Reference Sievers, Wilm, Dineen, Gibson, Karplus, Li, Lopez, McWilliam, Remmert, Soding, Thompson and Higgins2011). Concatenated sequences were aligned using the same program. Pairwise distance matrices were calculated using program dist.seqs in mothur (Schloss et al. Reference Schloss, Westcott, Ryabin, Hall, Hartmann, Hollister, Lesniewski, Oakley, Parks, Robinson, Sahl, Stres, Thallinger, Van Horn and Weber2009) using the following options: countends = F, which excludes gaps located at the end of sequences; calc = eachgap which increases the distance between two sequences in proportion to the length of the sequence gap plus the number of single-nucleotide polymorphisms (SNPs). The calc = onegap option only considers a gap as a 1-nt indel, regardless of its length. In both calc methods, all SNPs are counted, regardless of their location inside or outside the repeat. The correlation between the multi-locus SSR distance matrix and the distance matrix derived from the concatenated sequences was calculated with Mantel. The test (Mantel, Reference Mantel1967) compares two matrices (in this case SSR and sequence distance matrix) and calculates the probability of obtaining the observed correlation by randomly permuting one of the matrices.
The statistical significance of clusters visualized on PCoA plots was tested with PAST software (Hammer et al. Reference Hammer, Harper and Ryan2001) using Analysis of Similarities (ANOSIM) (Clarke, Reference Clarke1993). With this test, the significance of two clusters of 9 and 21 isolates, respectively, obtained from the analysis of 30 concatenated sequences was tested.
RESULTS
Single-locus analyses
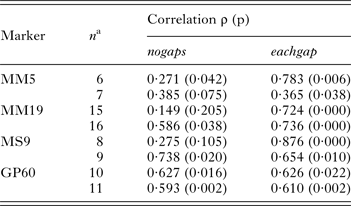
To compare the performance of two typing methods (SSR and DNA sequence) used extensively to study the epidemiology of cryptosporidiosis, matching amplicon length and amplicon sequence data for representative alleles were obtained from four SSRs described above and a genetically diverse collection of C. parvum isolates (Drumo et al. Reference Drumo, Widmer, Morrison, Tait, Grelloni, D'Avino, Pozio and Caccio2012). We tested the correlation between pairwise distances calculated based on allele length (SSR distance) and the sequence of the PCR amplicons (sequence distance). The plot of SSR vs sequence distance shows 120 pairwise comparisons between 16 isolates (16 × 15/2) for MM19 and 55 comparisons for 11 isolates (11 × 10/2) for GP60 (Fig. 1). Similar plots were obtained for MM5 and MS9 (not shown). In general, larger SSR values correlated with larger sequence distances, indicating that nucleotide substitutions and gain/loss of nucleotide repeat units are associated. This correlation is however not very strong (MM19, r 2 = 0·54; GP60, r 2 = 0·37; MM5, r 2 = 0·52; MS9, r 2 = 0·68), raising the question whether genotype analyses based on SSR length or sequence generate comparable results. To test this possibility, we compared SSR and sequence distances between the same pairs of isolates using the Mantel test (Table 1). To this aim, two matrices of pairwise distances were computed for each of four repeats using the eachgap and nogaps options (Schloss et al. Reference Schloss, Westcott, Ryabin, Hall, Hartmann, Hollister, Lesniewski, Oakley, Parks, Robinson, Sahl, Stres, Thallinger, Van Horn and Weber2009) for sequence distance, and SSR distance for amplicon length. Table 1 shows Mantel ρ values and statistical significance level for the correlation between sequence distance matrix and SSR matrix for each of the four markers MM5, MM19, MS9 and GP60. For each marker and distance metric, ρ was calculated with C. hominis TU502 included or omitted from the dataset. TU502 was included to assess the impact of the more divergent C. hominis sequence on the analysis. Table 1 shows that the eachgap distance better correlates with SSR than nogaps distance. In fact, 6/6 ρ values were significant, regardless whether C. hominis was included or excluded. This result is consistent with the fact that eachgap considers all sequence differences, gaps and SNPs, and will therefore generate distances which correlate relatively well with SSR distances. In contrast, nogaps distance only tabulates SNPs. As a consequence, Mantel tests for 3/4 markers returned low and non-significant ρ values (Table 1). This analysis demonstrates that sequence divergence in non-repeat regions is relatively poorly correlated with allele length polymorphism. Inclusion of TU502 into the nogaps analysis did not have a clear impact on the outcome, as ρ increased for MM5 but diminished for MM19, MS9 and GP60.
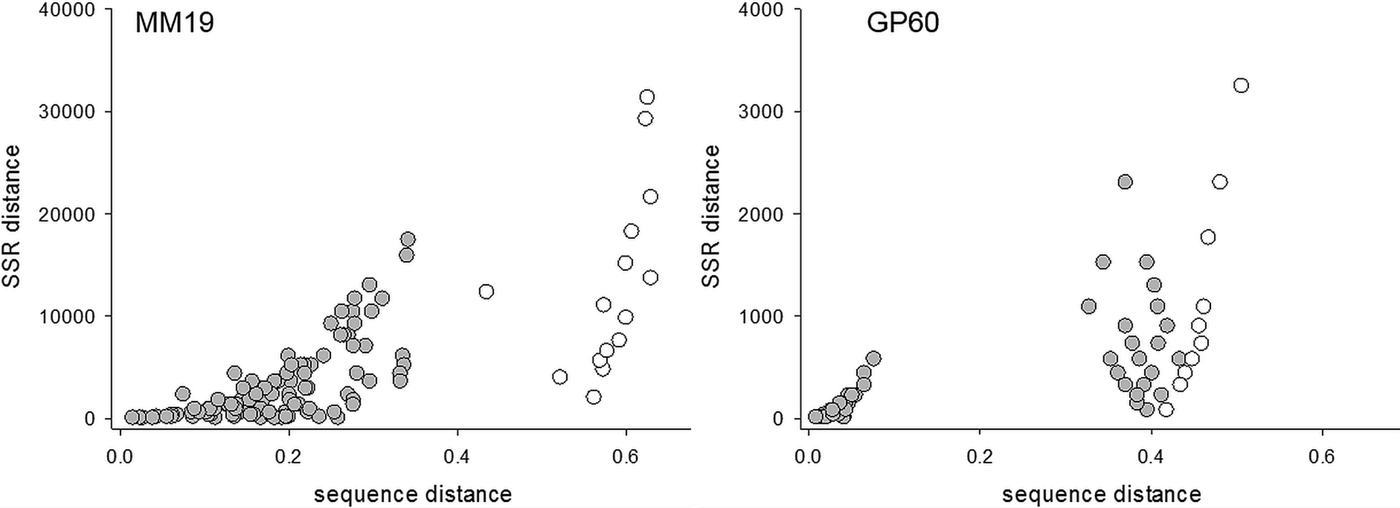
Fig. 1. Correlation between sequence and SSR distance. Left, MM19, n = 16; right, GP60, n = 11. Distances among 15 C. parvum isolates are shaded, whereas distances between C. parvum and C. hominis TU502 are represented with clear circles.
Table 1. Correlation between pairwise distances based on sequence and amplicon length for four Cryptosporidium SSR markers

a n indicates number of isolates included in the analysis; for each marker, the smaller number is for C. parvum isolates only, the higher number includes the same C. parvum isolates plus C. hominis TU502.
In light of the results obtained by comparing SSR and sequence distance matrices, we tested to what extent the discrepancy between distance metrics can affect the interpretation of a hypothetical survey of Cryptosporidium isolates. This question was first examined using markers MM19, GP60 and MS9 individually. Figure 2 (top panels) shows the results of the MM19 analyses. The 15 unique C. parvum alleles ranged in length from 263 to 389 nt. The distance between MM19 sequences from the same isolates represented in the PCoA plot shows a similar pattern, as the isolates which lie at the opposite ends of the allele length distribution also tend to be at the opposite end on the first PCoA axis. Additional sequence variation represented on axis 2 is not associated with length polymorphism and represents sequence polymorphisms which are not detected by amplicon length. Analogous analyses of the GP60 (Fig. 2, bottom panels) and MS9 marker (not shown) show a similar pattern. The outcome of single-locus analyses leads us to conclude that inferences on the structure of Cryptosporidium populations based on a single locus may not be strongly affected by how distances between alleles are measured.

Fig. 2. Relationship between MM19 and GP60 length polymorphism and sequence polymorphism. Alleles are shaded according to amplicon length. PCoA plots based on eachgap distances between MM19 sequences from 15 isolates (top panels) show that length polymorphism significantly impacts the distance between data points, as distance tends to correlate with difference in shading. The same was found with GP60 amplicon length and sequence data from 10 isolates (bottom panels). The GP60 genotype codes are as follows: Goat13, IIdA13G1R1; H34, IIdA16G1; Goat2, IIdA18G1; C1, IIaA15G2R1; C189, IIaA17G1R1; C245, IIaA16G3R1; C99, IIaA18G2R1; L12, IIaA21R1; L6, IIaA22R1; C28, IIaA25R1.
Multi-locus analyses
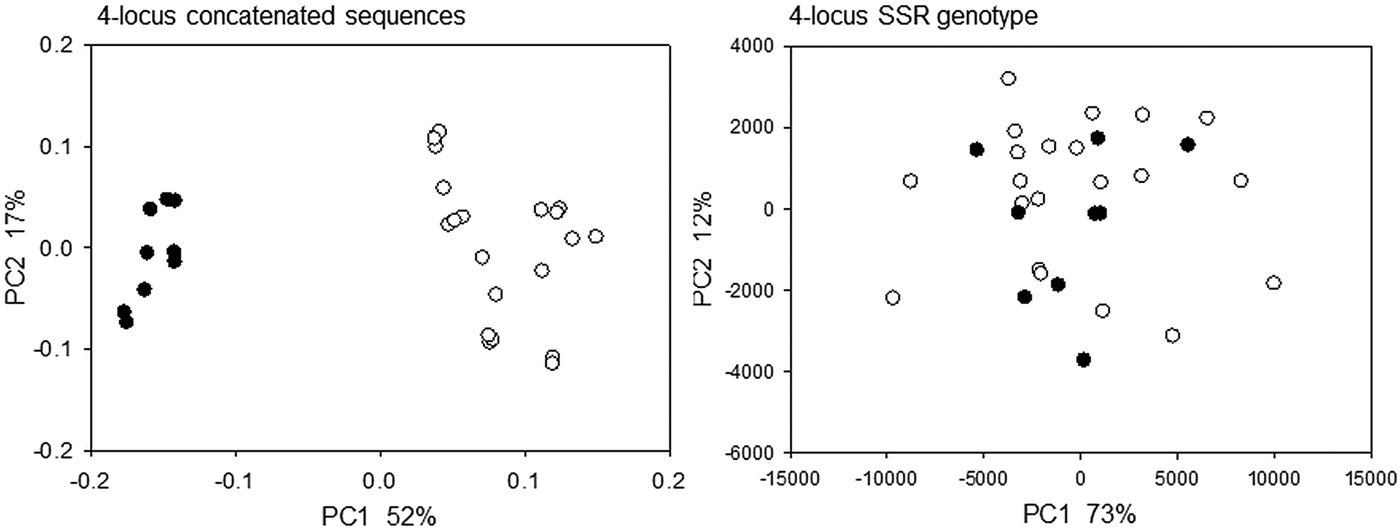
Because multi-locus genotyping methods are better suited to assess Cryptosporidium genetic polymorphism and population structure (Widmer and Lee, Reference Widmer and Lee2010; Feng et al. Reference Feng, Tiao, Li, Hlavsa and Xiao2014), we constructed multi-locus genotypes in silico using MM5, MM19, MS9 and GP60 length polymorphism and matching sequence data. Six C. parvum MM5 alleles were randomly combined with 6 of 15 MM19 alleles, 6 of 8 MS9 and 6 of 10 GP60 alleles to generate six unique 4-locus genotypes based on length polymorphism and matching sequence data. The 4-locus genotypes were generated in silico because the original dataset did not contain multi-locus length and sequence data from an adequate number of isolates. Importantly, although the data for each marker originated from different isolates, for each locus and each 4-locus genotype, length polymorphism and sequence came from the same isolate. This randomization procedure therefore replicated what occurs in nature as a result of genetic recombination. Randomization was performed five times to generate a total of 30 (5 × 6) unique MM5–MM19–MS9–GP60 genotypes. To assess the impact of the genotyping method on isolate clustering, we then applied PCoA to display pairwise distances between the 30 ‘recombinants’ based on SSR and eachgap distances between concatenated sequences. Four-locus SSR and sequence distances were calculated as described above in Materials and Methods. The distances between concatenated sequences generated two clearly defined clusters (Fig. 3, left panel) comprising 9 and 21 recombinant genotypes, respectively. This outcome was independent of the order in which the sequences were concatenated, as the same analysis with sequences merged in a different order (MM19–MM5–GP60–MS9) generated similar clusters. PCoA based on onegap distances generated three clusters, instead of two (not shown) indicating that distance metrics can affect clustering. As expected from the PCoA plot shown in Fig. 3 (left panel), ANOSIM confirmed that the two clusters obtained with the eachgap distance (Fig. 3) were highly significant (R = 0·97, P < 0·0001). Significantly, in the PCoA of SSR distances the same 9 and 21 4-locus genotypes did not clusters (Fig. 3, right panel) (R = −0·084, P = 0·78). Thus, this example shows that multi-locus genotypes obtained with SSR data and by concatenating multiple sequences can significantly impact the outcome of the analysis. Although we found that SSR and sequence distances for individual markers are partially correlated, multi-locus genotypes obtained using different methods can generate significantly different population structures.

Fig. 3. Multi-locus SSR and sequence genotypes reveal different population structures. Thirty unique 4-locus genotypes were created with matching amplicon length and sequence data obtained from a same isolate as described in Materials and Methods. PCoA plots based on pairwise eachgap distances between concatenated sequences (left) show two clearly defined clusters of isolates indicated with black and white dots. The right panel shows that these isolates no longer cluster if SSR distances are used instead of sequence distances. Axis legends show percent variation explained.
DISCUSSION
The availability of sequence data for four genetic markers used in published MLG analyses of Cryptosporidium populations (Mallon et al. Reference Mallon, MacLeod, Wastling, Smith, Reilly and Tait2003; Morrison et al. Reference Morrison, Mallon, Smith, MacLeod, Xiao and Tait2008; Drumo et al. Reference Drumo, Widmer, Morrison, Tait, Grelloni, D'Avino, Pozio and Caccio2012) enabled us to test to what extent the use of length polymorphism or amplicon sequence impacts the outcome of a hypothetical population analysis. Identifying how isolates relate to each other and visualizing clusters of genotypically related isolates is often the main goal of a survey. Thus, we based our analysis on distances between pairs of isolates. This approach was also chosen because a distance matrix is the starting point of many commonly used methods to compare the similarity between samples characterized by multiple variables (Legendre and Legendre, Reference Legendre and Legendre2012). Although single-locus distance matrices obtained from SSR and sequence data were significantly correlated, this was not the case when sequences and SSR data from multiple loci were combined in multi-locus genotypes. This outcome demonstrates that the simplicity of genotyping using amplicon length data is potentially offset by the limited resolution of SSRs.
Since amplicon length and sequence data from a same locus were only available for a small number of isolates, to extend the comparison of SSR and sequence data to multi-locus genotypes it was necessary to create the genotypes in silico. Because sequence and length polymorphism from each locus originated from a same isolate, the multi-locus genotypes we assembled are legitimate proxies of what may be found in nature as a result of genetic recombination. The analysis of multi-locus genotypes clearly showed that the choice of distance metric (SSR or sequence) can affect the outcome. Significantly, even the choice of algorithm used to calculate distances between pairs of concatenated sequences (eachgap vs onegap; see Materials and Methods) generated different subpopulations.
The only published comparison of Cryptosporidium genotyping methods we are aware of focuses on C. hominis (Gatei et al. Reference Gatei, Hart, Gilman, Das, Cama and Xiao2006). Multi-locus genotypes based on sequence and repeat length data were evaluated by visually comparing Neighbour-Joining phylogenetic trees built from genotypes obtained with each method. The lack of numerical evaluation of the phylogenies makes it difficult to compare this study with ours. As expected, and as observed here with C. parvum, Gatei et al. (Reference Gatei, Hart, Gilman, Das, Cama and Xiao2006) noticed a higher resolution of genotyping based on sequencing.
Although our study is focused on C. parvum, for certain analyses we included the genotype of C. hominis isolate TU502 (Xu et al. Reference Xu, Widmer, Wang, Ozaki, Alves, Serrano, Puiu, Manque, Akiyoshi, Mackey, Pearson, Dear, Bankier, Peterson, Abrahamsen, Kapur, Tzipori and Buck2004). The goal of including C. hominis was to assess whether the main conclusions also apply to a more diverse set of genotypes. The data summarized in Table 1 show that this is indeed the case. Including the more divergent C. hominis genotype did not affect the level of correlation between pairwise distances calculated based on sequence or length polymorphism.
The discussion on the adoption of a common set of Cryptosporidium genetic markers (Widmer and Sullivan, Reference Widmer and Sullivan2012) has focused on identifying markers with the highest level of polymorphism in C. parvum and C. hominis. A standardized and widely used multi-locus typing platform is highly desirable as it would enable the integration of different surveys and would generate a more comprehensive view of the epidemiology of cryptosporidiosis across different hosts, locations and times. In light of experimental and epidemiological evidence of genetic recombination in C. parvum, the advantage of adopting a multi-locus approach has also become more widely accepted. The analyses presented here emphasize the importance of adopting not only a common set of markers but also a standardized genotyping protocol.
FINANCIAL SUPPORT
This work was supported in part by the European Union Reference Laboratory for Parasites (contract SANCO/2006/FOODSAFETY/032).