


Introduction
Ecological networks are complex units that incorporate many threads of the fabric of biodiversity, namely species identity, interactions and shared coevolutionary history. Investigating the structure and the biogeography of communities through species interactions can therefore be highly informative. Local networks carry a record of both biogeographical and historical features of the regional pool of species and interactions, as they are subsets of a regional metaweb (Holt, Reference Holt2002), and so result from the fact that species both co-occur and interact. However, some of these characteristics can be lost over time, in response to local ecological pressure or random change. This is notably true of the co-phylogenetic signal of interactions (Desdevises et al., Reference Desdevises, Morand, Krasnov, Claude, Morand, Krasnov and Littlewood2015; Krasnov et al., Reference Krasnov, Morand, Poulin, Morand, Krasnov and Littlewood2015), which can be eroded by environmental filtering during community assembly. This would result in a non-correlative variation of ecological networks components (Poisot et al., Reference Poisot, Cirtwill, Cazelles, Gravel, Fortin and Stouffer2016; Poisot and Stouffer, Reference Poisot and Stouffer2018).
Dissimilarity of species interactions is always equal to, or greater than, the differences in species composition, because there cannot be an interaction without the presence of both partners. Therefore, interactions can be more informative than the species richness or functional diversity alone (Poisot et al., Reference Poisot, Guéveneux-Julien, Fortin, Gravel and Legendre2017). For instance, the probability of interaction may be modified by environmental changes that affect the metabolic rate of organisms (Rall et al., Reference Rall, Brose, Hartvig, Kalinkat, Schwarzmüller, Vucic-Pestic and Petchey2012), by changes in their habitats (Tylianakis and Morris, Reference Tylianakis and Morris2017) or by community's phylogenetic structure (Coelho et al., Reference Coelho, Rodrigues and Rangel2017) – which, in turn, varies with the abundance and specialization of species involved (Canard et al., Reference Canard, Mouquet, Mouillot, Stanko, Miklisova and Gravel2014; Tylianakis and Morris, Reference Tylianakis and Morris2017), but is not captured by looking solely at species composition.
Environmental conditions also have direct effects over species fitness. In this sense, environmental gradients can change the frequency of interactions through direct influence on species’ characteristics and population abundance, which, on the other hand, are also affected by interactions (Poisot et al., Reference Poisot, Stouffer and Gravel2014). For example, the environment can affect the production of secondary metabolites that exert selective pressure on the organisms that interact with certain plants (Muola et al., Reference Muola, Mutikainen, Lilley, Laukkanen, Salminen and Leimu2010), how the geographical variation of functional characteristics generates changes in the interaction network and in species composition (König et al., Reference König, Wiklund and Ehrlén2014; Cha et al., Reference Cha, Wu, Fu, Yuan, Wu and Zhang2015), as well as the substitution of species along environmental gradients, variation in reproductive success and in the trophic network, or, yet, how the population density regulated by the environment can change the sign of an interaction (Kaplan and Eubanks, Reference Kaplan and Eubanks2005; Doxford et al., Reference Doxford, Ooi and Freckleton2013; Bruder et al., Reference Bruder, Salis, Jones and Matthaei2017).
Due to all independent factors that can determine their occurrence, the differences between communities related to interactions may be, but not necessarily are, correspondent to those related to their species composition (Poisot et al., Reference Poisot, Stouffer and Gravel2014), and therefore the indexes that measure characteristics of ecological networks can also respond to environmental gradients in space and time (Dalsgaard et al., Reference Dalsgaard, Trøjelsgaard, Martín González, Nogués-Bravo, Ollerton, Petanidou, Sandel, Schleuning, Wang, Rahbek, Sutherland, Svenning and Olesen2013; Baiser et al., Reference Baiser, Gravel, Cirtwill, Dunne, Fahimipour, Gilarranz, Grochow, Li, Martinez, McGrew, Poisot, Romanuk, Stouffer, Trotta, Valdovinos, Williams, Wood and Yeakel2019; Gravel et al., Reference Gravel, Baiser, Dunne, Kopelke, Martinez, Nyman, Poisot, Stouffer, Tylianakis, Wood and Roslin2019). One of these indexes that carries important historical information is the phylogenetic diversity, measured as the sum of the lengths of the phylogeny branches that include all the species that interact in a community. Dispersion and speciation events are the main factors that affect the phylogenetic diversity of a network of ecological interactions (Trøjelsgaard and Olesen, Reference Trøjelsgaard and Olesen2013; Sebastián-González et al., Reference Sebastián-González, Dalsgaard, Sandel and Guimarães2015; Coelho et al., Reference Coelho, Rodrigues and Rangel2017). Moreover, phylogenetic diversity is very sensitive to addition of species and may indicate, for example, the extent of impacts caused by an invasive species in a community (Davies and Buckley, Reference Davies and Buckley2011). Therefore, beta diversity (the difference in the composition of communities) and the phylogenetic diversity of interaction networks are related, and both can respond to environmental variation in different ways.
Based on a parasite–host system distributed over a vast biogeographic region (Eurasia), we identified similar numerical and geographical clusters between the phylogenetic diversity and the dissimilarity of species composition and interactions of ecological networks. This result adds to our previous understanding of biodiversity distribution and helps us tell a more complete story on the biogeography of ecological communities. Specifically, we have found that local networks are characterized by beta-diversity metrics in different ways across the metaweb, and these metrics co-vary with networks’ phylogenetic diversity. Specifically, we have found that local networks are characterized by beta-diversity metrics in different ways across the metaweb, and these metrics co-vary with networks' phylogenetic diversity.
Methods
We used the Hadfield et al. (Reference Hadfield, Krasnov, Poulin and Nakagawa2014) data on the parasitism interaction between fleas and small mammals (Soricomorpha and Rodentia) in 51 regions of the Palearctic to investigate how beta-diversity of networks and phylogenetic diversity are related. This publication gathers occurrence records of 536 000 mammal individuals of 121 species, 1 692 000 individuals from 206 flea species that occurred in those mammals, and the interactions between them (Hadfield et al., Reference Hadfield, Krasnov, Poulin and Shinichi2013). Original data is available at Data Dryad (http://dx.doi.org/10.5061/dryad.jf3tj) and interaction data is available at mangal database (http://mangal.io).
The authors also used molecular and morphological traits of species to retrieve the phylogenetic relationships between species. We used the resulting trees to measure the phylogenetic community dissimilarity (PCD) of both hosts and parasites metacommunities using the function pcd of the package phyr, in R (R Core Team, 2019; Li et al., Reference Li, Dinnage, Nell, Helmus and Ives2020). To do that, we discarded sites with no correspondents taxa in the phylogenetic trees. The output of the pcd function can be divided into compositional (i.e. the shared species between communities, PCDc) and phylogenetic (i.e. evolutionary relationships among species, PCDp) aspects of beta-diversity, which were summarized through a principal component analysis (PCA) and grouped by their own k-means for both parasites and hosts. The k-value for all clustering analyses was defined as 3 by the Elbow method.
Due to intrinsic characteristics such as communities' species composition and relationship with local environment, the differences in ecological networks can be due to species turnover, links established by shared species or a combination of both. In this sense, networks beta-diversity indexes are composed by their characteristics on species composition and interactions both on local and regional networks (Poisot et al., Reference Poisot, Canard, Mouillot, Mouquet and Gravel2012). Here we assessed three indexes that summarize this information in different ways:
(1) β s: this index corresponds to the differences on species composition between networks. A high β s means solely a high species turnover (Koleff et al., Reference Koleff, Gaston and Lennon2003).
(2) β os: this index represents the differences on interactions between shared species. It is the component of networks dissimilarity only related to interactions, not species identity (Canard et al., Reference Canard, Mouquet, Mouillot, Stanko, Miklisova and Gravel2014).
(3) β wn: this summarizes the global differences between all networks in a metaweb, calculated as β wn = β os + β st. It has two components: the difference in interactions between shared species (β os) and the difference in interactions due to species turnover (β st). Therefore, β os cannot assume values higher than β wn (Canard et al., Reference Canard, Mouquet, Mouillot, Stanko, Miklisova and Gravel2014).
These measures were calculated using the EcologicalNetworks.jl and Mangal.jl modules in Julia (Bezanson et al., Reference Bezanson, Edelman, Karpinski and Shah2017; Poisot et al., Reference Poisot, Banville and Dansereau2020a, Reference Poisot, Stock, Hoebeke, Szefer, Banville and Dalla Riva2020b) and summarized with the KGL11 function, which calculates the Sørensen index of beta-diversity (Koleff et al., Reference Koleff, Gaston and Lennon2003). β s was the only metric calculated separately for hosts and parasites because it represents their taxonomic diversities. The dissimilarity matrices resulting from this analysis represented, therefore, the differences between networks considering each of the indexes described above. In order to use these matrices on the following analyses as a single variable, we performed a PCA on each matrix and selected the component that best described the variation of the data. A subsequent PCA and k-means analysis (which) on a combined matrix of these variables allowed us to investigate how they co-vary among networks.
Results and discussion
Communities can be grouped according to network beta-diversity
The beta-diversity indexes described the dissimilarity of local networks in different ways across the metacommunity. In our case these differences were very prominent, making it possible to group communities by their interactions dissimilarity decomposition.
The first two axes of the PCA performed on the network beta-diversity indexes, which explain 95.5% of the variation of the data, separates the 50 networks (those with corresponding species in the phylogenetic trees) in those that have more similar βs, βos and βwn values (Fig. 1). This separation is more explicit between βs and βwn, and more diffuse for βos, which is aligned to the assumption that βs and βwn are only indirectly related, while βos have a more proximate relationship both with βwn and βs. The fact that the networks grouped by βs values are so different from those grouped by βwn may suggest that the turnover of species in the first group causes loss of links through loss of co-occurrence, while in the former group this turnover is translated into new connections. The βos group, however, would be composed by communities that change less in species composition, but more in ecological interactions.

Fig. 1. Principal component analysis of networks beta-diversity metrics and projection of local networks. For the dataset used here, networks are described by three dimensions of beta-diversity: while βs captures part of the variation that is complementary to that captured by βwn, βos describes a completely different dimension of the data. (A) PCA of networks beta-diversity metrics βs, βwn and βos; PCA of the phylogenetic component of PCD (PCDp) for parasites (B) and hosts (C); PCA of the compositional component of PCD (PCDc) for parasites (D) and hosts (E).
As βs and the species composition of the phylogenetic community dissimilarity (PCDc) can be interpreted in the same way, a PCA of PCDc would provide a closer look to the βs metric. Our results suggest that, from a species composition point of view, parasites communities are much more similar across the metaweb than hosts, which can be more easily described in three main groups (Fig. 1D and 1E, respectively). The diversity of fleas can be much more uniform in space because it is common that a single host interacts with more than one species of parasites. In this particular case, only a few flea communities have a distinguished species composition and can be grouped together.
On the other hand, the three groups of the phylogenetic component of PCD (PCDp) for both hosts and parasites are distinct: the diffuse group that appears in parasites' PCDc does not repeat on PCDp. Additionally, both clades are arranged similarly in the principal components space, with groups 2 and 3 being more alike than group 1. This may be a reflex of the biogeographic history of communities, where one group is ancestral to the other two.
Each beta-diversity index relates in a particular way with phylogenetically community dissimilarity (PCD)
As expected, βs and PCDc are proxies for each other both for hosts and parasites, while PCDc is inversely correlated with βwn (Fig. 2). Communities with a high βs value are very different from those around them, and the change in species composition could also represent a shift in the links inside these networks either because new species will probably explore different ranges of ecological niche or because the loss of species would also represent a loss of interaction. These changes in links inside networks are represented by βos, and its relationship with both PCDc and PCDp is highly variable (Figs 2 and 3).

Fig. 2. Effects of the compositional element of phylogenetic diversity dissimilarity on network beta-diversity for both parasites (left) and hosts (right). The colours correspond to the groups described in Fig. 1. Networks with higher values of PCDc are taxonomically more distinct and therefore have higher values of βs and lower values of βos because they do not share many species.

Fig. 3. Effects of the phylogenetic component of the phylogenetic diversity dissimilarity on network beta-diversity for both parasites (left) and hosts (right). The colours correspond to the groups described in Fig. 1. Networks with higher values of PCDp are phylogenetically more distinct, and therefore have lower values of βos (because they do not share many species). Networks better represented by βwn and βos are less distinguished on this aspect, but usually have lower values of PCDp.

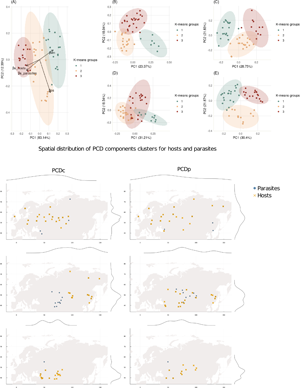
Fig. 4. Spatial distribution of PCD components for both hosts and parasites: the compositional component on the left and the phylogenetic component on the right. On the margins of each map there is a density plot to better visualize where networks are concentrated. Again, a distinct PCD cluster (as seen on the third row of maps) matches the cluster for which βs metric is more important (as in Fig. 5). For the PCDc component, there is a longitudinal separation, while for the PCDp component this separation is latitudinal (first and second rows of maps), which suggests different processes acting over different aspects of networks composition.
As any change in species composition highly affects phylogenetic diversity, βs is also positively correlated with PCDp (Fig. 3). Communities with high values for any of those metrics are located in regions with expected higher biodiversity (Figs 5 and 4), and this may indicate that the biogeographical history of these communities is more related to migration than diversification of local lineages (Davies and Buckley, Reference Davies and Buckley2011). Therefore, networks with high PCDp also represent communities with lower ecological redundancy and higher functional diversity because it indicates that the species turnover is happening between species phylogenetically distant.

Fig. 5. Spatial distribution of beta-diversity metrics. The groups illustrated in Fig. 1 are also geographically distinguished. Networks that are better represented by βs are aggregated in the centre-south of the continent, characterizing a region with a high species turnover rate. Networks which dissimilarities are due to links turnover between shared species enclose most of communities' variability, as we can also see in Figs 1–3. Finally, networks represented by βwn occupy a geographical range even more at north, with a small superposition with the geographical range of those represented by βos.
On the other hand, networks that are better represented by βwn – i.e. those which differences between them are significantly smaller than the differences in relation to the metaweb – are also phylogenetically similar, varying always inside a limited range of small dissimilarity (both with PCDc and PCDp). As these communities also have low values of βs, indicating less frequent species turnover, this dissimilarity is due to different links between shared species. This result may reflect two possible scenarios:
(1) In similar communities with low phylogenetic diversity (shorter branch lengths), the turnover of species could be adding very ecologically similar lineages, which leads to different interactions to prevent local extinction through competition.
(2) In similar communities with high phylogenetic diversity (longer branch lengths), the species turnover may have been a result of invasion and migration, which may lead to opportunistic interactions.
This is also illustrated in Figs 2 and 3 on scatterplots of βos vs PCD: networks that differ little in phylogenies have a broader range of values of βos, while highly phylogenetically distinct networks only have very low values of βos – meaning that, for communities with high values of PCD, the few species that are shared interact in the same way. Additionally, because those same communities also have low values of βwn (i.e. they are very similar to the overall metaweb) and high values of βs (i.e. high species turnover), the interactions are probably being conserved also when species are replaced, like when two species that are phylogenetically distant replace each other in the same ecological function.
The separation of communities by components of beta-diversity was also observed geographically
There is a gradual transition between networks that were better described by turnover of species, clustered in central south Eurasia, to those more unique compared to the metaweb, spread in the north (Fig. 5). The regional species pool is expected to be more diverse towards the tropics, and therefore local networks have a higher chance to have different species composition, which results in a strong contribution of βs for networks beta-diversity. Due to the high diversity, species are functionally ‘packed’, and although some species could have more generalist interactions, they would rarely do so, in order to avoid competition. Heading north, species turnover would be less frequent due to a decrease in regional species richness, and now networks have more shared species. They start to ‘unpack’ and establish interactions with other remaining species, and therefore the βos component of beta-diversity explains better why networks are different. The third group of networks, characterized by a high value of βwn, is also composed by phylogenetically similar communities (as seen in Fig. 3). As the species richness is even lower, any change in composition can have a high impact on interactions. Therefore, the βos component is still very important, but now differences in interactions due to species turnover contribute much more to networks' beta-diversity.
The PCD of networks was also geographically grouped, and in the region where βs was more important, there was a very distinguished group for both fleas' and mammals' phylogenetic dissimilarity (Fig. 4). The two other groups are differently arranged in space: PCDc groups have a similar latitudinal distribution, but different longitudinal ranges, while PCDp groups are the opposite. This distribution of phylogenetic groups highlights the uniqueness of the southern-central set of communities, which suggests historical isolation of species. Additionally, the purely phylogenetic component of PCD reinforces the geographic distribution of beta-diversity metrics as seen in Fig. 5, with one group largely spread in the north – occupying a diverse range of environments – and two other groups restricted to latitudes under 60° (Fig. 4).
Conclusion
The conspicuous association – both numerical and geographical – between the evolutionary history of species and networks' beta-diversity properties clarifies key aspects of the biogeography of hosts and parasites communities in Eurasia. For example, the longitudinal PCDc clusters separation roughly coincides with the presence of the Ural Mountains. From this point of view, considering the longitudinal spread of PCDp, the history of both hosts and parasites seems to follow a path of migration and diversification from south-central Eurasia towards the north. This history is also sustained by the metaweb beta-diversity metrics: with a distinctive βs group at the south of the Ural Mountains suggesting higher species richness and common origin, followed towards north by gradual changes in interactions and composition, they sum up to the information unveiled by PCDp to describe a very likely biogeographic history. By describing how the phylogenetic differences between networks vary in the same way within groups, this result seems to reinforce previous findings that there is no co-phylogenetic matching between regional and local networks (Poisot and Stouffer, Reference Poisot and Stouffer2018). If networks co-varied in continental scale in the same way they co-vary in local scale, our analyses would not detect the groups illustrated in Fig. 4.
Finally, this paper highlights how beta-diversity and phylogenetic dissimilarity are related to each other, and sheds light on the possibility that they interact with the environment in different ways. While βs seems to be connected to environmental uniqueness and geographical barriers, βos and βwn better reflect migration processes and evolutionary trajectories. As stated at the beginning of this text, ecological networks are valuable, multidimensional lenses through which we can investigate biodiversity and its history. Although we did not account for properties such as phenology and natural history aspects of species, we did find that small-scale processes such as species interactions can be integrated in large-scale investigations and can have a stamp in macroecological processes.
Interaction networks between parasites and hosts have great potential to be used as study systems in the geographic variation of interactions (Proulx et al., Reference Proulx, Promislow and Phillips2005; Poulin, Reference Poulin2010). Due to the particular type of association between parasites and hosts, the dissimilarity of these interactions networks reflect not only the environmental differences, but also the replacement of the host species (Krasnov et al., Reference Krasnov, Shenbrot, Mouillot, Khokhlova and Poulin2005; Poulin and Krasnov, Reference Poulin, Krasnov, Morand and Krasnov2010; Eriksson et al., Reference Eriksson, Doherty, Fischer, Graciolli and Poulin2019). Nevertheless, the association between parasites and hosts is often the result of the evolutionary history of the groups, and this history can result in a non-neutral contribution of these species to the beta diversity of these communities. The underlying logic of our approach pertains to a wide diversity of systems; not only do rodents act as reservoirs for zoonotic diseases, Albery et al. (Reference Albery, Eskew, Ross and Olival2020) show that understanding the global-scale structure of host–virus interactions requires a joint understanding of the geographical and evolutionary mechanisms involved in shaping them. We argue that when the data are available, there is even more information to be gained by looking at the way interactions vary.
Acknowledgments
We acknowledge that this study was conducted on land within the traditional unceded territory of the Saint Lawrence Iroquoian, Anishinabewaki, Mohawk, Huron-Wendat, and Omàmiwininiwak nations.
Author contribution
GH and TP designed the study and wrote the article. GH performed statistical analysis.
Financial support
GH was funded in part by the Coordenação de Aperfeiçoamento de Pessoal de Nível Superior – Brasil (CAPES) – Finance Code 001, and by the Computational Biodiversity Science and Services (NSERC/CREATE) fellowship.
Conflicts of interest
The authors declare there are no conflicts of interest.
Ethical standards
Not applicable.


