


INTRODUCTION
About a decade ago, discussing the need to bridge the information gap related to care for the dying in medical education, Frommelt posed this question: “How can we expect people to help another deal with death and dying when they are not prepared to deal with their own feelings?” (Frommelt, Reference Frommelt2003). This question was clearly rhetorical and seemed to suggest an implicit answer—namely, that education in palliative care may not exempt itself from conducting students through a process of introspection and personal growth.
During the last decade, extensive research has been conducted on medical education related to end-of-life (EoL) care. This reflects the increasing worldwide attention to a need to improve palliative care curricula. Several interesting proposals have been put forward in the literature (Braun et al., Reference Braun, Gill and Teal2013; von Gunten et al., Reference von Gunten, Mullan and Nelesen2012; Morrison et al., Reference Morrison, Thompson and Gill2012; Schillerstrom et al., Reference Schillerstrom, Sanchez-Reilly and O'Donnell2012). However, most of these address the issue from a teaching perspective, rather than from a learning perspective, and focus on assessment of the acquisition of interpersonal and communicative skills, while seemingly overlooking the student's process of personal growth and attitude development.
Only a few assessment tools have been developed to assess attitudes toward death and dying (Frommelt Reference Frommelt1991; Neimeyer, Reference Neimeyer1994; Merrill et al., Reference Merrill, Lorimor and Thornby1998), and their application in research has been rather limited. Focusing on a relationship with the dying patient during care, rather than on death and dying as general concepts, the Frommelt Attitude Toward Care of the Dying Scale Form–B (FATCOD–B) (Frommelt, Reference Frommelt1991; Reference Frommelt2003) appears to be a useful instrument for EoL care education because it provides information about the behavior of health professionals in clinical practice. Its original version, the FATCOD, had been developed for nurses (Frommelt, Reference Frommelt1991), and was slightly modified in FATCOD–B to be administered to students coming from different programs of study (Frommelt, Reference Frommelt2003). Both versions have been used in several studies investigating the factors that influence attitudes about care of the dying and evaluating the effectiveness of didactic training for EoL nursing care (Frommelt, Reference Frommelt2003; Mallory, Reference Mallory2003; Miyashita et al., Reference Miyashita, Nakai and Sasahara2007; Henoch et al., Reference Henoch, Browall and Melin-Johansson2013a ; Reference Henoch and Danielson2013b ; Leombruni et al., Reference Leombruni, Miniotti and Bovero2014a ). All of these studies derived from nursing education research and, despite its potential for use in medical education, the FATCOD–B has rarely been administered to medical students (Leombruni et al., Reference Leombruni, Miniotti and Bovero2012; Reference Leombruni, Miniotti and Torta2013; Reference Leombruni, Miniotti and Zizzi2014b ). The scale has not been used in this population, probably due to the fact that it has not been validated with a sample of medical students.
The original FATCOD–B validation study, conducted with nursing students, provided scarce information about the psychometric aspects of validity and reliability of the scale and, without empirical evidence, implicitly conceptualized the instrument as a single-dimension scale (Frommelt, Reference Frommelt2003). However, even at first reading (see Table 1), the items seem unlikely to represent a one-dimensional construct. In fact, some items have a normative nature (e.g., item 12: “The family should be involved in the physical care of the dying person”), while others relate to emotional experiences (e.g., item 3, “I would be uncomfortable talking about death with a dying person”), and still others reflect personal beliefs (e.g., item 2, “Death is not the worst thing that can happen to a person”). Not surprisingly, recent examinations of the factor structure of the FATCOD–B have found alternatives to the unidimensional conceptualization: two dimensions (Nakai et al., Reference Nakai, Miyashita and Sasahara2006; Henoch et al., Reference Henoch, Browall and Melin-Johansson2013a ) and even four dimensions (Leombruni et al., Reference Leombruni, Miniotti and Bovero2014a ) have been suggested. These data-driven studies used variable-reduction techniques (e.g., principal-component analyses) and were explorative. Though compelling solutions were proposed, they have not been confirmed as of yet.
Table 1. FATCOD items: Distributional properties and homogeneity

Notes: S = skewness; K = kurtosis; K–S test = Kolmogorov–Smirnov test of univariate normality; α item deleted is Cronbach's α calculated omitting each single item from the scale.
(a) All Kolmogorov–Smirnov values are significant, p<0.001; Lilliefors correction.
Our present study examined the psychometric properties of the Italian version of the FATCOD–B by testing the functioning of items with data from a sample of medical students and by checking the efficiency of a proposed two-dimensional model using confirmatory factor analysis (CFA). (See Appendix 1 for a comparison of the Italian and original versions.) We therefore designed our study to: (1) identify malfunctioning items (i.e., those that appear ambiguous, contain complex wording, or have apparently high specificity) that increase the scale's heterogeneity and do not contribute to a definition for the construct the scale is intended to measure; and (2) test the factor structure of the FATCOD–B by imposing a two-dimensional orthogonal structure for a theoretically meaningful and parsimonious scale construct.
METHODS
Participants
The research participants were Italian students in their second year at the University of Turin Medical School. All participating students were properly informed about the purposes and methods of the study and voluntarily agreed to participate. Ethical approval was obtained from the University of Turin Ethical Review Committee. The study was conducted in accordance with the principles of the Helsinki Declaration.
Instruments
To investigate students' attitudes toward end-of-life care, the Frommelt Attitude Toward Care of the Dying Scale form B (FATCOD–B) was used (Frommelt, Reference Frommelt2003; Mastroianni et al., Reference Mastroianni, Piredda and Frommelt2009). The FATCOD–B is a self-administered questionnaire consisting of 30 randomly ordered items scored on a 5-point Likert-type scale. Half of the statements are positively worded and the other half negatively. The statements describe beliefs about palliative care, including the patient's decision-making autonomy, the doctor's emotional involvement in the patient's experience, care of the patient's family, and pain treatment. Positive items are scored as follows: 1 = strongly disagree, 2 = disagree, 3 = uncertain, 4 = agree, 5 = strongly agree. Scores are reversed for negative items. Total possible score ranges from 30 to 150, with higher scores indicating a more positive attitude toward the care of dying patients. The Italian version of the FATCOD–B was back-translated by a native English speaker, which yielded a version equivalent to the original.
Procedures
To standardize administration of the self-report paper-and-pencil questionnaire and to increase response rates, we conducted the research at the beginning of a course on palliative care developed for second-year students by the University of Turin Medical School. The data were collected before the course began on the first day of classes. To increase the sample size, we combined the data collected at the beginning of the present academic year (2013/2014) with the data collected at the beginning of the preceding one (2012/2013). There were no specified time limits for completing the questionnaire, and its administration took about 10 minutes. Responses were confidential and collected anonymously. Each participant received an identification number when the data were entered.
Statistical Analyses
Descriptive statistics were performed using IBM SPSS software (v. 20.0). To evaluate the psychometric properties of the FATCOD–B, the original sample was randomly divided. An item analysis was conducted using data from one subsample (n = 300) to detect critical items, particularly those recognized as problematic in the recent literature (Nakai et al., Reference Nakai, Miyashita and Sasahara2006; Henoch et al., Reference Henoch, Browall and Melin-Johansson2013a ). Scale reliability was assessed with Cronbach's coefficient α, while the contribution to internal consistency at the item level was evaluated by item–total correlations. Additional evidence on item functioning was obtained through an exploratory factor analysis (EFA) on the same subset of items and with the same specifications used in previous studies (i.e., 29 items, item 10 excluded; principal-component extraction; assumption of two dimensions and orthogonal solution) to compare this study's item reduction to the results of Japanese and Swedish studies (Nakai et al., Reference Nakai, Miyashita and Sasahara2006; Henoch et al., Reference Henoch, Browall and Melin-Johansson2013a ).
Exploratory factor analysis permits only data-driven analysis when construct dimensionality (number of factors) and structure (pattern of loadings) are empirically determined from the item correlations, rather than theoretically determined and imposed on the data. To overcome the limitations of EFA, the item validity and factor structure of FATCOD–B were examined using confirmatory factor analysis (CFA) with data from the second subsample (n = 308). Measurement models of the FATCOD–B were estimated by the robust ML method in Lisrel software (v. 8.72). Because a prior descriptive analysis did not show a normal multivariate distribution in either subsample, the Prelis package was employed to compute the asymptotic covariance matrix to correct the ML estimations obtained using Lisrel 8.72 (Jöreskog & Sörbom, Reference Jöreskog and Sörbom2004). CFA model evaluation and comparison were conducted using the Comparative Fit Index (CFI) (Bentler, Reference Bentler1990), the root-mean-square error of approximation (RMSEA) (Browne & Cudeck, Reference Browne, Cudeck, Bollen and Long1993), and the standardized root-mean-squared residual (SRMR) (Jöreskog & Sörbom; Reference Jöreskog and Sörbom1981; Bentler, Reference Bentler1995). Following Hu and Bentler (Reference Hu and Bentler1999), a cutoff value close to 0.95 for the CFI, close to 0.6 for the RMSEA, and close to 0.8 for the SRMR were chosen as an efficient strategy to evaluate model fit. Furthermore, to compare non-nested models, the consistent Akaike information criterion (CAIC) (Akaike, Reference Akaike1987) and the Expected Cross-Validation Index (ECVI) (Browne & Cudeck, 1989) were considered. Finally, the Satorra and Bentler scaled difference χ² (SB–Diff) was utilized to identify significant differences between specified nested models (Satorra & Bentler, Reference Satorra and Bentler2001; Bryant & Satorra, Reference Bryant and Satorra2012).
RESULTS
Sample Demographics
All participants (N = 608) completed the FATCOD–B questionnaire and indicated their age and gender: 273 (44.9%) men and 335 (55.1%) women; mean of 20.5 years (SD = 1.2).
Reliability, Item Analysis, and Exploratory Factor Analysis of the FATCOD–B
Reliability on all items, measured by Cronbach's α, was 0.699. Item–total correlations were low and ranged from 0.03 to 0.39. Items 25 and 2 were strongly inhomogeneous with the full scale, with item–total correlation values of 0.03 and 0.08, respectively. In addition, items 4, 8, 10, 12, 18, 23, 24, 29, and 30 had low correlations; however, deletion of these items neither altered nor increased the homogeneity of the full scale.
The results of our analysis were similar to those found in the Japanese and Swedish studies. The responses could be appropriately reduced to two principal components that explained at least 20% of the variance. The amount of variance accounted for by the components was rather small, but the eigenvalue sequence suggested that a two-dimensional structure was the correct solution. The two components—labeled FATCOD I_Ita and FATCOD II_Ita—contained 13 and 14 items, respectively, and there were at least 10 items with acceptable loadings (>0.3) in each component. Considering only these latest items (1, 3, 5, 7, 8, 9, 11, 13, 14, 15, 26, and 27 for the first component; 1, 4, 6, 16, 18, 20, 21, 22, 23, 28, and 30 for the second; item 1 loaded on both components), Cronbach's α was 0.650 for the first component and 0.658 for the second (these values were 0.696 and 0.575 in the Swedish study). The remaining seven items (2, 12, 17, 19, 24, 25, and 29) did not contribute to the factorial solution, and items 2, 12, 25, and 29 were identified as critical by the reliability analysis (see Table 2).
Table 2. FATCOD–B subscales by means of principal-component analysis: Japanese, Swedish, and Italian structures
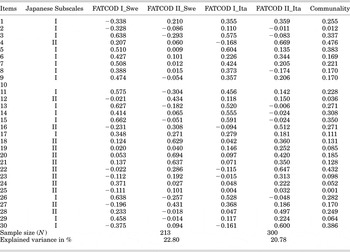
Notes: Number of factors fixed at two. Extraction method: principal-component analysis. Rotation method: varimax with Kaiser normalization. Items included in the Japanese subscales (I, II) by Miyashita et al. (Reference Miyashita, Nakai and Sasahara2007) and in the Swedish subscales (FATCOD I_Swe, FATCOD II_Swe) by Henoch et al. (Reference Henoch, Browall and Melin-Johansson2013a ; Reference Henoch and Danielson2013b ) are shown.
Confirmatory Factor Analysis of the FATCOD–B
Because the FATCOD–B was originally built to measure one construct, the first estimated model (M1) was congeneric, with all 30 items loaded on one factor. This model had a poor fit and did not perform satisfactorily, and the fit indices did not achieve the preselected cutoff values (see Table 3).
Table 3. Alternative models of the FATCOD–B: Fit indices

Notes: MFF χ2=minimum fit function χ2; norm χ2 = Normal χ2; df = degrees of freedom; SB χ2 = Satorra–Bentler χ2; RMSEA = root-mean-square error of approximation; SRMR = standardized root mean squared residual; CFI = Comparative Fit Index; ECVI = Expected Cross-Validation Index; CAIC = consistent Akaike information criterion. The suffix “R” indicates that the model was revised due to poor item performances, in terms of modification index, significance of parametric estimations, or item variance accounted by the model.
A new model (M2), which added a latent dimension to M1, yielded substantial benefits: RMSEA and SRMR were reduced to 0.05, the χ2/df ratio fell below 2, and the CFI index, though it did not reach the cutoff value, increased to 0.73 (see Table 3 for further details). In addiction, M2 was more parsimonious (CAIC = 1220.64) and had better-than-expected cross-validation (ECVI = 3.05) than M1 (see Table 3 for further details). An analytical appraisal found that some items were incorrectly loaded in M2: the modification indices suggested that item 27 should be placed on the first factor and item 30 on the second, as in the results of the EFA.
A revised model (M2R1) had better features than M2: all fit indices improved, though the CFI index remained below the set threshold, fixed at 0.94 (see Table 3). The M2R1 solution was still unsatisfactory, not only due to the low CFI value (0.78) but also because evaluation of the estimate parameters suggested that item 1 should be loaded on both factors, and items 2, 17, 19, 24, 25, and 29 should be removed because of nonsignificant loadings or explained variance (R 2) less than 0.10. These items were the same identified as problematic by the EFA. A further revised model (M2R2) tested the significance of the double loading of item 1, and the Satorra–Bentler test (SB–Dif = 661.86, df = 1, p < 0.001) found significant differences between M2R1 and M2R2; otherwise, item 1 might be correctly loaded on both factors (see Table 3 for further details). Another revised model (M2R3) omitted items 2, 17, 19, 24, 25, and 29 from the scale. The loss of information caused by this item elimination yielded a measurement benefit, confirming that the omitted items were irrelevant, but the CFI value remained lower than 0.9 (see Table 3) and the SRMR increased to 0.08. Moreover, even though significant, the parameters expressing the relationship with the latent factors were quite weak for a few items (see Figure 1).

Fig. 1. Confirmatory factor analysis of the FATCOD–B: 24-item assessment (M2R3).
DISCUSSION
Overall, the findings from the present study confirm that the FATCOD–B Scale construct is two-dimensional, corroborating previous research (Nakai et al., Reference Nakai, Miyashita and Sasahara2006; Henoch et al., Reference Henoch, Browall and Melin-Johansson2013a ). However, the structure of this construct is quite weak due to items with poor validity (i.e., high levels of item measurement error).
Descriptive Analyses and Exploratory Factor Analysis
In general, the FATCOD–B scale appears to include a cluster of “poor items,” which have little variance in common. Item analysis suggests that the FATCOD–B items were not very homogeneous nor related to each other. In our opinion, the correlation values highlighted what we expected from the review of item wording and content. Several items of the scale are general and quasi-existential, others refer to beliefs about the patient's or the family's role in end-of-life care, and still others pertain to emotions related to care of the dying. Previous studies investigated the factorial structure of the FATCOD–B, perhaps due to its wording and content, by excluding item 10 from the analyses (Nakai et al., Reference Nakai, Miyashita and Sasahara2006; Henoch et al., Reference Henoch, Browall and Melin-Johansson2013a ). In the present study, item 10 did not appear to be the worst item in terms of phrasing and scale homogeneity; however, we performed EFA with item 10 excluded and with the same methods (i.e., extraction and rotation) used in previous studies in order to compare item performance.
Compared to the Japanese (Nakai et al., Reference Nakai, Miyashita and Sasahara2006) and Swedish (Henoch et al., Reference Henoch, Browall and Melin-Johansson2013a ) factor solutions, the factor solution found in the our study seemed to have a more balanced component composition. The first component, labeled FATCOD I_Ita, is composed of 13 items and might be prudently designated “positive attitudes toward the care of the dying person.” The second component, labeled FATCOD II_Ita, is composed of 14 items and could be denoted “perception of patient- and family-centered care.” These two components were quite similar to those identified by Nakai and colleagues (Reference Nakai, Miyashita and Sasahara2006) and by Henoch and coworkers (Reference Henoch, Browall and Melin-Johansson2013a ). However, item loading (i.e., allocation between components and size, and hierarchy within each component) indicated that these dimensions were not identical. In the Swedish solution, items 4 and 24 loaded on the first component instead on the second, as in the Japanese solution. In our solution, four items loaded on the “opposite” (in reference to both previous studies) component: items 6, 29, and 30 loaded on FATCOD II_Ita rather than on FATCOD I_Ita, and item 27 loaded on FATCOD II_Ita instead on FATCOD I_Ita.
In summary, we could argue that the items of the FATCOD–B may not be clearly focused on the construct the scale intended to measure, based on the descriptive and explorative item analysis performed by us. In addition, the items could be interpreted differently according to the cultural context or, worse, biased by lexical noise (i.e., “patient,” “family,” “nurse”), ambiguity (i.e., semantic generality), and content format (i.e., normative vs. emotional statements).
Confirmatory Factor Analysis
With the hypothetical two-dimensional factor structure of the FATCOD–B found in the present and in previous research (Nakai et al., Reference Nakai, Miyashita and Sasahara2006; Henoch et al., Reference Henoch, Browall and Melin-Johansson2013a ) and the cluster of malfunctioning items observed (item 10 included) in mind, we developed a set of confirmatory measurement models, specified to test scale dimensionality and item validity. From the CFA results, we found that the FATCOD–B does not measure a single latent dimension, despite the original intention of its developer (Frommelt, Reference Frommelt1991; Reference Frommelt2003). The scale construct seems to be two-dimensional, although the structure is inconsistent due to items that do not reflect the intended construct (Edwards & Bagozzi, Reference Edwards and Bagozzi2000). Loadings on the two dimensions and their indicators are weak, and certain items are not different from zero. The construct structure may be better defined by eliminating at least six items, but an abbreviated scale solution provided only partially satisfactory measurements. Continuing to remove items was an inefficient strategy, from both the theoretical and empirical perspectives. Reducing the FATCOD–B to less than 22 items could result in a severe reduction in the content covered by the original scale.
LIMITATIONS
The present study had some limitations that should be mentioned. First, considering the absence of criteria and convergent or divergent constructs related to the attitude the scale aimed to measure, this work cannot be considered a complete-validation study. Second, we used a convenience sample for data gathering, and this could limit the generalizability of our findings. Third, our study is not exempt from the common bias related to the use of self-report measures—namely, that the researcher cannot determine the extent to which responses accurately reflect the respondents' feelings, beliefs, and expectations toward their future experience, as doctors, in the care of dying patients.
CONCLUSION
Despite the aforementioned limitations, the present study adds new evidence about the psychometrics and factor structure of the FATCOD–B. The scale measures a two-dimensional construct, and several items could be revised or even omitted from the scale. However, when attempting to measure a multidimensional construct, the content coverage of each dimension must be preserved. Each deleted item causes a loss of content and construct validity, and exposes researchers to the risk that the abbreviated scale does not measure the construct intended for the original scale (Smith et al., Reference Smith, McCarty and Anderson2000). Furthermore, every data-driven respecification of the model might result in attempts to solve, a posteriori and by means of statistical analyses, problems regarding item wording and construct definition.
The original version of the scale could be employed as a trace in building a revised version of the FATCOD–B, in which items would be formulated so as to avoid ambiguity and lexical noise, taking particular care to distinguish among items that concern emotions and beliefs implied in the care for the dying, as well as their subjects (i.e., the healthcare provider, the patient, and his or her family).
SUPPLEMENTARY MATERIALS AND METHODS
The supplementary material referred to in this article can be found online at journals.cambridge.org/pax.


