Introduction
Many intervals in geological history have served as case studies in the biological effects of climate change, including the Paleocene–Eocene thermal maximum and the Miocene thermal optimum (Wolfe Reference Wolfe1994; Kraus and Riggins Reference Kraus and Riggins2007). The evidence for past climate change comes from a variety of paleoclimate proxies such as ice and sediment cores, palynology, speleothem records, and the isotopic composition of soil carbonate and organic matter in paleosols (Curry and Baker Reference Curry and Baker2000; Serefiddin et al. Reference Serefiddin, Schwarcz, Ford and Baldwin2004; Tripsanas et al. Reference Tripsanas, Bryant, Slowey and Bouma2007; Oerter et al. Reference Oerter, Sharp, Oster and Ebeling2016). However, the most commonly used proxies for the Quaternary are the composition of ancient faunas. Many Quaternary taxa are still extant, and their climatic requirements are thought to be mostly unchanged, so Quaternary fossils can be interpreted as paleoclimate proxies (Hashemi et al. Reference Hashemi, Ashouri and Aliabadian2015). One taxon commonly used is the family Testudinidae: tortoises. Modern North American tortoises prefer a mean annual temperature of approximately 22°C, and it is assumed that this held true throughout the Quaternary (Hibbard Reference Hibbard1960). Statistical studies on the diversity, body size, range size, and distribution of turtles as a whole seem to provide support for this idea (Angielczyk et al. Reference Angielczyk, Burroughs and Feldman2015). As a result, fossil tortoises have even been used as biostratigraphic indicators of interglacial conditions (Nordt et al. Reference Nordt, Bongino, Forman, Esker and Benedict2015). Recent studies on potential behavioral and physiological thermoregulation in tortoises have questioned this association (Moll and Brown Reference Moll and Brown2017). No attempt has been made to quantify the thermal properties of each fossil tortoise taxon, however. This study evaluates the quantitative basis for a fossil tortoise–based paleoclimate proxy.
The Quaternary tortoise genera found in the southern United States and northern Mexico were the high-domed Hesperotestudo—previously assigned to Geochelone—and the vertically compressed Gopherus and Xerobates. Of these, only small (<10 kg) members of Gopherus and Xerobates persist in the region today (Kazmaier et al. Reference Kazmaier, Hellgren and Synatzske2001). Modern North American tortoises are only found south of 34°N, but fossil tortoises occur as far north as Ellesmere Island, Canada (82°N) in the Paleogene and as far north as Pennsylvania and Indiana (40°N) during the Pleistocene (Parris and Daeschler Reference Parris and Daeschler1995; Eberle et al. Reference Eberle, Fricke and Humphrey2009; Czaplewski et al. Reference Czaplewski, Farlow and Argast2013). Modern North American tortoises live in mesic to xeric habitats and are almost exclusively herbivorous (Rostal et al. Reference Rostal, McCoy and Mushinsky2014). Most of the ~20 tortoise genera outside North America live in warm climates with low seasonality (Lagarde et al. Reference Lagarde, Bonnet, Nagy, Henen, Corbin and Naulleau2002; Fritz et al. Reference Fritz, Alcalde, Vargas-Ramírez, Goode, Fabius-Turoblin and Praschag2012).
Hibbard (Reference Hibbard1960) used the existence of non-analogue herpetofaunas as evidence of a qualitatively less seasonal climate during parts of the Pleistocene. Some sites, such as Pipe Creek Sinkhole in Indiana, contain extraliminal reptilian and amphibian taxa with modern ranges to the north or south of the sinkhole, indicating taxa adapted to a mesic climate with broad latitudinal ranges (Hibbard Reference Hibbard1960). Hibbard thought that the existence of “Geochelone” crassiscutata at Pipe Creek implied that climate in the region at the time of deposition had less extreme lows than those occurring in the upper Great Plains in the modern day (Hibbard Reference Hibbard1960).
Extant species of “Geochelone” live in warmer environments than current conditions in the southern United States or northern Mexico. Early twentieth-century attempts to transplant these species to the Gulf Coastal plains, Mexican Plateau, and the Sonoran and Mojave Deserts failed (Hibbard Reference Hibbard1960). Furthermore, behaviors for coping with temperature extremes, such as burrowing and salivating, documented in genera like Gopherus and Xerobates, are absent in Geochelone. The interpretation of the equable climate tolerance of tortoises (Hibbard, Reference Hibbard1960) was extended to infer low temperature variability, even in the absence of extraliminal taxa living in cooler and warmer modern climates (Jackson and Kaye Reference Jackson and Kaye1975; Holman Reference Holman1980; Nordt et al. Reference Nordt, Bongino, Forman, Esker and Benedict2015; Biewer et al. Reference Biewer, Sankey, Hutchison and Garber2016). Molecular and morphological phylogenetics has revealed Geochelone contains only two species, and both are restricted to south Asia (Crumly Reference Crumly1984; Le et al. Reference Le, Raxworthy, McCord and Mertz2006; Fritz and Bininda-Emonds Reference Fritz and Bininda-Emonds2007). North American fossil tortoises are not in the subfamily Testudininae with Geochelone, so environmental and behavioral inferences based on the habits of these south Asian animals may lack merit (Fig. 1A–C). Tortoises’ significance as a paleoclimate indicator in the late Pleistocene should be reexamined, given their present distribution across Eurasia, Africa, and the Americas and broad latitudinal range of ~40°S to ~40°N (Leidy Reference Leidy1868; Cope and Drinker Reference Cope and Drinker1895; Sellards Reference Sellards1916, Reference Sellards1917; Hay Reference Hay1917, Reference Hay1926; Simpson Reference Simpson1930; Gidley and Gazin Reference Gidley and Gazin1938; Brattstrom Reference Brattstrom1954, Reference Brattstrom1961; Auffenberg Reference Auffenberg1958, Reference Auffenberg1962; Crook and Harris Reference Crook and Harris1958; Holman Reference Holman1958, Reference Holman1959a,Reference Holmanb, Reference Holman1962; Mecham Reference Mecham1958; Dalquest Reference Dalquest1962; Bonifay and Bonifay Reference Bonifay and Bonifay1963; Gut and Ray Reference Gut and Ray1963; Edmund Reference Edmund1965; Schultz Reference Schultz1969; M.-F. Bonifay Reference Bonifay1973; Converse Reference Converse1973; Bachmayer Reference Bachmayer1975; Bachmayer and Symeonidis Reference Bachmayer and Symeonidis1975; Malatesta Reference Malatesta1980; Mangili Reference Mangili1980; Roth and Laerm Reference Roth and Laerm1980; Parmley Reference Parmley1986; Holman and Winkler Reference Holman and Winkler1987; Westgate Reference Westgate1989; Bon and Sala Reference Bon and Sala1991; E. Bonifay Reference Bonifay1991; de Broin Reference de Broin1991; Amani and Geraads Reference Amani and Geraads1993; Raynal et al. Reference Raynal, Geraads, Magoga, El Hajraoui, Texier, Lefevre and Sbihi-Alaoui1993; Rhodes Reference Rhodes1994; Barbato and Gliozzi Reference Barbato and Gliozzi1995; Emslie Reference Emslie1995; Meylan Reference Meylan1995; Morgan and Hulbert Reference Morgan and Hulbert1995; Dundas et al. Reference Dundas, Smith and Verosub1996; Pajak et al. Reference Pajak, III and Bell1996; Salotti et al. Reference Salotti, Baiion, Bonifay, Courtois, Dubois, Ferrandini, Ferrandini, La Milza, Mourer-Chauviré and Popelard1997; Agusti et al. Reference Agusti, Oms and Pares1999; Hervet and Salotti Reference Hervet and Salotti2000; Cantalamessa et al. Reference Cantalamessa, Di Celma, Bianucci, Carnevale, Coltorti, Delfino, Ficcarelli, Espinosa, Naldini and Pieruccini2001; Wagner and Prothero Reference Wagner and Prothero2001; Meers and Hulbert Reference Meers and Hulbert2002; Bianucci and Landini Reference Bianucci and Landini2005; Cisneros Reference Cisneros2005; Steadman et al. Reference Steadman, Franz, Morgan, Albury, Kakuk, Broad, Franz, Tinker, Pateman and Lott2007; Brinkman et al. Reference Brinkman, Li, Ye, Wu and Zhang2008; Dundas Reference Dundas and Putirka2013; Harvati et al. Reference Harvati, Darlas, Bailey, Rein, El Zaatari, Fiorenza, Kullmer and Psathi2013; Thomas et al. Reference Thomas, Granatosky, Bourque, Krysko, Moler, Gamble, Suarez, Leone, Enge and Roman2014)
Figure 1. Selected phylogenies of tortoises. A, Morphological phylogeny of extant tortoises. Modified from Crumly (Reference Crumly1984). B, Molecular phylogeny of extant tortoises. Modified from Le et al. (Reference Le, Raxworthy, McCord and Mertz2006). C, Morphological phylogeny of modern xerobatine tortoises and their fossil relatives. Adapted from Reynoso and Montellano-Ballesteros (Reference Reynoso and Montellano-Ballesteros2004).
Modeling the thermal biology and ecology of individual extinct taxa yields a quantitative basis to assess the temperature tolerance of extinct vertebrates, independent of modern analogues. Thermodynamic modeling has provided insights into the ecology and climate requirements of early synapsids, dinosaurs, and a variety of smaller poikilotherms (Bennett Reference Bennett1996; Head et al. Reference Head, Bloch, Hastings, Bourque, Cadena, Herrera, Polly and Jaramillo2009; Sander et al. Reference Sander, Christian, Clauss, Fechner, Gee, Griebeler, Gunga, Hummel, Mallison, Perry, Preuschoft, Rauhut, Remes, Tütken, Wings and Witzel2011; Clarke et al. Reference Clarke, Angilletta and Bronstein2013). One consistent result of thermodynamic modeling was the high thermal inertia of large bodies (>25 kg), which enhances the organism's tolerance to diurnal temperature fluctuations (Sander et al. Reference Sander, Christian, Clauss, Fechner, Gee, Griebeler, Gunga, Hummel, Mallison, Perry, Preuschoft, Rauhut, Remes, Tütken, Wings and Witzel2011; Seymour Reference Seymour2013). This research focused on reconstruction of the thermobiology of extinct tortoises. To this end, estimates of size and mass are needed for extinct tortoises. This contribution provides straightforward numeric analysis and models to estimate tortoise mass and thermal inertia, which yield new quantitative relations for paleoclimatic inferences.
Methods
Biometrics of Living Tortoises
Linear morphometric measurements were taken of living tortoises to evaluate the correlation between measurable external features of tortoises and their weight. Previous approaches identified straightforward osteological measurements that correlate significantly with mass in extant relatives of the extinct organism under study (Cassini et al. Reference Cassini, Vizcaíno and Bargo2012). Various measurements were taken of shell attributes of living tortoises, analogous to counterparts in the fossil record (Supplementary Table 1).
Tortoise shells are composed of a dorsal carapace and a ventral plastron. These shell parts, often well preserved, consist of an inner layer of osteoderms connected by a thin sheet of innervated fibrous tissue to an outer layer of keratinous scutes (Morales Pérez and Serra Reference Morales Pérez and Serra2009; Bramble and Hutchison Reference Bramble, Hutchison, McCoy and Mushinsky2014). These scutes have sulci around their perimeters that anchor them to the osteoderms (Chiari et al. Reference Chiari, Hyseni, Fritts, Glaberman, Marquez, Gibbs, Claude and Caccone2009). Therefore the dimensions of the scutes are measurable even when only the osteoderms remain. After the weight of a live tortoise was determined, 8 measurements were taken of the whole shell and 61 measurements were taken of the dimensions of individual scutes (Supplementary Table 1). In total, 108 tortoises of 10 genera and 18 species were examined for a total of ~7000 measurements of carapaces and scutes (Supplementary Table 2). This study excluded six tortoises of the genera Malacochersus and Kinixys from analysis, because their shell morphologies were unlike any other genus of tortoise. Measurements of the carapace and carapacial scutes were completed on all tortoises, but plastral measurements were restricted to tortoises that weighed ≤50 kg, because of safety concerns for all involved. These size measurements were regressed against the tortoise's live weight to determine the mathematical function to estimate a fossil tortoise's corresponding weight.
Linear Measurement versus Mass Regressions
Estimating the live weight of an extinct organism is a matter of geometry: the mass of solid objects of identical shapes and differing sizes, scaling with the cube of any linear measurement.
The formula is:
 $$y = a\lpar {x^b} \rpar $$
where x is the linear measurement, y is the mass, a is a constant for that measurement, and b, the rate function, is 3. This is called isometric growth, rare among vertebrates.
Most vertebrates undergo allometric growth, in which different parts of the organism grow at different rates, leading to varying proportions of body parts over time. The degree of allometry for different body parts is described by the variable b in equation (1), such that b can be >3 or <3. If the mass of the animal increases slowly in reference to a linear measurement that deviates from isometric growth, then b < 3. If the mass of the animal increases comparatively quickly in reference to a linear measurement, then b > 3. The rate variable (b) in the length versus weight regressions for the tortoises varied between 2.5 and 3.5, reflecting anatomical features that become proportionally smaller and larger through ontogeny, respectively. By measuring the dimensions of whole shells and individual scutes on multiple tortoises, this method allows us to produce equations of allometry for each measurement. In turn, these equations can be used to estimate mass.
Thermal Modeling
There is a lack of studies on the thermal tolerances of tortoises. Specifically, the effect of low temperatures on tortoise viability is poorly documented. Freezing is an obvious danger; tortoise tissue starts to freeze at −1.6°C, but North American tortoises survive momentary supercooling to −6.0°C in only <5% of trial runs (Spotila et al. Reference Spotila, Radzio, O'Connor, Rostal, McCoy and Mushinsky2014). Tortoises rely on hindgut fermentation to extract nutrients from food. Low temperatures can reduce the activity of a tortoise's gut flora until it starves or dies of gastroenteritis (Hibbard Reference Hibbard1960). For this reason, veterinarians caution that small captive North American tortoises should be brought indoors when the nighttime temperature drops below ~4.4°C (Bailey Reference Bailey1992; Nussear et al. Reference Nussear, Esque, Haines and Tracy2007). Conservatively, we choose 5.0°C as the viable limit for modeling.
An empirical thermal model was developed to estimate the temperature tolerance of extinct tortoises. Tortoise temperatures were taken with an infrared thermometer and a FLIR thermal imaging camera, thus there was no physical interaction with the tortoises during measurements. The temperature of nine tortoises of seven species was monitored and recorded at regular intervals of 3 or 9 minutes for 45 to 720 minutes. For six of the tortoises, the initial body temperature was ~30°C after basking outdoors, with cooling of the tortoise monitored indoors with an air temperature of ~20°C. The ambient indoor temperature was recorded simultaneously with tortoise temperatures. The remaining three tortoises, >100 kg members of the genera Chelonoidis and Aldabrachelys, were monitored over 12 hours in their outdoor enclosure as ~30°C daytime temperatures dropped to nighttime temperatures of ~20°C. As moving between habitats with different temperatures is a regular part of reptile behavior, approval from the Baylor Institutional Animal Care and Use Committee was unnecessary. Ultimately, 11 time series were recorded for cooling of tortoises (Supplementary Table 3). The tortoise temperatures were regressed simultaneously against time and ambient air temperature to produce a 3D curve (Fig. 2). These data lead to the formulation for cooling of tortoises:
 $$T = a\lpar {t^{0.5} \times {(\ln T_a)}^2} \rpar + b$$
Figure 2. The 3D regression describing cooling from R#18, Aldabrachelys gigantea. The x-axis represents time in seconds, the y-axis represents ambient temperature in degrees Celsius, and the z-axis represents tortoise temperature in degrees Celsius. r 2 = 0.961, RMSE = 0.1696.
where T is the tortoise's temperature, t is the time in seconds, and T a is the ambient air temperature. The constant a is determined by the mass of the tortoise:
 $$\eqalign{& a = -0.00347 \times \lpar {m^2-0.16067m} \rpar / \cr & \lpar {m^2-0.27616m + 0.01853} \rpar}$$
where m is the tortoise's mass in kilograms. The constant b is determined by the starting temperature of the tortoise:
 $$b = 0.7062T_{init} + 9.17{\rm \;} $$
where T init is the tortoise's initial temperature in degrees Celsius. The a and b values of the cooling curves for each live tortoise in the thermal modeling study, along with the r 2 values, are shown in Table 1. Example cooling curves are shown in Fig. 3.

Figure 3. Cooling curves for four living tortoises. Dots indicate measured temperatures during cooling, lines indicate cooling curves calculated according to equation (2). A, R#23 Pyxis planicauda, a = −0.0055, b = 30.0421, correlation = 0.996, RMSE = 1.007; B, R#1 Xerobates berlandieri, a = −0.0037, b = 28.1589, correlation = 0.938, RMSE = 0.685; C, Un# CPZ Astrochelys radiata, a = −0.0035, b = 26.2365, correlation = 0.887, RMSE = 0.352; D, R#18 Aldabrachelys gigantea, a = −0.0035, b = 31.5723, correlation = 0.994, RMSE = 0.595.
Table 1. Constants for equation (2) for each living tortoise used to develop the thermal model, along with an r 2 value for the correlation between the model and the measured temperatures. An asterisk (*) indicates that the animal belongs to D.A.E.; all other tortoises are property of the Cameron Park Zoo. The R# refers to the “record numbers” listed for each tortoise in Supplementary Table 2.
Results
Estimating Weight of Extinct Testudinids
Sixty-nine mathematical functions were determined between tortoise weight and associated linear measurements of the shells and scutes (Supplementary Table 2). Sixty-two regressions returned an r 2 > 0.90, of which 48 had an r 2 > 0.95, and 2 had an r 2 > 0.99 (Supplementary Table 2). The straight carapace length, curved carapace width, medial height, and straight width of the first vertebral scute all had r 2 values >0.95 (see Fig. 4A–D, Table 2). Regressions with lower r 2 values reflect measurements of sexually dimorphic features such as the humeral and anal scutes (Fig. 5A,B, Table 3; McRae et al. Reference McRae, Landers and Cleveland1981). Sexual dimorphism arising from differences in allometry are recognized in tortoises (Regis and Meik Reference Regis and Meik2017). These regressions can be applied to tortoise genera with typical one-half triaxial ellipsoid shell morphologies, to yield estimates on tortoise mass. This analysis excludes only the hingeback tortoises in the genus Kinixys, whose carapace can shorten when the tortoise is alarmed, and the pancake tortoises in the genus Malacochersus, whose shell is discoid. These regressions can be used to estimate a fossil tortoise's mass, when the outline of a single scute is visible. This mass estimate provides a basis for the thermal modeling of North American Pleistocene tortoises. Thus, four specimens of fossil tortoises from Texas are targets for thermal modeling: an H. crassiscutata from Zesch Cave UT-VPL 40685-B15F4; an H. wilsoni from Friesenhahn Cave UT-VPL 9333-732; a giant Gopherus specimen cf. Gopherus “hexagonatus” from Willacy County UT-VPL 971-1; and a Xerobates cf. X. berlandieri from Lake Creek Lake MM# P-13453. The reconstructed weights range from 1.8 to ~340 kg (Fig. 6, Table 4).

Figure 4. Four linear measurement vs. weight regressions that yielded high (>0.95) r 2 values. Solid line is the regression, dashed lines denote 95% confidence interval. Plotted in log-log space. A, Straight carapace length; B, curved carapace width; C, straight width of first vertebral scute; D, medial height. Insets show graphs without log-scaled x-axes.
Figure 5. Two linear measurement vs. weight regressions that yielded low (<0.90) r 2 values. Solid line is the regression, dashed lines denote 95% confidence interval. Plotted in log-log space. A, Length of anals; B, straight width across humerals. Insets show graphs without log-scaled x-axes.

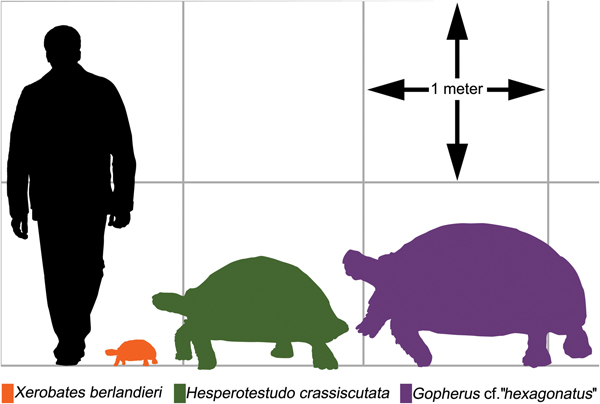
Figure 6. Silhouettes of modern and tortoises in comparison to a 1.88-m-tall human. Left, Xerobates berlandieri CPZ R#2, 211 mm straight carapace length (SCL). Center, Hesperotestudo crassiscutata UT-VPL 40685-B15F4, 875.3 mm SCL. Right, Gopherus cf. “hexagonatus,” UT-VPL 971-1, 1208 mm SCL.
Table 2. Selected regressions with high (>0.95) r 2 values. All equations take the form of y = axb, where a is a scaling constant, b is the exponent of allometry, and x is the linear measurement.
Table 3. Selected regressions with low (<0.90) r 2 values. All equations take the form of y = axb, where a is a scaling constant, b is the exponent of allometry, and x is the linear measurement.
Table 4. Modeled weights for four fossil tortoises from Texas. UT-VPL, University of Texas Vertebrate Paleontology Laboratory; MMC, Mayborn Museum Center.
Modeled Heat Loss Curves for Extinct Texas Testudinids
Heat loss when exposed to 0°C was modeled for four tortoises. Three of these are fossil specimens of the genera Gopherus and Hesperotestudo, and the fourth is an extant specimen of the genus Pyxis. In each model the tortoise starts with a body temperature of ~30°C. The heat-loss curve for the largest tortoise reconstructed, the cf. Gopherus “hexagonatus” (UT-VPL 971-1), (Fig. 7A, Table 5) indicates that without behavioral thermoregulation, ~32.9 hours is needed to reach a nonviable body temperature; this was the longest cooling time modeled. The shortest cooling time was modeled with an adult Pyxis planicauda (R#25) approximately the same mass (~150 g) as a hatchling giant tortoise. When exposed to freezing temperatures, this P. planicauda specimen would drop to a nonviable body temperature in ~2.3 hours (Blake et al. Reference Blake, Yackulic, Cabrera, Tapia, Gibbs, Kümmeth and Wikelski2013) (Fig. 7B, Table 5).
Figure 7. Hypothetical cooling curves for Pleistocene tortoises. A, Gopherus cf. “hexagonatus” UT-VPL 971-1 reaching an unviable temperature in ~33 hours; B, Pyxis planicauda R#25 reaching an unviable temperature in ~2.4 hours.
Table 5. The a and b values of hypothetical cooling curves of fossil tortoises as seen in equation (2). Tortoises with asterisks (*) are live animals being treated as fossils for the purposes of the study. They were not actually subjected to low temperatures, however. CPZ, Cameron Park Zoo, Waco, Tex.; MMC, Mayborn Museum Complex, Baylor University, Waco, Tex.; UT-VPL, University of Texas–Austin Vertebrate Paleontology Research Laboratory, Austin, Tex.
Discussion
This project developed 69 linear measurement versus weight regressions to provide a quantitative basis to reconstruct mass based on partial preservation of a tortoise carapace and diagnostic scutes (Supplementary Table 1). The regressions developed here provide reliable weight estimates for all tortoises with domed, non-kinetic carapaces. The whole-carapace measurements all have regressions with an r 2 ≥ 0.95 (Supplementary Table 4). Curvilinear measurements produced slightly higher r 2 values than linear ones, as seen later (Supplementary Table 2). Complete tortoise shells make up a small percentage of tortoise fossils (Behrensmeyer and Turner Reference Behrensmeyer and Turner2017). To allow for continuous growth, the bones of the tortoise shell never fuse entirely, but are held together by fibrous tissue and crenulated sutures. If not buried promptly, the shell disarticulates into individual osteoderms (Jackson et al. Reference Jackson, Varricchio, Jackson, Walde and Bishop2015).
Fragmentary material is sufficient to reconstruct tortoise weights. Most regressions based on the dimension of individual scutes typically had r 2 values >0.90 and a normalized root-mean-square error (nRMSE) of ~0.07 (Supplementary Table 2). On the carapace, the scutes that yield the highest r 2 values are the vertebrals, located at the dorsal midline (Fig. 8). The underlying neural osteoderms are connected in a series by the vertebral column and fibrous connective tissue at the sutures. As a result, the complete outlines for vertebral scutes are often preserved. The pleural scutes, which stretch between the vertebrals and the marginals, also produce regressions with high r 2 values and low nRMSE (Fig. 8, Supplementary Table 2). The regressions for the outer ring of carapacial scutes, the marginals and caudal scute (Fig. 8), are the least statistically significant for reconstructing a fossil tortoise's weight. The presence of a cervical scute, at the anterior end of the carapace above the neck, is variable between conspecific individuals in many tortoise species (Rostal et al. Reference Rostal, McCoy and Mushinsky2014). As a result, the proportions of the marginal and caudal scutes on the edge of the carapace vary more than for other carapacial scutes. In addition, when the tortoise fossil is fragmentary, the shape of the marginal scutes differs very little, possibly leading to misidentification.
Figure 8. Tortoise measurement diagram with abbreviations (# represents arabic numeral in figure). FH, frontal height; MH, medial height; H#M, height at #th marginal scute; L, length; CL, curved length; W, width; CW, curved width; W#M, width across #th marginal pair; CVW, width of cervical scute, if present; L#V, length of the #th vertebral scute; W#V, curved width of the #th vertebral scute; SW#V, straight width of the #th vertebral scute; RPl#L, length of the right #th pleural scute; LPl#W, width of the left #th pleural scute; RM#L, length of the right #th marginal scute; CUW, width of supracaudal scute, if present; LM#W, width of the left #th marginal scute; CUL, supracaudal scute length, if present; LG, length of gular scutes; WG, width of gular scutes; LGH, combined length of gular and humeral scutes; WH, width of humeral scutes; AL, length of anal scutes; AW, width of anal scutes. Further instructions and explanations in Supplementary Table 4. Adapted from Chiari et al. (Reference Chiari, Hyseni, Fritts, Glaberman, Marquez, Gibbs, Claude and Caccone2009).
The carapace of a tortoise varies less with sex and ontogeny than the plastron does. Thus, regressions using carapacial measurements have higher r 2 values and higher mean percent errors than plastral regressions (Supplementary Table 2). If no carapacial material is measurable, plastron length and width across the humerals both yield r 2 values >0.90 and mean percent errors of <20%. The straight carapace length regression predicts that a tortoise with a 1-m-long carapace should weigh ~194 kg, though within two sigma errors the potential weight range is between 155 and 233 kg. This range is partially attributable to the gut content of the tortoise (Sadeghayobi et al. Reference Sadeghayobi, Blake, Wikelski, Gibbs, Mackie and Cabrera2011).
Modeling the heat dissipation physiology of a fossil tortoise is possible with a statistically accurate estimate of its live weight. We modeled the thermoregulation and temperature tolerance for four Pleistocene tortoises. The results of the thermal model indicate that even large tortoises could not have survived more than ~33 hours of continuously freezing temperatures. These results are consistent with the prior assertion that fossil tortoises indicate hyperthermic to thermic paleoclimates, though not entirely frost-free environments. This analysis indicates that giant tortoises would be in imminent danger at below-freezing temperatures after 20 to 30 hours. This inference is consistent with data on the geographic distribution of most, but not all, modern tortoises. Using national and international climate databases, it was possible to determine which regions typically have ≥33 consecutive hours of freezing temperatures and then match these to the mean annual temperature (MAT) and mean winter low temperature (MWLT) for each region (National Weather Service 2017; National Centers for Environmental Information 2018; U.S. Department of Commerce 2019a,b). Xerobates berlandieri is restricted to south of 29°N. Concordant with model results, this region rarely has >33 consecutive hours of freezing conditions that would kill giant tortoises, and it has a mean annual temperature ≥22°C (Table 6). Of the four fossil tortoises modeled here, one comes from a latitude of 31.5°N, now too cold for tortoises at MAT = 19°C (Table 6). The modern Chelonoidis chilensis is found at even higher latitudes, 40°S, and colder average temperatures, MAT = 14°C, where the model indicates that tortoises should not survive (Fritz et al. Reference Fritz, Alcalde, Vargas-Ramírez, Goode, Fabius-Turoblin and Praschag2012; Servicios Climáticos Argentina 2017). The presence of Chelonoidis sp. indicates that behavioral thermoregulation or physiological differences between species may allow tortoises greater tolerance to low temperatures than indicated by this study. If so, the extinction of giant tortoises from North America and the significant range reduction in the smaller species may reflect other factors.
Table 6. Climate data from 1981 to 2010 for 18 counties within the modern range of Xerobates berlandieri. Counties without weather stations were excluded (National Climatic Data Center 2010). Modern climate data for the Lake Creek Lake site is listed at the bottom. MAT, mean annual temperature.
Some modern tortoises of the genus Xerobates have specialized diets with a dependence on plants with a crassulacean acid metabolism (CAM plants) such as Opuntia (Rostal et al. Reference Rostal, McCoy and Mushinsky2014). Recent reductions in suitable browse have caused three of five North American tortoises species to be listed as “vulnerable” by the International Union for the Conservation of Nature (IUCN 2018). Changes to the moisture regimes and temperature variability of North America that adversely affected CAM plant populations would result in a trophic cascade for the animals dependent on them, including tortoises. Other factors that might influence tortoise populations are the presence of soil types that can be burrowed, access to natural burrows or caves suitable for bromating—entering a state of lowered metabolic activity to survive cold weather—or environmental disturbances to the reproductive cycle (Laloë et al. Reference Laloë, Cozens, Renom, Taxonera and Hays2017). If Pleistocene tortoises could burrow or make use of preexisting caves or burrows to thermoregulate, it would weaken the association between tortoises and warm climates.
The thermal model and associated paleoclimate inferences should be considered within the context of tortoise ecology and behavior. Thus, tortoises may be an indicator of warmer, less seasonal conditions in the Pleistocene, but only within the context of other fossil species (Hibbard Reference Hibbard1960; Holman Reference Holman1980). This numerical heat-loss model makes it possible to quantify the maximum survivable number of consecutive freezing hours at a site, thus improving the usefulness of a vertebrate assemblage containing tortoises as a paleoclimate proxy.
Conclusions
1. The weight of extinct and extant tortoises can be estimated from 69 individual or combined linear measurements of the carapace, plastron, and individual scutes. The regressions between weight and shell linear measurements were significant for 15 of 17 taxa, except for two extant tortoise genera, Malacochersus and Kinixys, which are absent in the North American Pleistocene fossil record. The 15 most common taxa yielded 66 significant regressions between weight and a linear shell measurement, with r 2 values >0.90 and nRMSE values between 0.006 and 0.16, with a mean of 0.071. The regression between curved carapace length and weight has the highest r 2 (0.993), with an nRMSE of 0.040. This regression has been found to be applicable to fossil tortoises with weights between 1.8 and ~339 kg. Seven measurements produce regressions with r 2 values <0.90: gular length, anal length, length across the first pair of marginals, length across the second pair of marginals, cervical scute width, anterior carapace thickness, and posterior carapace thickness (Supplementary Table 2). Future work to determine whether these regressions work with other taxa of turtles should be straightforward.
2. The empirical thermal model produced results consistent with temperature measurements of living tortoises. Heat-loss measurements of a living tortoise show that the simplifying assumptions of the model concerning geometry, composition, and metabolism of tortoises result in agreement within two sigma errors between the model-derived values and measurements.
3. This numeric analysis indicates that at 0°C tortoises not engaging in behavioral or metabolic thermoregulation will reach nonviable temperatures in 2 to 30 hours, depending on size. This temperature tolerance corresponds to an MAT ≥ 22°C and an MWLT ≥ 7.5°C, which approximates the preferred habitat temperature of current American tortoise genera (National Climatic Data Center 2010). This analysis infers higher MAT and MWLT for the survivability of tortoises in a Pleistocene context than previous estimates, which may reflect warmer micro-environments and/or geographically widespread past warm states. It is ill advised to use a single fossil occurrence for paleoclimatic inference, but an assemblage framework, including tortoise fossils, provides an improved context for evaluating the warmth of interglaciations.
Acknowledgments
The authors thank the many wonderful Texas zoos that allowed them to measure tortoises, including the Cameron Park Zoo in Waco (CPZ), the San Antonio Zoo, the Austin Zoo, the Caldwell Zoo in Tyler, the Frank Buck Zoo in Gainesville, and the Abilene Zoo. Special thanks to the Central Texas Tortoise Rescue, the San Benito Wildlife and Nature Center and Tortoise Refuge for access to their specimens. Special thanks go to G.B. Henley of the CPZ for allowing overnight observation of giant tortoises. Appreciation is also extended to the members of TortoiseForum.com for sending us measurements of tortoises. We are grateful for access to fossil tortoises provided by the Mayborn Museum Complex, Baylor University, and the University of Texas–Austin Vertebrate Paleontology Research Laboratory. Special thanks also go to S. Esker and J. Robinson, tortoise wranglers. Finally, a heartfelt thank you to the lead author's late father, D. E. Esker Jr., for encouraging his scientific pursuits.