


Introduction
Symbiont-bearing taxa, including corals (Hughes et al. Reference Hughes, Kerry, Baird, Connolly, Dietzel, Eakin, Heron, Hoey, Hoogenboom, Liu, McWilliam, Pears, Pratchett, Skirving, Stella and Torda2018) and larger benthic foraminifera (Spezzaferri et al. Reference Spezzaferri, El Kateb, Pisapia and Hallock2018), can lose algal endosymbionts in a process known as “bleaching,” which can be fatal (Donner et al. Reference Donner, Skirving, Little, Oppenheimer and Hoegh-Gulberg2005; Hallock et al. Reference Hallock, Williams, Fisher and Toler2006). Warming due to anthropogenic carbon emissions is associated with increased bleaching and mortality and has significantly impacted the health of coral reef communities. In the open ocean, photosymbiont-bearing planktonic foraminifera play significant roles in ecosystems and biogeochemical cycles (Schiebel Reference Schiebel2002), but few studies have considered how photosymbiosis affects the response of species to past episodes of environmental change. This knowledge gap is important: if photosymbiont associations are particularly vulnerable, their breakdown could lead to dramatic shifts in pelagic ecosystems. In addition, planktonic foraminifera are important geochemical recorders of past global warming events, and changing photosymbiont associations could complicate the interpretation of the environmental signals they preserve.
A positive correlation between foraminiferal size and carbon isotope composition may indicate photosymbiont activity in planktonic foraminifera (Spero and DeNiro Reference Spero and DeNiro1987). Photosymbionts preferentially remove 12C, leaving dissolved inorganic carbon (DIC) enriched in 13C to be incorporated into foraminiferal tests (Spero et al. Reference Spero, Bijma, Lea and Bemis1997). Larger specimens harbor more symbionts and therefore are relatively more enriched in 13C than smaller individuals (Spero et al. Reference Spero, Lerche and Williams1991). Thus, photosymbiont-bearing planktonic foraminifera generally have higher δ13C values (intercepts) and steeper size-specific δ13C curves (slopes) than asymbiotic foraminifera. Decreases in the size-δ13C slope are commonly attributed to bleaching (Wade et al. Reference Wade, Al-Sabouni, Hemleben and Kroon2008; Edgar et al. Reference Edgar, Bohaty, Gibbs, Sexton, Norris and Wilson2013; Luciani et al. Reference Luciani, D'Onofrio, Dickens and Wade2017; Si and Aubry Reference Si and Aubry2018) but may be driven by other factors, such as a change in the type or number of symbionts, a change in seasonality or depth habitat of host foraminifera, or a change in the extent of gametogenic calcification (Norris Reference Norris1998; Birch et al. Reference Birch, Coxall, Pearson, Kroon and O'Regan2013; Ezard et al. Reference Ezard, Edgar and Hull2015).
The size-δ13C relationship has been used to argue that bleaching was a contributing factor in the extinction of Morozovelloides crassatus in the latest middle Eocene (~38 Ma) (Wade et al. Reference Wade, Al-Sabouni, Hemleben and Kroon2008) and for localized responses of photosymbiont associations in the genera Acarinina and Globigerinatheka during the middle Eocene climatic optimum (MECO, ~40 Ma) (Edgar et al. Reference Edgar, Bohaty, Gibbs, Sexton, Norris and Wilson2013). Henehan et al. (Reference Henehan, Edgar, Foster, Penman, Hull, Greenop, Anagnostou and Pearson2020) provided further support for localized responses of photosymbiont associations to the MECO by finding no reduction in isotopic gradients in the south Atlantic or equatorial Pacific. Warming during the MECO amounted to only ~2°C over 100 kyr at Site 1051 (Edgar et al. Reference Edgar, Bohaty, Gibbs, Sexton, Norris and Wilson2013), and it seems questionable that such low warming rates, during the relatively cooler mid-late Eocene, would result in bleaching. Bleaching has also been invoked as a response to the even more gradual, multimillion-year warming into the early Eocene climate optimum (Luciani et al. Reference Luciani, D'Onofrio, Dickens and Wade2017). Compounding the problem of interpreting isotopic signals are the potential effects of diagenesis (Pearson et al. Reference Pearson, Ditchfield, Singano, Harcourt-Brown, Nicholas, Olsson, Shackleton and Hall2001) and sediment mixing (Hull et al. Reference Hull, Franks and Norris2011; Kirtland Turner et al. Reference Kirtland Turner, Hull, Kump and Ridgwell2017; Hupp et al. Reference Hupp, Kelly, Zachos and Bralower2019; Hupp and Kelly Reference Hupp and Kelly2020), which alter the primary isotopic signal and/or its interpretation.
The relationship between warming and bleaching is complicated by the fact that photosymbiont-bearing planktonic foraminifera appear to have been more resilient to warming than asymbiotic foraminifera during the Paleocene–Eocene thermal maximum (PETM), the largest abrupt global warming event of the Cenozoic (Kelly Reference Kelly2002; Petrizzo Reference Petrizzo2007). Photosymbiotic taxa migrated to higher latitudes, evolved into short-lived species and morphotypes (“excursion taxa”), and increased in abundance relative to asymbiotic clades (Kelly et al. Reference Kelly, Bralower, Zachos, Silva and Thomas1996; Kelly Reference Kelly2002; Speijer et al. Reference Speijer, Scheibner, Stassen and Morsi2012) in most sites. The exceptions to this generalization are a few low-latitude, neritic localities where it has been argued that exceptionally high local temperatures resulted in the total exclusion of eukaryotic plankton (Aze et al. Reference Aze, Pearson, Dickson, Badger, Bown, Pancost, Gibbs, Huber, Leng, Coe, Cohen and Foster2014; Frieling et al. Reference Frieling, Reichart, Middelburg, Röhl, Westerhold, Bohaty and Sluijs2017). Some of these species may have also changed depth habitat and photosymbiont associations (Kelly et al. Reference Kelly, Bralower, Zachos, Silva and Thomas1996; Si and Aubry Reference Si and Aubry2018), affecting their isotopic composition. Interestingly, photosymbiotic scleractinian corals also appear relatively resilient (i.e., lower extinction rates) than asymbiotic species from the latest Paleocene to early/middle Eocene (Weiss and Martindale Reference Weiss and Martindale2019), and there is no evidence for an elevated extinction across scleractinians at this time (Simpson et al. Reference Simpson, Kiessling, Mewis, Baron-Szabo and Müller2011). There is, however, abundant evidence for a contraction in the extent of coral–algal dominated reefs (Pandolfi and Kiessling Reference Pandolfi and Kiessling2014) and an expansion of encrusting foraminifera-dominated microbial reefs at this time (Plaziat and Perrin Reference Plaziat and Perrin1992; Scheibner and Speijer Reference Scheibner and Speijer2008).
Here we investigate changes in planktonic foraminiferal photosymbiont ecology across the PETM (~55.8 Ma), when sea-surface temperatures may have risen by 5°C–8°C, at low and high latitudes, respectively (Zachos et al. Reference Zachos, Wara, Bohaty, Delaney, Petrizzo, Brill, Bralower and Premoli-Silva2003; Dunkley Jones et al. Reference Dunkley Jones, Lunt, Schmidt, Ridgwell, Sluijs, Valdes and Maslin2013) over 2–5 kyr (Kirtland Turner et al. Reference Kirtland Turner, Hull, Kump and Ridgwell2017; Kirtland Turner Reference Kirtland Turner2018). Many estimates of warming and carbon emissions across this event were generated using the isotope compositions of planktonic foraminifera. Deconvolving the effect of biological change on proxy-based environmental reconstructions is thus central to understanding the mechanisms and effects of the PETM. We generated new records of size-specific stable isotope compositions and relative abundance changes in three clades of planktonic foraminifera from three ocean drilling sites (Sites 1209, 401, and 690) (Fig. 1) and considered these along with size-specific isotope records from Millville, NJ (Si and Aubry Reference Si and Aubry2018).

Figure 1. Paleogeographic map for 55 Ma (www.odsn.de; Hay et al. Reference Hay, DeConto, Wold, Wilson, Voigt, Schulz, Wold, Dullo, Ronov, Balukhovsky and Söding1999). Sites used in analyses indicated by black circles; other sites cited in the text indicated by gray circles.
Materials and Methods
Site Locations and Depths
Data are presented from seven time slices at ODP Site 1209 (Central Pacific, paleolatitude = ~24°N), five time slices at DSDP Site 401 (midlatitude North Atlantic, paleolatitude = ~43°N), and seven time slices at ODP Site 690 (Southern Ocean, paleolatitude = ~66°S), spanning the PETM (Fig. 1, Supplementary Tables 1–6; paleodepths of all sites = 1900–2000 m during the PETM) (Winguth et al. Reference Winguth, Thomas and Winguth2012). We compared our data with those from Millville on the New Jersey shelf (ODP Leg 174X) (Si and Aubry Reference Si and Aubry2018), at a paleolatitude of 35°N (Kopp et al. Reference Kopp, Schumann, Raub, Powars, Godfrey, Swanson-Hysell, Maloof and Vali2009) and a paleodepth of ~70–150 m (Sugarman et al. Reference Sugarman, Miller, Browning, McLaughlin, Brenner, Buttari, Cramer, Harris, Hernandez, Katz, Lettini, Misintseva, Monteverde, Olsson, Patrick, Roman, Wojtko, Aubry, Feigenson, Barron, Curtin, Cobbs, Cobbs, Bukry and Huffman2005; Stassen et al. Reference Stassen, Speijer and Thomas2014).
Methods
We measured stable carbon and oxygen isotopes of planktonic foraminiferal tests across the PETM in samples from Sites 401, 690, and 1209 sorted by size. Samples from Site 1209 were sieved into 6 size fractions (150–425 μm), from Site 401 into 10 size fractions (75 to >425 μm), and from Site 690 into 7 size fractions (125 to >355 μm) (Supplementary Table 1). Different size fractions were used at each site as data were collected by separate research groups and initially intended for different studies. We refer to size fractions by their smaller sieve-size boundary, that is, “150” refers to 150–180 μm. In each size fraction, we aimed to measure 30 individuals per taxon (as an averaged, homogenized sample).
Photosymbiont-bearing and non-photosymbiont-bearing planktonic foraminiferal species in three clades (Acarinina, Morozovella, and Subbotina) were targeted (see Supplementary Table 1 for breakdown of species; Supplementary Figs. 5–6). These three genera are by far the most common planktonic genera in early Paleogene assemblages (Kelly Reference Kelly2002; Petrizzo Reference Petrizzo2007; Figs. 2–4). Acarinina and Morozovella have size-δ13C trends and oxygen isotope–inferred habitat depths indicative of photosymbiont-bearing, mixed-layer life histories (Pearson et al. Reference Pearson, Olsson, Huber, Hemleben and Berggren2006). Carbon and oxygen isotope ratios in Subbotina, by contrast, suggest an asymbiotic, thermocline-dwelling life history (D'Hondt et al. Reference D'Hondt, Zachos, Schultz and Summer1994). Deep-sea (asymbiotic) epifaunal foraminifera (Nuttallides truempyi) were also measured at Site 1209 for comparison with preexisting measurements from the same species at Sites 401 and 690 (references in Figs. 2–4). Site 1209 specimens were photographed before isotopic analysis (Supplementary Table 3), and preservation was examined using scanning electron microscopy (SEM) (Supplementary Fig. 1).

Figure 2. Abundance and isotopic data for foraminifera from ODP Site 1209. Blue background shading indicates onset of the Paleocene–Eocene thermal maximum (PETM). A, Percent abundance of Acarinina, Morozovella, and Subbotina (Petrizzo Reference Petrizzo2007). B, Time slice–specific size-δ13C of planktonic foraminifera, with sample placement indicated by green triangles in A and C, if within the plotted depth range. Gray inset lines indicate maximum size-δ13C slope (same across all panels). C, Published foraminiferal and bulk carbonate δ13C data (Zachos et al. Reference Zachos, Wara, Bohaty, Delaney, Petrizzo, Brill, Bralower and Premoli-Silva2003; Dutton et al. Reference Dutton, Lohmann and Leckie2005; Tripati and Elderfield Reference Tripati and Elderfield2005; Takeda and Kaiho Reference Takeda and Kaiho2007; Westerhold et al. Reference Westerhold, Röhl, Donner, Mccarren and Zachos2011; Gibbs et al. Reference Gibbs, Bown, Murphy, Sluijs, Edgar, Pälike, Bolton and Zachos2012; Penman et al. Reference Penman, Hönisch, Zeebe, Thomas and Zachos2014). Blue gradient indicates onset of the PETM. rmcd, revised meters composite depth.
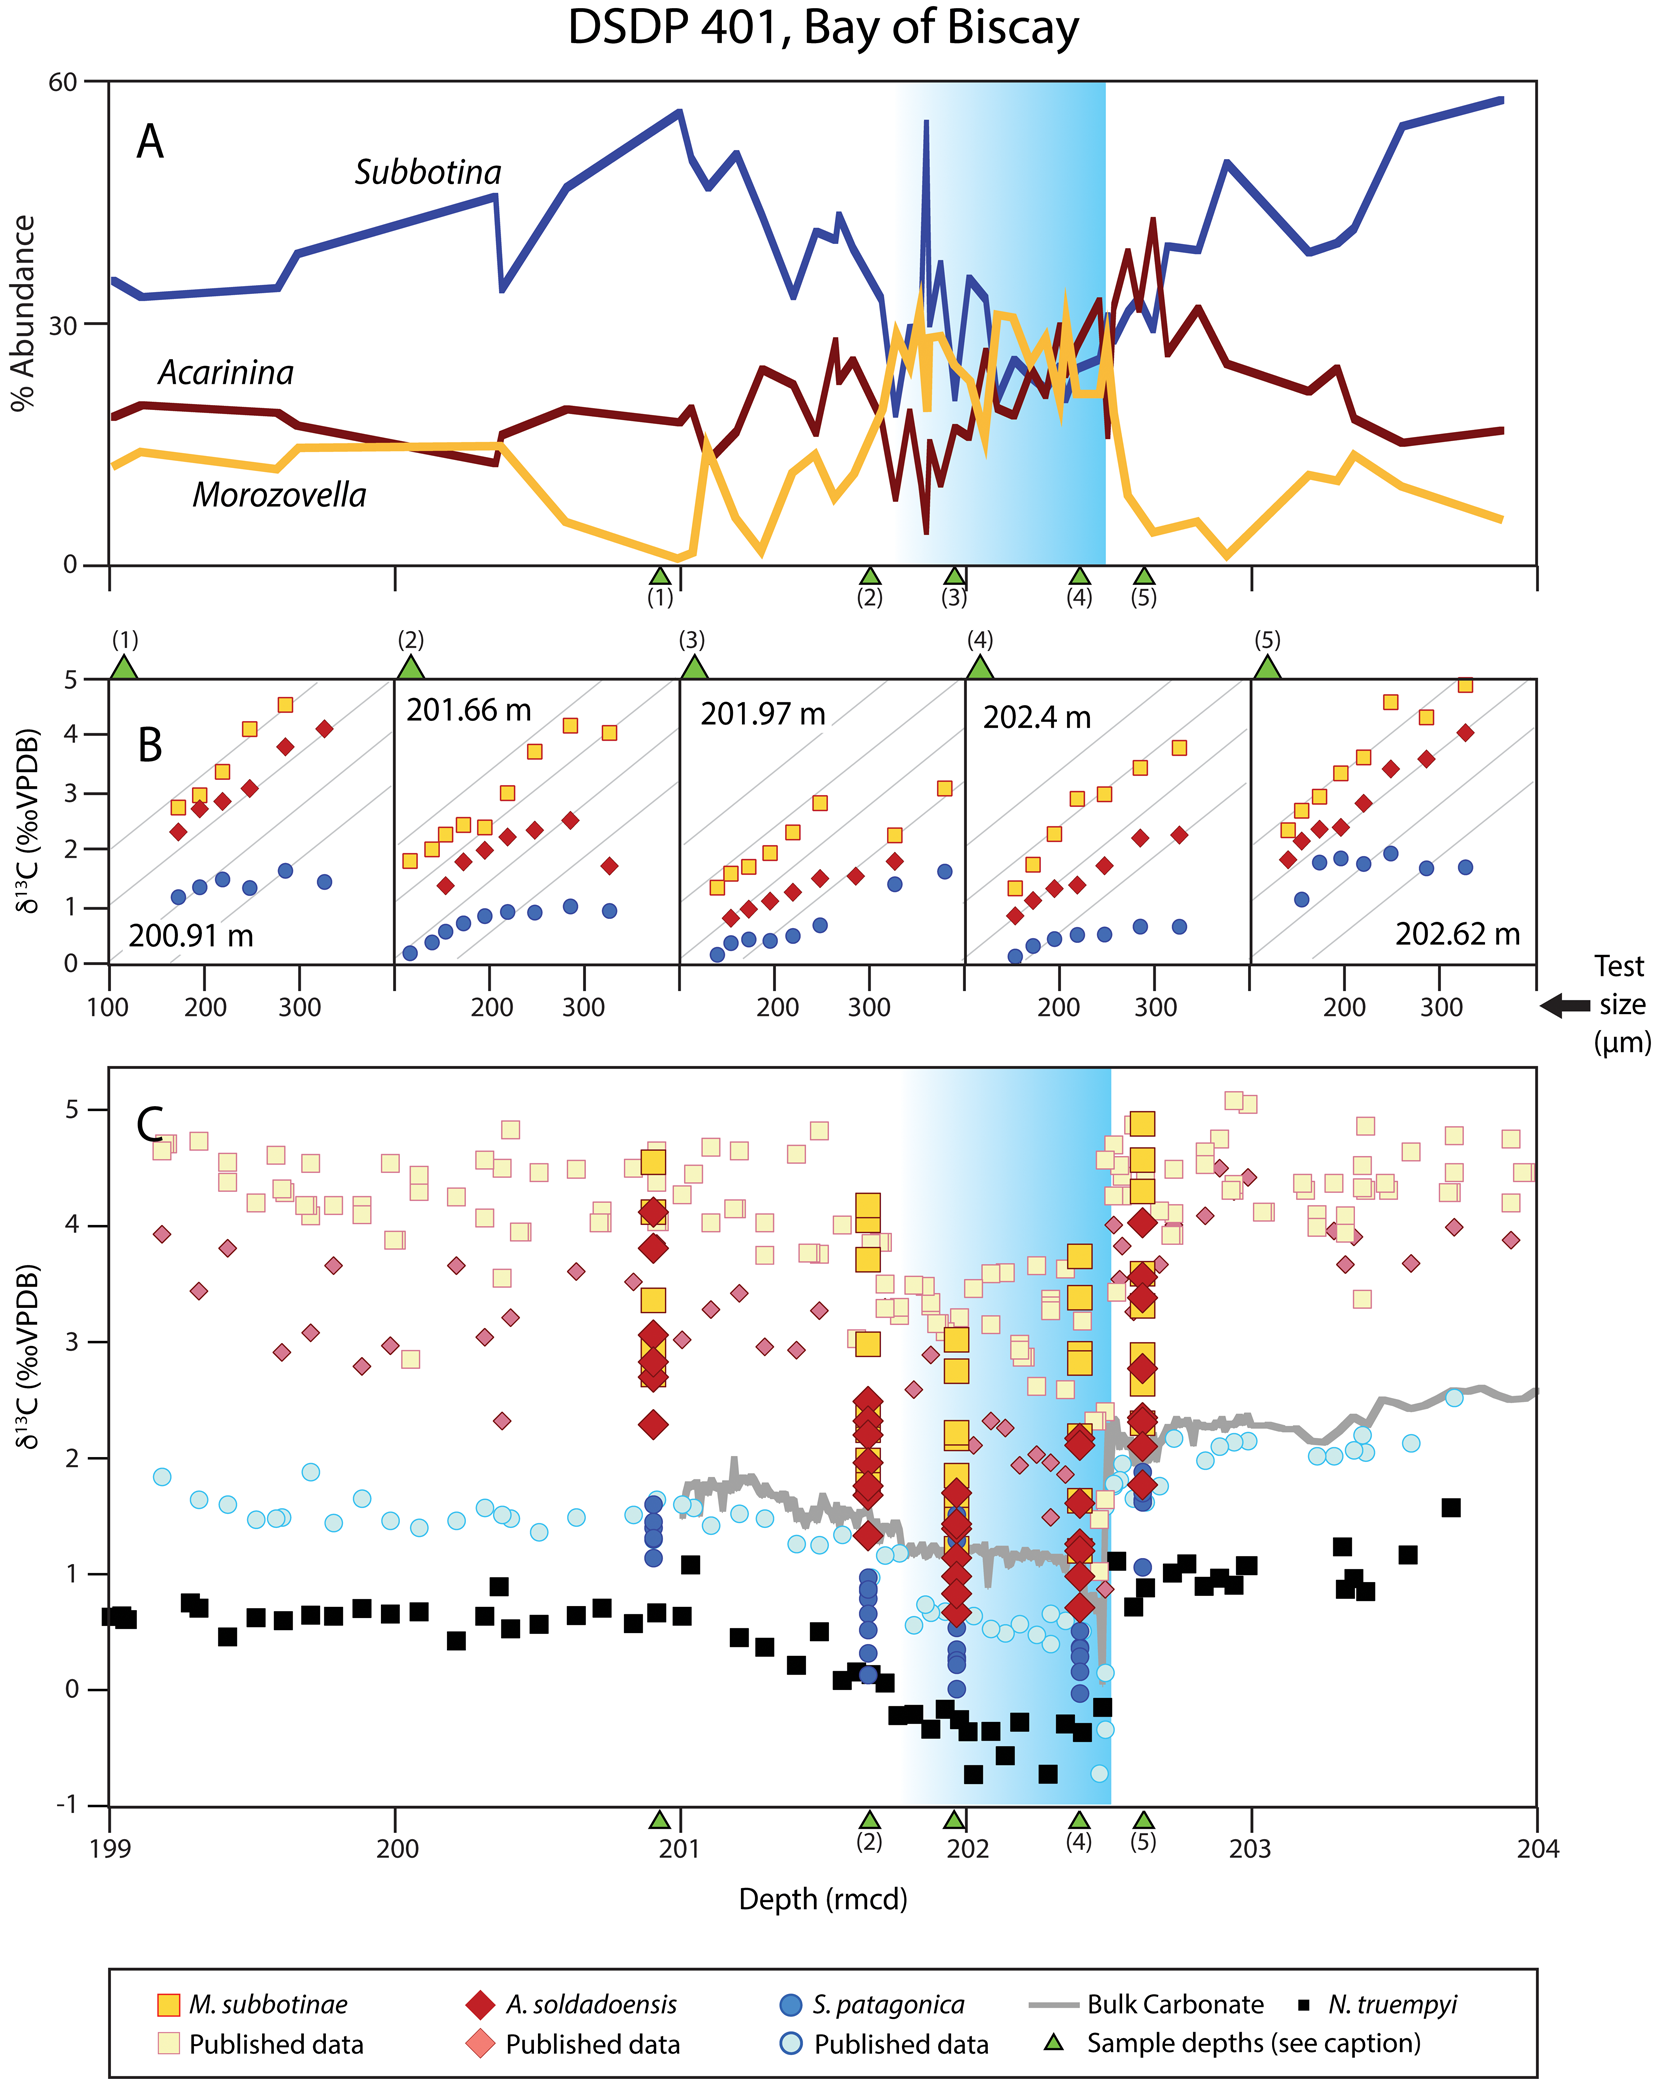
Figure 3. Abundance and isotopic data for foraminifera from DSDP Site 401. Blue background shading indicates onset of the Paleocene–Eocene thermal maximum (PETM). A, Percent abundance of Acarinina, Morozovella, and Subbotina. B, Time slice–specific size-δ13C of planktonic foraminifera, with sample placement indicated by green triangles in A and C, if within the plotted depth range. Gray inset lines indicate maximum size-δ13C slope (same across all panels). C, Published foraminiferal and bulk carbonate δ13C data (Pardo et al. Reference Pardo, Keller, Molina and Canudo1997; Katz et al. Reference Katz, Katz, Wright, Miller, Pak, Shackleton and Thomas2003; Nunes and Norris Reference Nunes and Norris2006; D'Haenens et al. Reference D'Haenens, Bornemann, Roose, Claeys and Speijer2012; Bornemann et al. Reference Bornemann, Norris, Lyman, D'haenens, Groeneveld, Röhl, Farley and Speijer2014, Reference Bornemann, D'haenens, Norris and Speijer2016; Gutjahr et al. Reference Gutjahr, Ridgwell, Sexton, Anagnostou, Pearson, Pälike, Norris, Thomas and Foster2017). rmcd, revised meters composite depth.
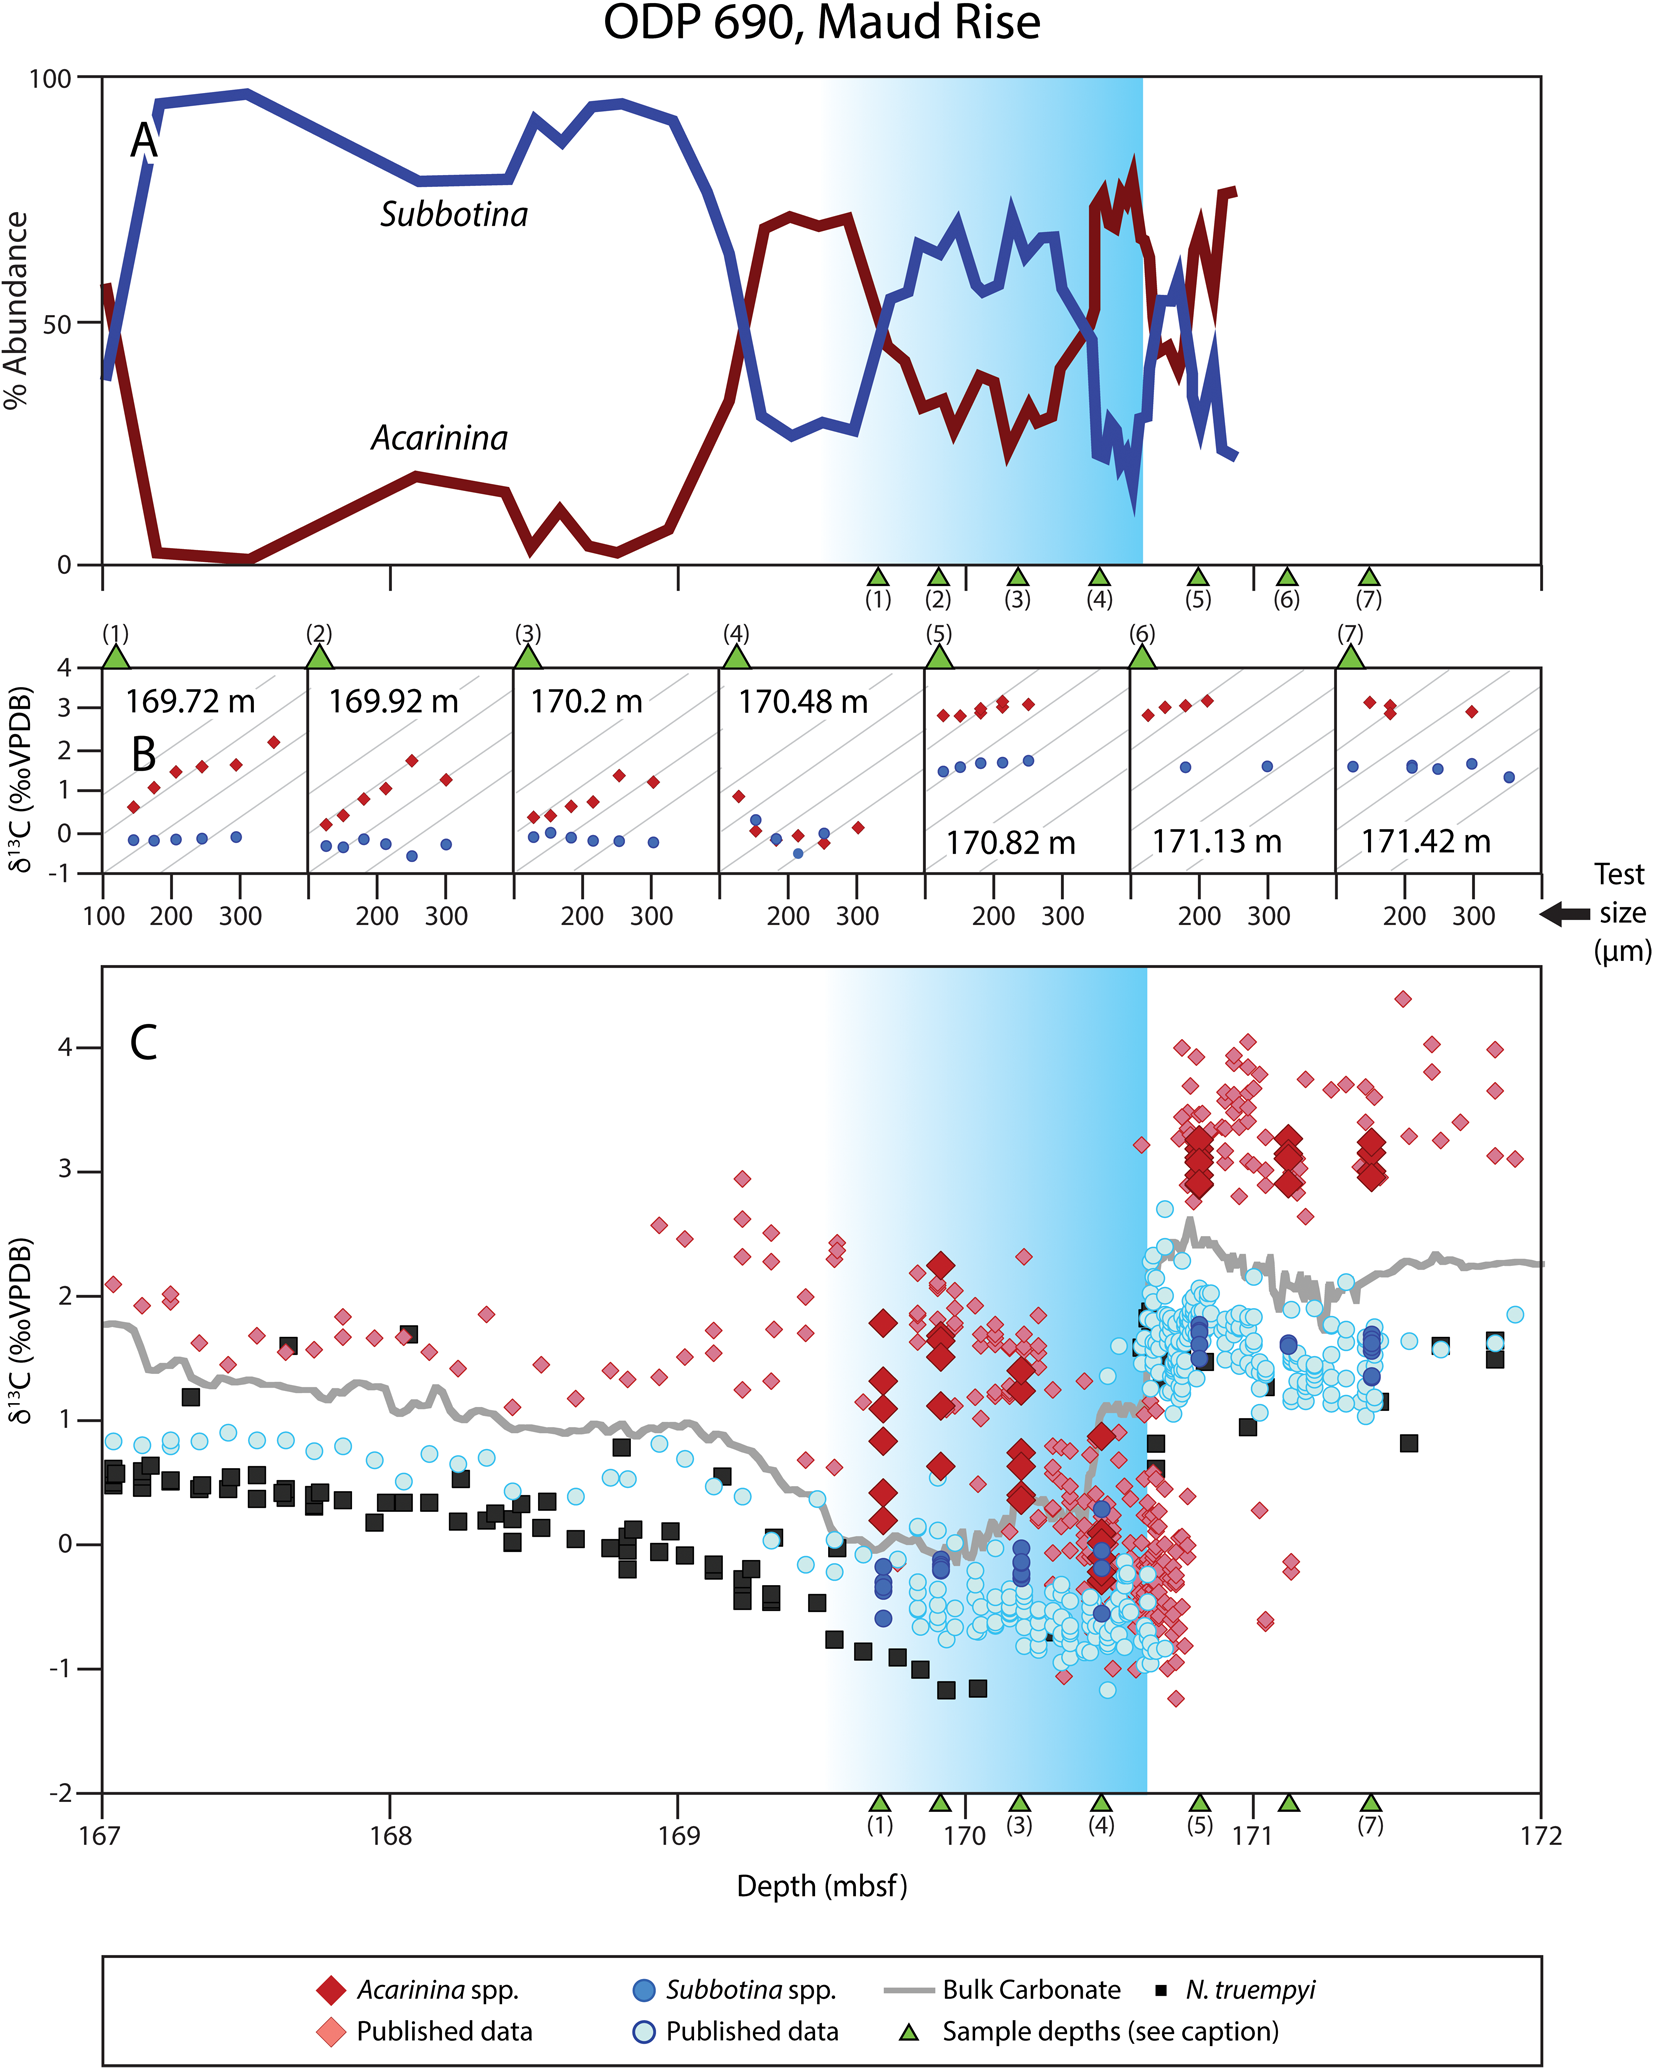
Figure 4. Abundance and isotopic data for foraminifera from ODP Site 690. Blue background shading indicates onset of the Paleocene–Eocene thermal maximum (PETM). A, Percent abundance of Acarinina and Subbotina (Kelly Reference Kelly2002). B, Time slice–specific size-δ13C of planktonic foraminifera, with sample placement indicated by green triangles in A and C, if within the plotted depth range. Gray inset lines indicate maximum size-δ13C slope (same across all panels). C, Published foraminiferal and bulk carbonate δ13C data (Kennett and Stott Reference Kennett and Stott1991; Thomas and Shackleton Reference Thomas and Shackleton1996; Bains et al. Reference Bains, Corfield and Norris1999; Thomas et al. Reference Thomas, Zachos, Bralower, Huber, MacLeod and Wing2000, Reference Thomas, Zachos, Bralower, Thomas and Bohaty2002; Cramer et al. Reference Cramer, Wright, Kent and Aubry2003; Kelly et al. Reference Kelly, Zachos, Bralower and Schellenberg2005, Reference Kelly, Nielsen and Schellenberg2012). rmcd, revised meters composite depth.
Isotopic analyses were performed at Yale University, the University of California, San Diego, and the University of California, Santa Cruz (see Supplementary Material). At Site 401, we generated genus-level assemblage counts by identifying ~360 individuals in splits of the >125 μm size fraction in 48 samples across Core 14 for comparison with published data for Sites 1209 (Petrizzo Reference Petrizzo2007) and 690 (Kelly Reference Kelly2002). Comparable counts are not available for Millville.
We assessed changes in photosymbiont status using terms agnostic to the potential driver of the signal. “Isotopic shallowing” describes a decrease in size-δ13C gradients consistent with reduced photosynthetic activity, perhaps to the point of total loss (bleaching). “Isotopic steepening” refers to increased size-δ13C gradients consistent with enhanced photosynthetic activity. We quantified size-δ13C relationships using linear regressions. For Sites 1209, 401, and 690, insignificant slopes were generally caused by a lack of size-δ13C trend (i.e., slopes approaching zero). For samples from Millville, isotopic data in each time bin were limited, and insignificant slopes were caused by slopes approaching zero and small sample sizes.
We examined changes in the difference in the δ13C and δ18O of individuals in the 150–212 μm sieve fractions (the smallest analyzed across all three sites) between planktonic and benthic foraminifera in order to consider shifts in the basal isotopes relative to deep-ocean values. These comparisons use a “Δδ” notation (e.g., Δδ13CAcarinina -Benthic). This allowed us to compare relative changes in photosymbiont-bearing and asymbiotic clades and to consider changes in depth habitat and ecology.
Results
We generated 394 size-specific planktonic foraminiferal isotopic measurements from Sites 1209 (Central Pacific), 401 (midlatitude North Atlantic), and 690 (Southern Ocean) (Supplementary Table 5; Supplementary Fig. 2); 16 benthic isotopic measurements from Site 1209 (Supplementary Table 6); and assemblage counts from 48 samples at Site 401. To distinguish between patterns inferred from individual samples and from aggregated samples, we use the terms “time slice” and “time bins,” respectively. The PETM has a characteristic carbon isotope stratigraphy that can be used to divide it into time bins for the comparison of changes across sites (Figs. 2–4, Supplementary Table 4). This includes a geologically abrupt negative carbon isotope excursion (CIE) of ~2‰–3‰ in carbonates at the start of the event, a sustained nadir lasting ~50 kyr (i.e., the body of the CIE), followed by ~150 kyr recovery to pre-event–like carbon isotope values. Here we use a “pre-PETM” time bin for all samples before the negative CIE of the PETM and a “core-PETM” time bin for samples in the body of the CIE. At ODP Site 690, where we have multiple samples in the body of the CIE, we discuss our three CIE samples in two time bins (earliest CIE sample = “base-PETM,” two later CIE samples = core-PETM; Supplementary Table 4), as they differed markedly in stable isotopic patterns and values (attributed to size-dependent mixing; Hull et al. Reference Hull, Franks and Norris2011; Kirtland Turner et al. Reference Kirtland Turner, Hull, Kump and Ridgwell2017; Hupp et al. Reference Hupp, Kelly, Zachos and Bralower2019; Hupp and Kelly Reference Hupp and Kelly2020). Here, acarininids and subbotinids have nearly identical δ13C values in the base-PETM sample, but distinct values in the core-PETM samples. We use the term “post-PETM” to indicate samples above the core CIE. At Site 1209, post-PETM includes samples from well above the δ13C-recovery interval (Fig. 2). At Site 401, post-PETM includes samples from both the δ13C-recovery and postrecovery intervals. At Site 690 post-PETM includes samples from the δ13C-recovery alone. In all sites, by the post-PETM interval, δ13C increases rapidly with size in photosymbiotic species.
Foraminifera–Symbiont Relations
Across all sites and most time slices, δ13C of Acarinina and Morozovella species increases with size (Figs. 2–4, Supplementary Tables 7–8), consistent with extant foraminifera externally hosting photosymbionts (D'Hondt et al. Reference D'Hondt, Zachos, Schultz and Summer1994; Gaskell and Hull Reference Gaskell and Hull2019) (Supplementary Figs. 2–7). In contrast, Subbotina only rarely shows a significant size-δ13C trend, consistent with an asymbiotic life history (D'Hondt et al. Reference D'Hondt, Zachos, Schultz and Summer1994). The size-δ13C relationships of Acarinina and Morozovella vary within sites among samples and among sites. On average, size-δ13C slopes of the photosymbiotic species are the steepest at midlatitude Atlantic Site 401 (Fig. 3) and shallowest at central Pacific Site 1209 (Fig. 2). At Southern Ocean Sites 690 and 689 (Si and Aubry Reference Si and Aubry2018), regression slopes were insignificant in the pre-PETM records for photosymbiotic species due to the near absence of size-δ13C enrichment.
Isotopic Responses to the PETM by Site
At Site 1209, size-δ13C gradients of Acarinina and Morozovella vary as much (or more) between time slices outside the PETM as between time slices within and outside the PETM (Fig. 2, Supplementary Figs. 8–9). Size-δ13C gradients were slightly reduced in the PETM relative to pre-event, and responses vary by photosymbiotic clades above the PETM. The isotopic values of planktonic foraminifera in the earliest core-PETM sample (218.01 revised meters composite depth [rmcd]) match pre-PETM values, likely due to the displacement of material up-section during prior core sampling. One of the authors (E.T.) took this sample and observed extensive core depletion and disruption. We assume that disruption and displacement explain the pre-PETM–like values (Fig. 2B) relative to findings in other studies for the same time interval (Fig. 2C), and we exclude this sample from further discussion. The second core-PETM sample (217.93 rmcd) is considered in place, as isotopic values for Acarinina match those of previous studies in the same size class (compare Fig. 2B and C) and the average δ13C values of subbotinids and morozovellids decline by >1‰ relative to pre-PETM δ13C values. In the core-PETM (Fig. 2B), acarininids are lower in δ13C than before the PETM onset, with values similar to subbotinids (Supplementary Fig. 10, Supplementary Table 9) and relatively flattened size-δ13C slopes. Moderate to poor preservation may account for some of the record (Fig. 2, Supplementary Fig. 4) including (1) inverted morozovellid and acarininid δ18O values relative to other sites, (2) low size-δ13C gradients, (3) modest differences in isotopic values among species, and (4) a minimum in the δ18O and δ13C difference between benthic and planktonic clades during the PETM (Supplementary Fig. 13). However, the consistency of preservation across samples suggests that it did not influence size-δ13C relationships over time (SEM images, Supplementary Fig. 1).
Before the PETM, morozovellids and acarininids had similar abundances at Site 1209, each comprising 30%–50% of the assemblage. Within the PETM, morozovellid abundance increased rapidly, with a peak abundance of >70% in the core PETM, due to an increase in the relative abundance of M. velascoensis (up to 40%), a decline in acaraninids, and an absence of subbotinids (Fig. 2).
At Site 401, positive size-δ13C relationships occur in Acarinina and Morozovella throughout all time slices (Fig. 3), but gradients decrease within the PETM. The size-δ13C slopes of both clades continue to decrease in the second core-PETM sample (Fig. 3, Supplementary Table 8). Gradients then increase through post-PETM time slices, eventually reaching pre-PETM values. The difference in δ18O between benthic foraminifera and planktonic clades varies over the record, with a minimum δ18O gradient within the PETM (Supplementary Fig. 10, Supplementary Table 9). The maximum difference in δ18O between benthic and planktonic clades occurs above the PETM. From pre- to post-PETM, Δδ13CBenthic increased ~0.5‰ in Acarinina, decreased by 0.5‰ in Subbotina, and changed little in Morozovella. Subbotinids make up 40%–70% of assemblages before the PETM at Site 401 but fall to ~30% within the core-PETM. Within the PETM, morozovellids increased distinctly in relative abundance (from ~10% to ~30%), coincident with the pronounced decrease in the relative abundance of subbotinids and acarininids (Fig. 3).
At Site 690, all pre-PETM time slices indicate insignificant size-δ13C slopes in Acarinina (Fig. 4). Two species of Acarinina (A. soldadoensis and A. coalingensis) and Subbotina (S. patagonica and S. triangularis) were analyzed but have minimal differences in isotopic signatures (Supplementary Fig. 11), so results are considered at the genus level. Morozovellids are extremely rare outside the core-CIE at Site 690 and are thus not considered (Kelly Reference Kelly2002). Acarinina had an insignificant size-δ13C relationship in the onset of the PETM (−0.326 ‰/100 μm; Fig. 4, depth 170.48 m), and δ13C values collapse onto those of Subbotina (Supplementary Fig. 10). Size-δ13C gradients of Acarinina increase markedly from the base- to the core-PETM and post-PETM, reaching slopes comparable to those at Site 401 (Fig. 4, Supplementary Table 7). The relative abundance of subbotinids fell by half at the CIE initiation, coincident with an increase in acarininids (i.e., the “acarininid spike”; Kelly Reference Kelly2002), with variation in the relative abundance of both clades thereafter. The base of the PETM coincides with an inversion in the ΔδPlanktonic-Benthic of δ13C, with δ18O inverting in the core-PETM interval (Supplementary Fig. 13).
Time slices at the Millville site are sparsely sampled, leading us to group samples over 20−180 cm (Supplementary Fig. 7; as in Si and Aubry Reference Si and Aubry2018). Below the PETM, δ13C values are comparable to Site 401 pre-PETM for all three clades (Supplementary Fig. 7), but values collapse by ~2‰ at the PETM, and do not fully recover over the studied record. The size-δ13C slope of Acarinina decreased from the pre-PETM (positive but insignificant regression coefficients) to the core-PETM (Supplementary Fig. 7), but the Paleocene time slice contains only four data points for Acarinina and three for Morozovella and is thus is hard to evaluate. The shallowest size-δ13C slopes for Acarinina and Morozovella occur in the youngest sample in the late recovery from the event (Supplementary Fig. 7). ΔδPlanktonic-Benthic cannot be readily compared with our data, as different benthic species were measured at Millville (Cibicidoides spp. in the pre-PETM, and Anomalinoides acuta in the PETM and post-PETM, as compared with Nuttallides truempyi) (Supplementary Fig. 10).
Discussion
We looked for evidence of changes in photosymbiont associations, including evidence of bleaching, in foraminifera across the most prominent hyperthermal of the Cenozoic (i.e., the PETM), using size-δ13C trends as a proxy for the presence and strength of photosymbiont associations. At midlatitude North Atlantic Site 401 and Central Pacific Site 1209, size-δ13C enrichment was reduced during the PETM (i.e., isotopic shallowing) for photosymbiont-bearing taxa, consistent with a reduction in photosymbiont activity (Figs. 2, 3), an effect that was more pronounced in acarininids than morozovellids. At Site 401, our planktonic foraminiferal isotope records are consistent with published δ13C values in the same size class across the event (Fig. 3C), but this is not the case for the core-PETM samples at Site 1209. We have one sample at Site 1209 (217.93 rmcd) capturing the core-PETM interval, but our carbon isotope values for Morozovella subbotinae are higher than published measurements of M. velascoensis (Fig. 2C). Both M. subbotinae and M. velascoensis yield similar δ13C values pre-PETM (~0.2‰–1‰; Fig. 2C), but during the core-PETM (217.93 rmcd), M. velascoensis has values of 1‰–1.2‰ and M. subbotinae has values of 2‰–3‰. These two species also respond differently to the event in terms of relative abundance: the abundance of M. velascoensis (the species with the greatest decrease in δ13C) increases dramatically in the core-CIE to account for nearly 40% of all individuals sampled, while M. subbotinae maintained similar relative abundances (or even declined slightly) (Petrizzo Reference Petrizzo2007). All isotopic data for Acarinina at Site 1209 are from a single species, A. soldadoensis, and our isotopic values for Acarinina are consistent with published acarininid data (Fig. 2).
Isotopic shallowing with the onset of the PETM is not consistent across sites. The Southern Ocean record at Site 690 displays insignificant but weakly positive size-δ13C slopes in acarininids in the pre-PETM interval (Fig. 4). Similarly weak isotopic enrichments are recorded in pre-PETM A. subsphaerica at Site 690 (Hupp et al. Reference Hupp, Kelly, Zachos and Bralower2019; Hupp and Kelly Reference Hupp and Kelly2020) and in pre-PETM acarininids from ODP Site 689 (Si and Aubry Reference Si and Aubry2018). Across all Southern Ocean studies, Acarinina shows no significant size-δ13C relationship in the middle of the core-PETM, during which Acarinina δ13C values collapse onto those of co-occurring Subbotina. Both trends are captured by the record of Hupp et al. (Reference Hupp, Kelly, Zachos and Bralower2019) and Hupp and Kelly (Reference Hupp and Kelly2020), which have greater temporal resolution around the onset of the PETM. The shape of the acarininid collapse (occurring in the largest size fraction first and resulting in a strongly negative size-δ13C relationship during the collapse) emphasizes the importance of sediment mixing and population abundance in structuring the perception of biological change (Kirtland Turner et al. Reference Kirtland Turner, Hull, Kump and Ridgwell2017; Hupp and Kelly Reference Hupp and Kelly2020). Hupp et al. (Reference Hupp, Kelly, Zachos and Bralower2019) and Hupp and Kelly (Reference Hupp and Kelly2020) argue that changes in the observed size-δ13C relationships at Site 690 result from mixing different size classes of pre-PETM and core-PETM samples to a different degree (i.e., small size fractions mix further than large size fractions; Bard Reference Bard2001); an effect potentially exacerbated by combining differential abundance changes of individuals by species and size (Thomas Reference Thomas2003; Kirtland Turner et al. Reference Kirtland Turner, Hull, Kump and Ridgwell2017). We agree that there is pervasive evidence for an onset interval with strong sediment mixing at Sites 689 and 690 (Kelly et al. Reference Kelly, Nielsen and Schellenberg2012; Kirtland Turner et al. Reference Kirtland Turner, Hull, Kump and Ridgwell2017; Hupp et al. Reference Hupp, Kelly, Zachos and Bralower2019). Although we initially thought it likely that the collapsed offset between Acarinina and Subbotina was robust to the effects of mixing, given the modeled relative abundance changes of the two clades and isotopic composition (Kirtland Turner et al. Reference Kirtland Turner, Hull, Kump and Ridgwell2017: fig. 5) by 170.48 m below seafloor (our lowermost Site 690 core-PETM sample; Fig. 4), recent work by Hupp and Kelly (Reference Hupp and Kelly2020) showed evidence for mixing-related biases more than 20 cm above the CIE onset, as could also have been argued from the records in Thomas et al. (Reference Thomas, Zachos, Bralower, Thomas and Bohaty2002).
In Sites 689 and 690, strongly positive size-δ13C relationships in Acarinina only develop in the later part of the core-PETM. These results are consistent with weak to no photosymbiont fractionation in acarininids before the PETM and during the initial onset of the event, followed by stronger photosymbiont-mediated fractionation during the initial recovery from the PETM. Strong size-δ13C enrichment in modern foraminifera with externally hosted symbionts result from increasing photosymbiont density, with test size increasing the geochemical modification of the individual's microenvironment (Spero et al. Reference Spero, Lerche and Williams1991; Zeebe et al. Reference Zeebe, Bijma and a Wolf-Gladrow1999; Gaskell and Hull Reference Gaskell and Hull2019). Hence, it is plausible that symbiont ecology changed in the aftermath of the PETM. In the pre-PETM interval, acarininids (a clade typically hosting photosymbionts) may not have increased their photosymbiont population sufficiently to drive an increasing microenvironment effect, whereas in the later parts of the core-PETM they may have done so. All open-ocean sites considered in this study show isotopic steepening in photosymbiotic taxa in the later stages of the PETM relative to the core-PETM, with Acarinina gaining significant size-δ13C enrichment for the first time in the Southern Ocean in the post-PETM interval (Fig. 4). In addition, the Southern Ocean collapse in δ13C at the onset of the PETM could reflect a change in relative depth habitat, as argued by Si and Aubry (Reference Si and Aubry2018), as the δ18O gradient collapsed simultaneously (as in Millville) (Supplementary Fig. 10). A minimum in the difference in δ18O between benthic foraminifera and planktonic clades during the CIE is observed at Site 401 and could also have been driven by a change in depth habitat (Supplementary Fig. 10, Supplementary Table 9). However, collapsed offsets are also expected due to differential mixing by species, abundance change, and size class (Kirtland Turner et al. Reference Kirtland Turner, Hull, Kump and Ridgwell2017; Hupp et al. Reference Hupp, Kelly, Zachos and Bralower2019; Hupp and Kelly Reference Hupp and Kelly2020), and these may simply reflect the effect of well-documented mixing artifacts.
The shelf record from Millville (Si and Aubry Reference Si and Aubry2018) displays no clear evidence for isotopic shallowing in morozovellids or acarininids during the PETM, consistent with the inference that coastal foraminifera did not experience the loss of photosymbiont-mediated fractionation, compared with open-ocean sites. Alternatively, the absence of a clear signal may reflect the high variance in the data and the need to group samples to achieve interpretable records.
Evidence for isotopic shallowing and steepening raises the question whether changes are driven by photosymbiont loss and gain, respectively. In extant corals, “bleaching” refers to total photosymbiont loss, but many factors, biological and environmental, could drive changes in size-δ13C gradients in planktonic foraminifera, without total photosymbiont loss. Isotopic shallowing could be driven by (1) partial or complete loss of symbionts, (2) reduction in photosymbiont density, (3) reduction in photosymbiont metabolism (e.g., due to changes in irradiance or temperature), or (4) a switch to a different clade of symbionts. Corals (Santavy et al. Reference Santavy, Summers, Engle and Harwell2005) and benthic foraminifera (Schmidt et al. Reference Schmidt, Morard, Romero and Kucera2018) show such changes and can experience partial bleaching (“paling”) rather than total photosymbiont loss.
The weak and variable evidence for size-δ13C gradients at high-latitude Sites 689 (Si and Aubry Reference Si and Aubry2018; Supplementary Fig. 12) and 690 (Fig. 4) before the PETM suggests that Acarinina varied its relationships with photosymbionts in response to local conditions. Such variation in host–photosymbiont relationships and their isotopic expression is known in extant planktonic foraminifera, which vary in the density (Bird et al. Reference Bird, Darling, Russell, Davis, Fehrenbacher, Free, Wyman and Ngwenya2017; Takagi et al. Reference Takagi, Kimoto, Fujiki and Moriya2018, Reference Takagi, Kimoto, Fujiki, Saito, Schmidt, Kucera and Moriya2019) and type of photosymbionts (Schiebel and Hemleben Reference Schiebel and Hemleben2017; Takagi et al. Reference Takagi, Kimoto, Fujiki, Saito, Schmidt, Kucera and Moriya2019), location where symbionts are hosted (i.e., intra- vs. extracellularly) (Spero Reference Spero1998; Bird et al. Reference Bird, Darling, Russell, Davis, Fehrenbacher, Free, Wyman and Ngwenya2017; Schiebel and Hemleben Reference Schiebel and Hemleben2017), and degree to which photosymbiosis is reflected in size-δ13C enrichment (Ezard et al. Reference Ezard, Edgar and Hull2015; Edgar et al. Reference Edgar, Hull and Ezard2017).
Differences in the persistence and magnitude of δ13C change between morozovellids and acarininids, and between two different species of morozovellids at Site 1209, indicate species-specific differences in photosymbiont associations. Complete loss of size-δ13C enrichment occurs within Acarinina soldadoensis in a single time slice only (Fig. 2B, 217.93 rmcd), although post-PETM samples have reduced size-δ13C gradients throughout the length of our record. We see a similar absence of size-δ13C relationship at the onset of the PETM in Site 690 (Fig. 4). In both cases, the lack of a size-δ13C gradient in the base-/core-PETM is consistent with a different foraminifera–photosymbiont relationship than is typical of acarininids, such as the loss of symbionts or reconfiguration of the relationship. This may have involved photosymbiont clades with small fractionation effects in δ13C or moving symbionts internally to the test where they have smaller microenvironmental (and thus isotopic) effects. In midlatitude Site 401 (Fig. 3B), acarininids show distinct isotopic shallowing during the PETM, consistent with a changed foraminifera–photosymbiont association, but morozovellids do not, at least in small- to medium-sized individuals. It is common for the largest individuals of photosymbiont-bearing species to show weaker size-δ13C fractionation effects than smaller individuals, which is attributed to ontogenetic effects such as gametogenic calcification, which could account for differences among size fractions. Hupp et al. (Reference Hupp, Kelly, Zachos and Bralower2019) and Hupp and Kelly (Reference Hupp and Kelly2020) proposed a similar pattern during the onset of the PETM at Site 690 to be a preservational artifact of differential mixing depths and abundance changes across size fractions, an explanation that works equally well to explain the disconnect in isotopic changes across size fractions at Site 401, but not the differential response of acarininids and morozovellids to the PETM.
Although environmental and preservational changes are important drivers of isotopic variation in fossil foraminifera, they are not likely to be the primary cause of the major patterns we observe. Preservation can dramatically alter the isotopic signals preserved (Pearson et al. Reference Pearson, Ditchfield, Singano, Harcourt-Brown, Nicholas, Olsson, Shackleton and Hall2001), but the sites with the best (Site 401) and worst (Site 1209) preservation have the most similar patterns of isotopic change across the PETM (Figs. 2,3, Supplementary Material). Environmental differences offer an alternative explanation for variable isotopic patterns among sites, including factors such as the availability of photosynthetically active radiation, temperature, carbonate ion effects, and the extent of water-column stratification (Spero et al. Reference Spero, Bijma, Lea and Bemis1997; Lombard et al. Reference Lombard, da Rocha, Bijma and Gattuso2009; Henehan et al. Reference Henehan, Foster, Bostock, Greenop, Marshall and Wilson2016). This class of explanations is less parsimonious than those invoking changed photosymbiont associations, because variable combinations of environmental changes need to be evoked at each site (Supplementary Table 2). For instance, at Site 401 the two photosymbiont-bearing clades show different PETM responses, whereas at Site 1209 these clades show identical responses. To account for this via the environment, a variable combination of temperature, depth, and stratification changes are needed to explain divergent isotopic patterns in co-occurring photosymbiotic clades. Similarly, the combined effects of sediment mixing and relative abundance changes (as in Hupp et al. Reference Hupp, Kelly, Zachos and Bralower2019; Hupp and Kelly Reference Hupp and Kelly2020) do not provide a straightforward explanation, as there are divergent relative abundance pattern changes across acarininids and morozovellids at Sites 401 and 1209, and these factors require follow-up mixing studies to fully address.
At present, we favor the relatively parsimonious explanation of variation in the strength (or location) of photosymbiont associations as the most probable mechanism responsible for observed isotopic shallowing and steepening across the PETM. The lack of size-δ13C relationships during the PETM in some species and sites likely does not indicate symbiont bleaching. Rather, we hypothesize that the importance of photosymbiont associations to the metabolic functions of individual foraminifera can vary in response to conditions experienced during a life span, resulting in variation in the isotopic expression of photosymbiosis. Our approach obviates the need to explain how and why bleaching would occur for tens to hundreds of thousands of generations in response to relatively minor temperature changes. Photosymbiotic associations in some shallow-water living benthic foraminifera are variable and have high thermal tolerances (Schmidt et al. Reference Schmidt, Titelboim, Brandt, Herut, Abramovich, Almogi-Labin and Kucera2016, Reference Schmidt, Morard, Romero and Kucera2018), and microevolutionary responses such as the adoption of more thermally resistant photosymbionts or sustained photoinhibition (Rowan Reference Rowan2004) could occur over the kiloyear-long onset of the PETM (Dunkley Jones et al. Reference Dunkley Jones, Lunt, Schmidt, Ridgwell, Sluijs, Valdes and Maslin2013; Kirtland Turner et al. Reference Kirtland Turner, Hull, Kump and Ridgwell2017), making complete bleaching a less likely explanation.
Given evidence presented here for widespread changes in photosymbiont associations, it is remarkable that populations of photosymbiont-bearing clades apparently thrived relative to asymbiotic clades during the PETM. At low latitudes, Morozovella peaked in relative abundance during the PETM, and in high latitudes, Acarinina also increased in abundance (Figs. 2–4), possibly responding to increasingly oligotrophic conditions in the water column (Bralower Reference Bralower2002). Remarkably, we find that the morozovellid species with the greatest δ13C reductions (M. velascoensis) at Site 1209 does extremely well, from a population abundance perspective, during the PETM (Fig. 2), increasing in relative abundance to ~40% of the total population (Petrizzo Reference Petrizzo2007). On the other hand, acarininids, which saw the complete elimination of size-δ13C fractionation, fell in abundance from ~40% before the PETM to ~30% during the PETM. Further evidence for adaptive responses comes from the collapse in δ18O offsets between surface and mixed-layer taxa at Millville and in the Southern Ocean, attributed to changes in depth habitat or seasonality (Stap et al. Reference Stap, Lourens, Van Dijk, Schouten and Thomas2010; Si and Aubry Reference Si and Aubry2018). The combined isotopic and abundance data present a compelling case for the relative resilience of photosymbiont-bearing planktonic foraminiferal clades to PETM environmental changes as compared with asymbiotic clades.
Possibly, the rate of climate change during the PETM (roughly an order of magnitude slower than today; Kirtland Turner Reference Kirtland Turner2018), enabled flexible planktonic foraminifera–photosymbiont associations, allowing populations of some species to thrive. In other words, photosymbiont bearers might not be particularly vulnerable to all global change events, but just to those that cause complete loss of symbionts on very short timescales (a few generations), as observed today. However, if PETM warming included extreme, short-term climatic events superimposed on longer-term warming trends, with rates of change more analogous to today, our results might simply indicate that photosymbiotic planktonic foraminifera are more resilient than the better-studied symbiotic corals and larger benthic foraminifera today (Hughes et al. Reference Hughes, Kerry, Baird, Connolly, Dietzel, Eakin, Heron, Hoey, Hoogenboom, Liu, McWilliam, Pears, Pratchett, Skirving, Stella and Torda2018; Prazeres Reference Prazeres2018; Spezzaferri et al. Reference Spezzaferri, El Kateb, Pisapia and Hallock2018). Alternatively, ancient photosymbiotic associations in much warmer climate states may have been more resilient to warming than those observed in the much cooler oceans of the late Cenozoic (Stanley and van de Schootbrugge Reference Stanley, van de Schootbrugge, van Oppen and Lough2018).
Regardless of the ultimate driver, planktonic foraminiferal isotopic changes across the PETM demonstrate the importance of establishing site-specific baselines for environmental interpretations of geochemistry across the PETM. Depth habitat and photosymbiont activity, both of which changed during the PETM, influence the isotope composition of foraminiferal tests, perhaps accounting for some variation in CIE magnitude estimates (i.e., 2‰ and 7‰; Kennett and Stott Reference Kennett and Stott1991; Sluijs and Dickens Reference Sluijs and Dickens2012). In addition, the spatial and depth distribution of CIEs, and their relative magnitude, have been used to constrain the source and timing of PETM carbon emissions (Kirtland Turner Reference Kirtland Turner2018). A spatially variable response of photosymbiosis complicates inferences, because it decouples changes in δ13Ccalcite from changes in δ13CDIC, with the magnitude and pattern of changes in δ13CDIC needed to make inferences regarding carbon release. Changes in photosymbiosis and depth habitat across the PETM would also affect the magnitude of boron isotope change measured, an important proxy of ocean pH and atmospheric pCO2 (Penman et al. Reference Penman, Hönisch, Zeebe, Thomas and Zachos2014; Gutjahr et al. Reference Gutjahr, Ridgwell, Sexton, Anagnostou, Pearson, Pälike, Norris, Thomas and Foster2017).
Conclusions
Changes in physiology, ecology, and photosymbiont status can profoundly alter geochemical records. Photosymbiont-bearing foraminifera provide key records of atmospheric CO2 and surface ocean temperatures, and their ecologies are central to making accurate environmental reconstructions via geochemical analyses. Isotopic shallowing during the PETM thus may obscure the environmental signal of the event and, when unaccounted for, will result in erroneous environmental reconstructions from δ13C- and δ11B-based proxies.
Ancient global environmental perturbations provide case studies in biotic response over long ecological and evolutionary timescales. Today, warming-induced bleaching elevates mortality rates of some photosymbiont-bearing taxa, contributing to the collapse of populations in critical groups, including corals. Whether photosymbiont-bearing species can adapt via microevolutionary responses in the long term is a major question that is difficult to answer on the timescales of modern ecological studies. Our results from the fossil record provide important constraints and suggest that the adaptative capacity of photosymbiotic species may be so great as to allow some populations to expand, and excursion species to evolve, during relatively protracted climate change relative to the generation time of the species (i.e., warming over kiloyears). Historical archives should be considered alongside modern ecological studies (e.g., Hughes et al. Reference Hughes, Kerry, Baird, Connolly, Dietzel, Eakin, Heron, Hoey, Hoogenboom, Liu, McWilliam, Pears, Pratchett, Skirving, Stella and Torda2018; Prazeres Reference Prazeres2018; Spezzaferri et al. Reference Spezzaferri, El Kateb, Pisapia and Hallock2018) to consider how multigenerational evolutionary responses can mitigate the physiological stress of environmental perturbations.
We show evidence of spatially variable, changing photosymbiont associations in planktonic foraminifera in response to the PETM, rather than homogenous bleaching-like signals, which suggests site- and time-specific investigations are needed before isotopic records can be interpreted confidently with regard to environmental conditions and the biasing effects of sediment mixing and variable diagenesis (Fig. 5). Our results are consistent with the spatially variable impacts of the PETM. Modern coral bleaching is not globally uniform due to local environmental conditions, clade-specific symbiont associations, and clade-specific adaptations. We should expect—as we, in fact, observe—similar variability in foraminifera–photosymbiont associations in the past.

Figure 5. Schematic summarizing major results of this study. A, Change in relative abundance of planktonic clades as compared with pre-PETM (Paleocene–Eocene thermal maximum) values (indicated by black dashed line). Asymbiotic clades respond similarly across the PETM, decreasing in abundance during the peak of the event, whereas symbiotic clades show site- and clade-specific variation in response. B, Range of size-δ13C slopes of symbiotic clades (raw slope coefficients shown in Supplementary Fig. S8) with dashed line indicating slope coefficients of 0. Symbiotic clades show a wide range of size-δ13C slopes before, during, and after the PETM. C, Idealized δ13C curve.
As to understanding the physiological and ecological response of taxa to global warming, we show that populations of photosymbiotic species were resilient to relatively gradual global warming during the PETM. Photosymbiont-bearing planktonic foraminifera were relatively more abundant than asymbiotic clades after the onset of the PETM at most sites. Symbiotic associations changed at the same time that these clades became relatively more abundant. Loss or reduction in δ13C enrichment across the PETM is more likely driven by changes in the nature of photosymbiotic associations (i.e., changes in photosymbiont load, activity, effect, location or type) than modern-type bleaching, given the long timescales involved (spanning many generations of populations), spatial heterogeneity in signal before the event, and heterogeneity in response to the event. Such flexibility in photosymbiont associations may contribute to the relative success of photosymbiont-bearing taxa during the PETM and provide a note of hope for our current biodiversity crisis in attesting the resilience of some photosymbiont-bearing species.
Acknowledgments
We thank B. Erkkila and M. Wint of the Yale Analytical and Stable Isotope Center, C. Charles at the UCSD Stable Isotope Laboratory, and D. Andreasen at the UCSC Stable Isotope Laboratory for help with isotopic analyses; G. Dickens and four anonymous reviewers for insightful comments which improved our article; and the International Ocean Discovery Program for samples from Sites ODP 1209, ODP 690, and DSDP 401. E.T. recognizes funding by National Science Foundation (NSF) OCE 1536611. P.M.H., S.D., and J.O.S recognize funding by NSF OCE 1536604 and a Sloan Research Fellowship. Work on isotopic records at DSDP 401 and ODP 690 was part of J.A.L.'s M.S. thesis under R.D.N. The authors declare no competing interests.
Data Availability Statement
Supplementary materials, isotopic data, and assemblage data available at https://doi.pangaea.de/10.1594/PANGAEA.918702.


