Introduction
Across our planet, biogeographic patterns of species diversity and community composition reflect organismal responses to local environmental conditions, both through within-species variation and among-species replacement. The list of physical and chemical variables proposed to structure benthic marine biogeographic patterns is extensive, including: substrate, oxygen level, food availability, water depth, light intensity, and temperature. Because the geographic ranges of most organisms are constrained by their physiological tolerances (Bozinovic et al. Reference Bozinovic, Calosi and Spicer2011), life-history traits such as growth, longevity, and optimal size also vary systematically across environmental gradients (e.g., Pianka Reference Pianka1970; Picken Reference Picken1979; Hunt and Roy Reference Hunt and Roy2006; Rex et al. Reference Rex, Etter, Morris, Crouse, McClain, Johnson, Stuart, Deming, Thies and Avery2006; Hunt et al. Reference Hunt, Wicaksono, Brown and MacLeod2010; Moss et al. Reference Moss, Ivany, Judd, Cummings, Bearden, Kim, Artruc and Driscoll2016). Metabolism requires the interaction between organism and environment, thereby providing a potentially unifying framework for interpreting many aspects of marine biogeographic variation. Metabolic rate scales with organism size and shape in ways that are predictable and deeply conserved across the tree of life (Brown Reference Brown1995; Brown et al. Reference Brown, Gillooly, Allen, Savage and West2004; DeLong et al. Reference DeLong, Okie, Moses, Sibly and Brown2010); thus, spatial relationships between organism and environment in the modern world are likely also to have applied across geologic time.
In the marine realm, benthic foraminifera are an ideal study group for quantifying responses of ontogenetic trajectories to environmental gradients. Because foraminifera are single-celled organisms, their morphological responses to the local environment can be predicted based on first principles of cell physiology more easily than those of complex, multicellular organisms such as plants and animals. Both cell size and local temperature determine the metabolic demand of the organism (Gillooly et al. Reference Gillooly, Brown, West, Savage and Charnov2001), which in turn dictates the amount of organic carbon required to sustain its metabolic demand and the amount of oxygen required to respire this food. Cell surface area controls the rate of oxygen uptake; thus, the foraminifer should modify its shape (i.e., volume-to-surface area ratio) to maximize uptake efficiency or, at least, to meet internal demands. In general, the morphology of the foraminiferal test reflects the morphology of the cell (Hohenegger and Briguglio Reference Hohenegger and Briguglio2014), and calcareous multilocular foraminifera grow by adding newly secreted chambers to the test, thereby recording ontogenetic history. Thus, the morphology of the foraminiferal test and its proloculus chamber (i.e., the skeletal remains of the embryonic cell; Cushman Reference Cushman1905) can be coupled with oceanographic data to reconstruct patterns of growth as they relate to local environmental conditions.
Among-species trends of adult benthic foraminiferal size and shape are constrained by the physicochemical controls of temperature and dissolved oxygen in the local environment (Keating-Bitonti and Payne Reference Keating-Bitonti and Payne2016), but it remains unknown whether differences in life-history traits of foraminifera, such as longevity and growth history, are similarly influenced by environmental controls on metabolism. For example, in the coldest extents of their geographic ranges, marine invertebrate animals tend to have suppressed growth rates (Vance Reference Vance1973a, Reference Vanceb; Clarke Reference Clarke1979; Picken Reference Picken1979; Gillooly et al. Reference Gillooly, Charnov, West, Savage and Brown2002; Schöne et al. Reference Schöne, Tanabe, Dettman and Sato2003; Moss et al. Reference Moss, Ivany, Judd, Cummings, Bearden, Kim, Artruc and Driscoll2016), increased longevity (Vance Reference Vance1973a, Reference Vanceb; Buick and Ivany Reference Buick and Ivany2004; Moss et al. Reference Moss, Ivany, Judd, Cummings, Bearden, Kim, Artruc and Driscoll2016), delayed maturation (Vance Reference Vance1973a, Reference Vanceb; Gillooly et al. Reference Gillooly, Charnov, West, Savage and Brown2002), and large adult size (Hunt and Roy Reference Hunt and Roy2006; Hunt et al. Reference Hunt, Wicaksono, Brown and MacLeod2010). To illustrate these examples: high-latitude bivalves are large, even though they grow more slowly than their low-latitude counterparts, because those living in colder waters have longer life spans due to suppressed metabolic rates (Moss et al. Reference Moss, Ivany, Judd, Cummings, Bearden, Kim, Artruc and Driscoll2016). Examples of environmental controls on adult/offspring size ratios are limited, but high seasonality has been proposed as one possible explanation for reduced adult/offspring size ratios (e.g., Neuheimer et al. Reference Neuheimer, Hartvig, Heuschele, Hylander, Kiørboe, Olsson, Sainmont and Andersen2015). Neuheimer et al. (Reference Neuheimer, Hartvig, Heuschele, Hylander, Kiørboe, Olsson, Sainmont and Andersen2015) hypothesize that it is advantageous to produce large offspring that can reach maturity within a short reproductive season, resulting in a low adult/offspring size ratio that reflects little total growth over the individual’s life span. Here, we study the associations between among-species rotaliid adult/offspring size ratios and physicochemical oceanographic variables across the North American continental margin. These biogeographic patterns across broad environmental gradients will lay the groundwork for better understanding the patterns of growth and longevity in ecologically diverse modern benthic foraminifera with the goal of inferring from the fossil record the role of the environment in shaping their evolutionary life histories and metabolic strategies.
Metabolic Theory
The size of an organism reflects the interplay between the organism’s energetic demand (i.e., metabolic rate) and the resources available to it locally. For example, large organisms have greater overall metabolic demands than smaller ones. The sizes and shapes of benthic foraminifera reflect changes in local temperature and dissolved oxygen, consistent with predictions from first principles of cell physiology (Keating-Bitonti and Payne Reference Keating-Bitonti and Payne2016). Organism metabolic rate (B) is dictated by both organism mass (M), which determines the organism’s metabolic demand, and ambient temperature (T), which determines the rates of metabolic reactions (Gillooly et al. Reference Gillooly, Brown, West, Savage and Charnov2001). Thus, the effects of mass and temperature on overall metabolic rate can be modeled as:
 $$B{\,\equals\,}b_{0} \,M\,\exp \,\left( {{{{\minus}E_{i} } \over {kT}}} \right)$$
where mass-specific metabolic rate (b
0) is 3.4×10¹⁰ W/kg (see Keating-Bitonti and Payne Reference Keating-Bitonti and Payne2016), and
 $e^{{{{{\minus}E_{i} } \over {kT}}}} $
is the Boltzmann factor (Gillooly et al. Reference Gillooly, Brown, West, Savage and Charnov2001). The Boltzmann factor describes how the rates of chemical reactions vary with temperature, such that rising temperatures increase metabolic rate. E
i
is the activation energy constant (−9.9×10⁻²⁰ J), and k is the Boltzmann constant (1.4×10⁻²³ J/K). We modified equation (1) from Gillooly et al. (Reference Gillooly, Brown, West, Savage and Charnov2001) to reflect the observation that B in unicellular protists scales linearly with cellular biomass (DeLong et al. Reference DeLong, Okie, Moses, Sibly and Brown2010), distinct from the sublinear scaling characteristic of metazoans.
$e^{{{{{\minus}E_{i} } \over {kT}}}} $
is the Boltzmann factor (Gillooly et al. Reference Gillooly, Brown, West, Savage and Charnov2001). The Boltzmann factor describes how the rates of chemical reactions vary with temperature, such that rising temperatures increase metabolic rate. E
i
is the activation energy constant (−9.9×10⁻²⁰ J), and k is the Boltzmann constant (1.4×10⁻²³ J/K). We modified equation (1) from Gillooly et al. (Reference Gillooly, Brown, West, Savage and Charnov2001) to reflect the observation that B in unicellular protists scales linearly with cellular biomass (DeLong et al. Reference DeLong, Okie, Moses, Sibly and Brown2010), distinct from the sublinear scaling characteristic of metazoans.
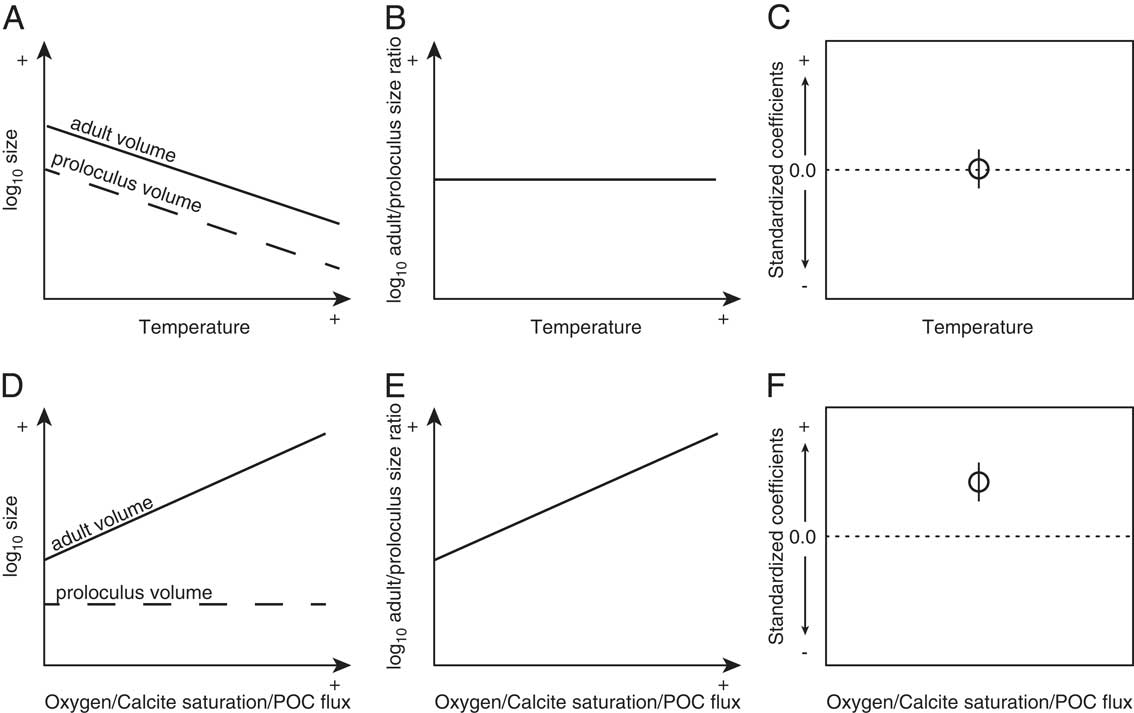
Foraminiferal cytoplasm is not preserved in the fossil record, thereby requiring additional modifications to be made to equation (1). To apply equation (1) to the fossil record, we used test morphology, because the foraminiferal test approximates the morphology of the cell (Hohenegger and Briguglio Reference Hohenegger and Briguglio2014). To accomplish this, we substituted M for the product of test volume (V) and the density of cell cytoplasm (ρ=1 g/cm3; Korsun et al. Reference Korsun, Hald, Panteleeva and Tarasov1998). We used the equation of a generalized three-dimensional ellipsoid to approximate V. From equation (1) we expect the potential maximum test volumes of rotaliid foraminifera to increase with cooling temperatures (Fig. 1A).

Figure 1 Hypothesized relationships between local temperature and both log adult (solid) and proloculus (dashed) volumes (A), the adult/proloculus size ratio (B), and the resulting standard coefficient of log adult/proloculus size ratio (C). Hypothesized relationships between local oxygen, calcite saturation, and POC flux and both log adult and proloculus volumes (D), the adult/proloculus size ratio (E), and the resulting standard coefficient of log adult/proloculus size ratio (F). The predicted direction of association (standardized coefficient of the L1-regularized regression) between the four hypothesized environmental variables and log adult/proloculus size ratios shown in C and F are based on first principles of cell physiology.
Oxygen is required by aerobic eukaryotes for respiration, and the surface area (SA) of the foraminiferal cell controls the rate of oxygen uptake from the local environment. The dominant mechanism for oxygen transport throughout the cell is cytoplasmic streaming (u ~ 5×10⁻³ mm/s; Travis and Bowser, Reference Travis and Bowser1991), and the uptake and transport of oxygen by the protist can be described as SA · u · [O2] (Payne et al. Reference Payne, Groves, Jost, Nguyen, Moffitt, Hill and Skotheim2012). The effects of local temperature and dissolved oxygen on test volume-to-surface area ratio (V/SA), assuming all other variables are constants, can be expressed as:
 $${\ro \max}\,\left( {V\,/\,SA} \right){\,\equals\,}{{u\left[ {\rm O_{2} } \right]} \over {3b_{0} \,\exp \,\left( {{{{\minus}E_{i} } \over {kT}}} \right)q{\rrho} }}$$
Equation (2) assumes aerobic respiration by the protist and the energy yield from burning 1 mole of glucose via aerobic respiration (q) is ~2.9×10⁻⁶ mol/W · s. From equation (2), we expect dissolved oxygen concentrations to have a positive linear relationship not only with V/SA, but also with V (Fig. 1D). Here, we study the environmental influence on the distribution of among-species proloculus V and the ratio of adult-to-proloculus V (hereafter “adult/proloculus size ratio”) by comparing measured sizes of foraminifera across environmental gradients and compare observed responses to predictions from physiological principles.
Materials and Methods
Study Design
The physical environment influences both the initial size of an organism and its final achieved size as well as the rates of growth that link these bookended life stages (Gillooly et al. Reference Gillooly, Charnov, West, Savage and Brown2002). Metabolic rate varies throughout ontogeny, reflecting the allocation of metabolic energy to individual growth and reproduction. To quantify how the physical and chemical environments structure the biogeographic distribution of benthic foraminiferal growth patterns and size, we analyzed among-species data on the proportional change from the proloculus to adult test size (i.e., adult/proloculus size ratio) from a range of environments across the North American continental shelf and slope. We measured the proloculi and adult tests of 129 holotype specimens of extant benthic foraminiferal species and assigned the size information of the holotypes to all species’ occurrences from 718 unique North American localities. In addition to the physiological constraints imposed by temperature and dissolved oxygen on foraminiferal size, seawater calcite saturation and food availability are also frequently hypothesized to influence the metabolism and growth of calcareous benthic organisms. Thus, we examined the influences of temperature, dissolved oxygen, calcite saturation, and food availability on among-species biogeographic patterns of the adult/proloculus size ratio (Fig. 1B,D).
Localities and Species Data
The data set presented herein includes a subset of the species and localities from Keating-Bitonti and Payne (Reference Keating-Bitonti and Payne2016), but builds on those data by adding proloculus volumes. In total, our data set contains 2486 species occurrences from the North American continental margin. These occurrences span more than 70° of latitude and water depths from less than 5 m to 1584 m (Fig. 2). We used the occurrences of recent North American benthic foraminifera that were compiled from the primary literature by Culver and Buzas (Reference Culver and Buzas1980, Reference Culver and Buzas1981, Reference Culver and Buzas1982, Reference Culver and Buzas1985, Reference Culver and Buzas1986, Reference Culver and Buzas1987; S. J. Culver and M. A. Buzas personal communication) and subsequently converted to a digital database by Keating-Bitonti and Payne (Reference Keating-Bitonti and Payne2016). We restricted this study to the taxonomic suborder Rotaliida, because it is highly speciose and geographically widespread (Loeblich and Tappan Reference Loeblich and Tappan1988). Occurrence data span both the Atlantic and Pacific continental margins of North America and include the Caribbean and Arctic seas as well as the Gulf of Mexico (Fig. 2). To obtain the water depth, we overlaid the latitude and longitude coordinates of these occurrence data on the General Bathymetric Chart of the Oceans (GEBCO, Centenary Edition) global 30-arc second bathymetric grid (IOC, IHO, and BODC, 2003) using ArcGIS Desktop v. 10.2 (Environmental Systems Research Institute 2011).
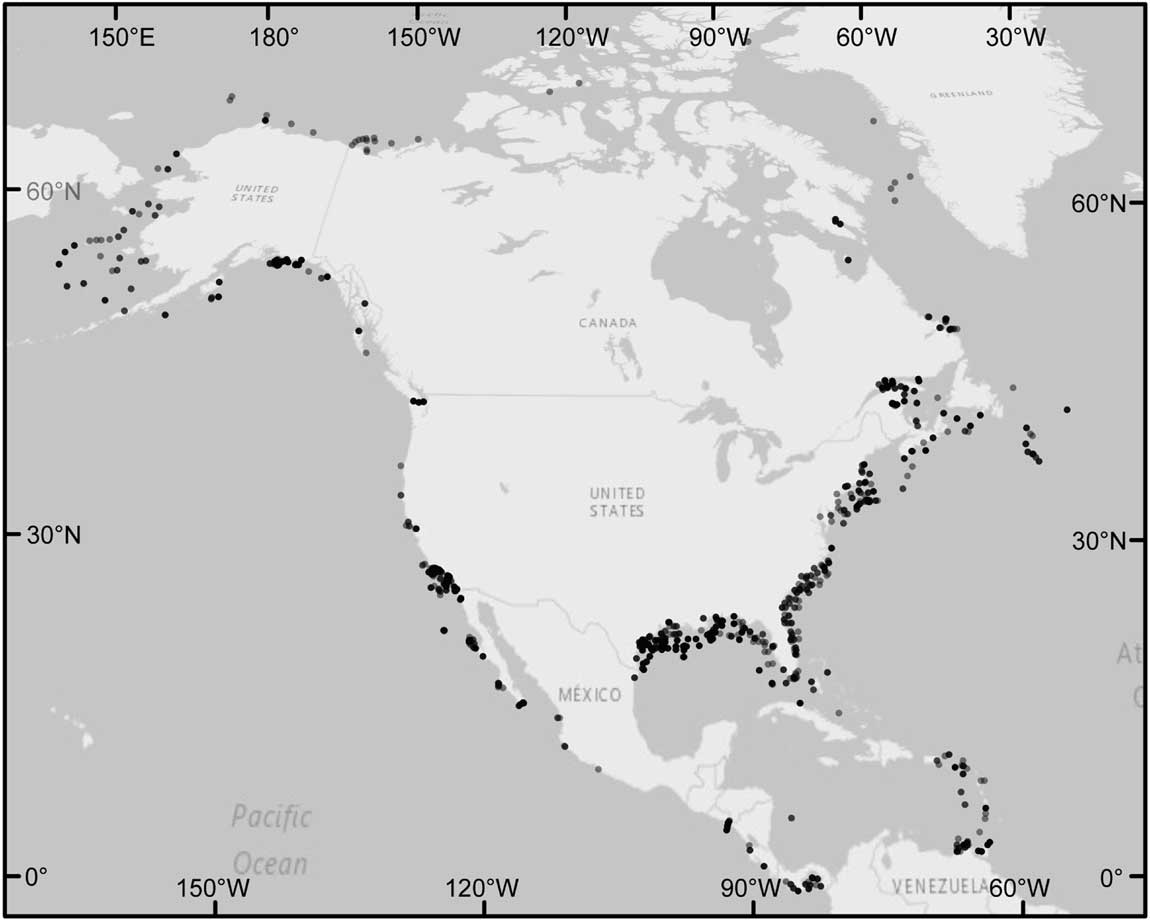
Figure 2 Localities of Rotaliida foraminiferal occurrences that have accompanying adult/proloculus size ratios and data for all four hypothesized environmental variables. Points are transparent to show variations in the density of foraminiferal localities (i.e., darker points represent a higher density of localities). The largest sampling density of 52 occurrences occurs at 59.75°N, 144.92°W. The largest number of species at a locality (16 species) occurs at 11.00°N, 61.00°W, and at this site, the among-species adult test volumes range from (log10-transformed) −2.99 to −0.67 mm3 and proloculus volumes range from (log10-transformed) −5.97 to −3.43 mm3.
Endemic and cosmopolitan species are often presumed to exhibit different life-history traits across environmental gradients (Eldredge et al. Reference Eldredge, Thompson, Brakefield, Gavrilets, Jablonski, Jackson, Lenski, Lieberman, McPeek and Miller2005). For this North American data set, we classified species as endemic if they only have occurrences present along one continental margin and are thus absent from the other. Species grouped as endemic to the Atlantic included occurrences from the Caribbean Sea. However, we excluded species from the Gulf of Mexico in our classification of Atlantic endemic species, because the Gulf of Mexico has distinct physical and chemical oceanographic conditions compared with the open Atlantic. To analyze this data set, we partitioned the data into five groups based on geography and/or energetic resource availability: (1) cosmopolitan species that occur across both the Pacific and Atlantic continental margins of North America, (2) species endemic to the western Atlantic, (3) species endemic to the eastern Pacific, (4) species endemic to Atlantic oligotrophic waters, and (5) species endemic to Pacific oxygen minimum zones (OMZs). We defined OMZs as Pacific waters with dissolved oxygen concentrations less than 0.5 ml/L (Douglas Reference Douglas1987; Helly and Levin Reference Helly and Levin2004). Using mean annual chlorophyll concentrations derived from satellite SeaWiFS data, we defined Atlantic oligotrophic waters as those with [Chl]<0.05 mg/m3 between 22°N and 27°N (see Morel et al. Reference Morel, Claustre and Gentili2010). By these conventional definitions, there are no Atlantic waters in the study region that classify as OMZs and no Pacific waters that classify as oligotrophic.
Morphology
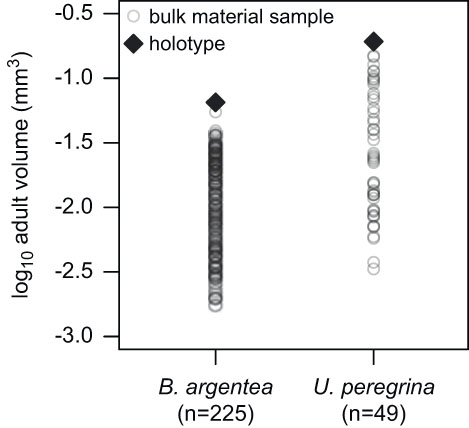
We assigned modern rotaliid species from the North American occurrence data set with one proloculus and one adult test volume calculated from images and illustrations of foraminiferal holotypes published in the Catalogue of Foraminifera (Ellis and Messina 1940–Reference Ellis and Messina2006). Kosnik et al. (Reference Kosnik, Jablonski, Lockwood and Novack-Gottshall2006) found that the sizes of fossil mollusk bivalve and gastropod holotype specimens generally correlate with both the mean and maximum sizes of bulk populations. The approach to using a single holotype specimen to represent the morphology of a species is adequate for analyses spanning many species across a diverse and morphologically disparate higher taxon, such as rotaliid benthic foraminifera (Fig. 3). Thus, our approach of using holotypes is sufficient for the purposes of this study, because the total amount of test size variation among species is much greater than that within species (Rego et al. Reference Rego, Wang, Altiner and Payne2012) and because proloculus size correlates positively with adult test size among species (Berger Reference Berger1969; Van Gorsel Reference Van Gorsel1978; Caval-Holme et al. Reference Caval-Holme, Payne and Skotheim2013).

Figure 3 A comparison of test sizes for bulk sampled material relative to holotype specimens for Bolivina argentea and Uvigerina peregrina, illustrating that holotype specimens are similar in size to the largest specimens from the bulk samples. The holotype specimens were used in this study to approximate the sizes of the largest specimens, because locality-level data are not available for most species at most known localities. The test volumes for the bulk collection come from a previous study of foraminifera in the Santa Monica Basin (Keating-Bitonti and Payne Reference Keating-Bitonti and Payne2016).
Rotaliid foraminifera grow by secreting new calcareous chambers to the test, thereby recording the ontogenetic histories of individuals. The proloculus is often visible in common rotaliid morphotypes, meaning that it is relatively easy to quantify both the initial embryonic cell volume and the final adult volume. Foraminifera exhibit non-overlapping sexual and asexual generations (Goldstein Reference Goldstein1999), and different modes of reproduction in foraminifera result in different test morphologies (Schenck Reference Schenck1944). Diploid daughter cells are the product of either sexual reproduction or mitosis, resulting in microspheric forms. Microspheric individuals generally have proloculus diameters<20 μm, but these individuals can grow to have relatively large adult tests (Seiglie Reference Seiglie1976; Nigam and Rao Reference Nigam and Rao1987; Douglas and Staines-Urias Reference Douglas and Staines-Urias2007). The process of diploid cells giving rise to haploid cells via meiosis produces megalospheric forms that have relatively large proloculus diameters that are typically between 20 and 90 μm (Seiglie Reference Seiglie1976; Nigam and Rao Reference Nigam and Rao1987; Douglas and Staines-Urias Reference Douglas and Staines-Urias2007), but their diameters can be up to 1000 μm (Schenck Reference Schenck1944). Megalospheric individuals are more common than microspheric ones—microspheric forms rarely exceed 5–10% of the total living population (Lutze Reference Lutze1964; Seiglie Reference Seiglie1976; Douglas and Staines-Urias Reference Douglas and Staines-Urias2007). For this study, we only considered megalospheric forms and made measurements on holotype specimens identified as megalospheric in the accompanying figure captions in the Catalogue of Foraminifera. Proloculus measurements are matched and thus compiled in the same way to adult test sizes from the Catalogue of Foraminifera.
Using digital calipers, we measured the maximum dimensions along three mutually orthogonal axes (height, width, length) of holotype specimens from published illustrations. We assigned one adult/proloculus size ratio value to each species and applied this value to all species’ occurrences in the North American data set. We assumed that the adult volume of the foraminiferal test can be approximated by the equation for a generalized three-dimensional ellipsoid and calculated its volume as
 $${4 \over 3}{\rm \rpi }\left( {abc} \right)$$
, where a, b, and c represent the radii (Payne et al. Reference Payne, Groves, Jost, Nguyen, Moffitt, Hill and Skotheim2012). The proloculus is spherical in shape (Schenck Reference Schenck1944; Caval-Holme et al. Reference Caval-Holme, Payne and Skotheim2013), and we used measurements made on the proloculus diameter to calculate its volume as
$${4 \over 3}{\rm \rpi }\left( {abc} \right)$$
, where a, b, and c represent the radii (Payne et al. Reference Payne, Groves, Jost, Nguyen, Moffitt, Hill and Skotheim2012). The proloculus is spherical in shape (Schenck Reference Schenck1944; Caval-Holme et al. Reference Caval-Holme, Payne and Skotheim2013), and we used measurements made on the proloculus diameter to calculate its volume as
 $$\,{4 \over 3}\rpi r^{3} $$
, where r represents the radius. Foraminifera with involute tests grow such that late-stage chambers engulf the proloculus (Hansen Reference Hansen1999). We only measured the proloculus of an involute morphotype if a cross-sectional image was provided in the Catalogue of Foraminifera. Across fossil taxonomic groups, geometric approximations such as ellipsoids and spheres are reliable proxies of biovolume measured through water displacement (Novack-Gottshall Reference Novack-Gottshall2008: Figs. 1 and 2). Errors introduced by approximations made on test morphology (such as approximating a cube as a sphere of equal radius) are unlikely to yield more than 0.3 log10 units of uncertainty (Novack-Gottshall Reference Novack-Gottshall2008; Payne et al. Reference Payne, Groves, Jost, Nguyen, Moffitt, Hill and Skotheim2012), much smaller than the 3.5 log units of variation spanned across the data set presented herein.
$$\,{4 \over 3}\rpi r^{3} $$
, where r represents the radius. Foraminifera with involute tests grow such that late-stage chambers engulf the proloculus (Hansen Reference Hansen1999). We only measured the proloculus of an involute morphotype if a cross-sectional image was provided in the Catalogue of Foraminifera. Across fossil taxonomic groups, geometric approximations such as ellipsoids and spheres are reliable proxies of biovolume measured through water displacement (Novack-Gottshall Reference Novack-Gottshall2008: Figs. 1 and 2). Errors introduced by approximations made on test morphology (such as approximating a cube as a sphere of equal radius) are unlikely to yield more than 0.3 log10 units of uncertainty (Novack-Gottshall Reference Novack-Gottshall2008; Payne et al. Reference Payne, Groves, Jost, Nguyen, Moffitt, Hill and Skotheim2012), much smaller than the 3.5 log units of variation spanned across the data set presented herein.
With these size measurements, we used the adult/proloculus size ratios to estimate the proportional growth of the foraminifer during its life. Although these size ratios do not provide information about rates of growth or age, inferences about foraminiferal growth strategies and longevity can be made from biogeographic patterns of adult/proloculus size ratios and their associations with oceanographic variables.
Oceanographic Data
We compiled data on oceanographic variables frequently hypothesized to influence the metabolic physiology of foraminifera following the method of Keating-Bitonti and Payne (Reference Keating-Bitonti and Payne2016). These variables include temperature (°C), dissolved oxygen concentration (ml/L), seawater calcite saturation (Ω), and particulate organic carbon (POC) flux to the seafloor (g of C m−2). We used the model of Lutz et al. (Reference Lutz, Caldeira, Dunbar and Behrenfeld2007) to estimate the annual flux of POC to the seafloor as a proxy for food availability. This model predicts the annual POC flux to the seafloor at a grid spacing of ~12.5 km using an algorithm that incorporates POC flux sediment-trap measurements with remotely sensed sea-surface temperature and net primary productivity. Mean annual temperature, dissolved oxygen concentration, and salinity were compiled from the World Ocean Atlas 2009 (Antonov et al. Reference Antonov, Seidov, Boyer, Locarnini, Mishonov, Garcia, Baranova, Zweng and Johnson2010; Garcia et al. Reference Garcia, Locarnini, Boyer, Antonov, Baranova, Zweng and Johnson2010; Locarnini et al. Reference Locarnini, Mishonov, Antonov, Boyer, Garcia, Baranova, Zweng and Johnson2010). Each locality’s latitude and longitude coordinate and water depth were matched to the nearest oceanographic 1° grid point. Although we did not include salinity as one of our oceanographic predictors in the regression analyses, salinity was used with dissolved inorganic carbon concentration (DIC) and alkalinity to calculate the seawater calcite saturation. We compiled mean annual values of seawater alkalinity and DIC from the Global Ocean Data Analysis Project (Key et al. Reference Key, Kozyr, Sabine, Lee, Wanninkhof, Bullister, Feely, Millero, Mordy and Peng2004) and carbon dioxide in the Atlantic Ocean (CARINA Group 2009). We used the R package ‘seacarb’ v. 3.0.11 (Gattuso et al. Reference Gattuso, Epitalon and Lavigne2015) to estimate the seawater calcite saturation for each locality, providing input data for alkalinity, DIC, salinity, temperature, and pressure (water depth).
Statistical Analysis and Model Selection
We used the R package ‘glmpath’ v. 0.97 (Park and Hastie Reference Park and Hastie2013) to determine the relative importance of temperature, dissolved oxygen, POC flux, and calcite saturation in structuring the biogeographic distribution of modern benthic foraminiferal proloculus volumes and the adult/proloculus size ratios from the North American continental margin. For our statistical analysis, we standardized all oceanographic variables to mean zero and unit variance to enable direct comparison of coefficient magnitudes in a generalized linear model. To identify the best model, we used the L1-regularized regression approach. In each analysis, the ‘glmpath’ function glm() computes a series of multiple linear-regression solutions, with each model step incorporating an additional predictor variable until all predictors are incorporated (see Supplementary Figure S1). New model steps are computed when the best model for a given sum of the absolute values of the coefficients (i.e., the regularization) introduces a new environmental predictor into the model. Together, these model steps provide a path of best-fitting models as a function of the sum of the absolute values of the coefficients (see Fig. 1C,F). The larger the absolute sum of the coefficients, the more predictors are able to enter the model and the more closely the model will fit the data. To identify the best model step along the path, we used the Akaike information criterion (AIC) and Bayesian information criterion (BIC). Both the AIC and BIC are penalized likelihood criteria that help to choose the best predictors in regression analyses, but the BIC penalizes models more severely. When the best-fit model differed based on the minimum AIC versus BIC values, we selected the model with the fewest environmental predictors corresponding to the minimum BIC value (e.g., Payne et al. Reference Payne, Jost, Wang and Skotheim2013).
We performed L1-regression analyses on the following subsets of North American proloculus volumes and adult/proloculus size ratios: (1) all cosmopolitan species from the North American continental margin (Atlantic and Pacific), (2) all North American species classified as endemic to either the Atlantic or Pacific, (3) cosmopolitan species from the Atlantic continental margin, (4) Atlantic endemic species, (5) endemic species to Atlantic oligotrophic waters, (6) cosmopolitan species from the Pacific continental margin, (7) Pacific endemic species, and (8) endemic species to Pacific OMZs. We observe similar ranges in the four environmental predictor variables in each comparison of the geographic subsets of the North American continental margin (see Table 1).
Table 1 The minimum, maximum, range, and median values of the four hypothesized environmental variables for each subgrouping of the North American continental margin. All data subgroups have similar environmental values and ranges except for Pacific oxygen minimum zones (OMZs), which have a narrower range of temperature, oxygen, and calcite saturation values.

We used the R package ‘lmodel2’ v. 1.7-2 (Legendre Reference Legendre2014) to determine the standardized major axis regression between adult test volume and proloculus volume. We also tested the significance of differences in proloculus volumes, adult volumes, and the adult/proloculus size ratios between North American cosmopolitan species and all endemic species, and endemic species specific to the Pacific and Atlantic using an independent two-group t-test in R (R Core Team 2015).
Results
Environmental Controls
Environmental predictors that structure the distribution of North American among-species adult/proloculus size ratios are consistent with physiological expectations (Table 2). All four environmental predictors are included in the best-fit model for North American cosmopolitan adult/proloculus size ratios, with temperature (inverse correlation) and dissolved oxygen (positive correlation) explaining the largest proportion of the variation (i.e., large standardized coefficients; Fig. 4A). The among-species distribution of adult/proloculus size ratios of North American cosmopolitan species occurring in the Atlantic is best explained by variations in temperature (inverse correlation), POC flux (positive correlation), and dissolved oxygen concentration (positive correlation; see Fig. 4C). Among-species adult/proloculus size ratios of cosmopolitan species occurring in the Pacific are best described by dissolved oxygen concentration (positive correlation) and temperature (negative correlation), but oxygen explains a greater amount of the variation (Fig. 4E). However, temperature alone best explains the distribution of endemic adult/proloculus size ratios from the Pacific and those from the Atlantic continental margins of North America (Fig. 4D,F).
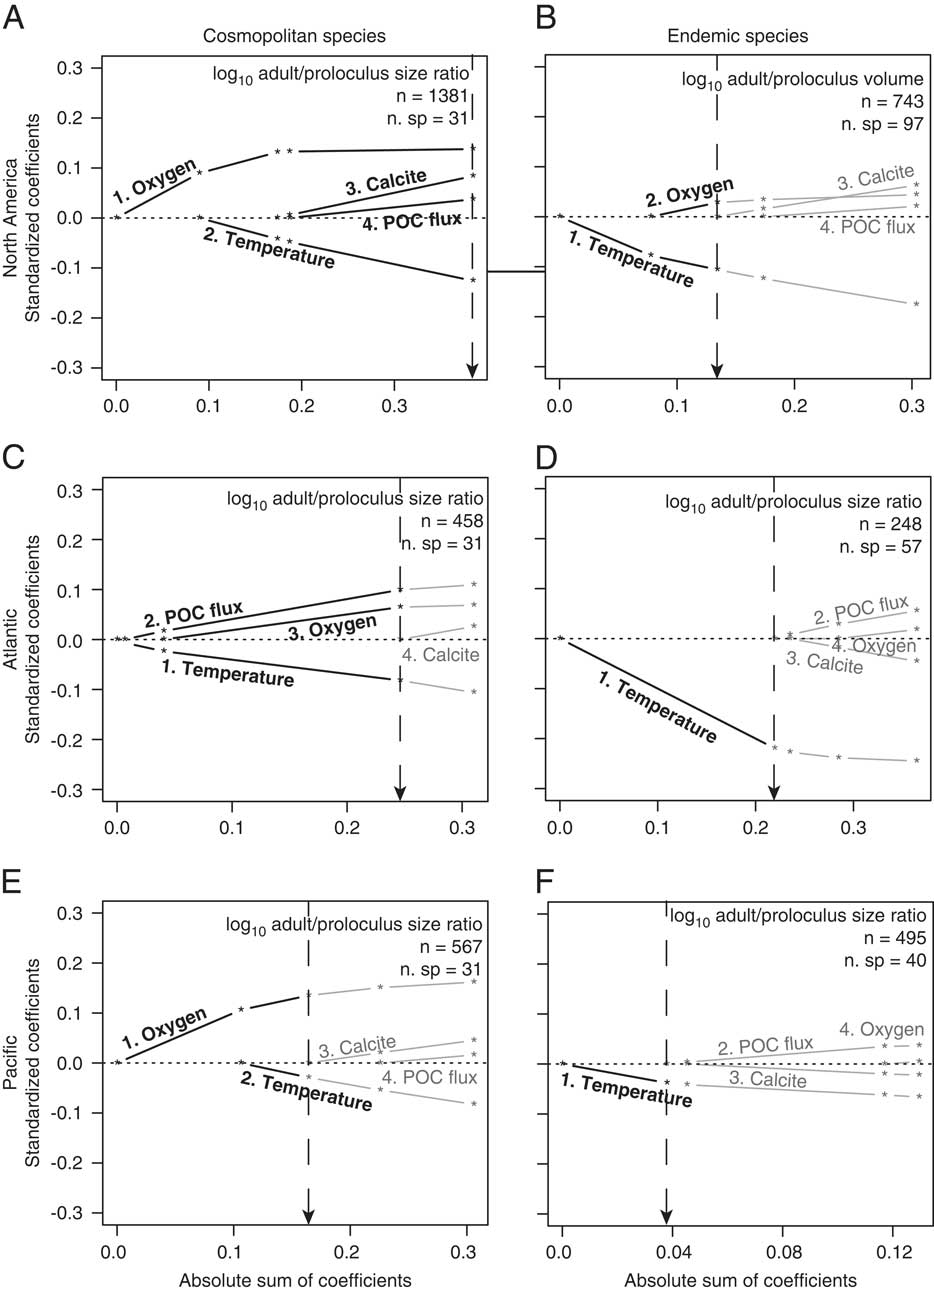
Figure 4 Results of L1-regularized regression analysis assessing the correlations between environmental predictors and among-species log adult/proloculus size ratios for North American cosmopolitan species (A), endemic species from both the Atlantic and Pacific North American continental margin (B), Atlantic cosmopolitan species (C), Atlantic endemic species (D), Pacific cosmopolitan species (E), and Pacific endemic species (F). Bold black lines and text represent the environmental variables that comprise the best model for predicting variations in among-species log adult/proloculus size ratios based on AIC and BIC model selection criteria (see Table 2). Gray lines and text are environmental predictors not included in the best model. The numbers that lead the environmental predictors correspond to the order in which the predictor variables are added to the model. Dashed vertical lines point to the absolute sum of the coefficients of the environmental predictors that comprise the best-supported model, shown visually with bold lines and text. All data and lines that plot to the right of the dashed vertical line are new models introducing new variables and return to gray because these models are nonsignificant. For example, in D, temperature is the only environmental variable included the best-fit model. In E, dissolved oxygen is ranked the most important environmental predictor followed by temperature, and together these two environmental variables yield the best model for explaining variation the log adult/proloculus size ratios. See Supplementary Fig. S1 and Supplementary Table S1 for the individual regressions and statistics accompanying D.
Table 2 The order (i.e., step) of environmental variables added to the model to best predict the among-species distribution of log adult/proloculus size ratios for: cosmopolitan species on the North American Atlantic and Pacific continental margins (total and broken out by coast), endemic species on the North American Atlantic and Pacific continental margins (total and broken out by coast), and endemic species in Atlantic oligotrophic waters and Pacific OMZs. The Akaike information criterion (AIC) and Bayesian information criterion (BIC) values are reported as the difference (∆) between the model in question and the model with the lowest reported value. Our model selection process considers both AIC and BIC values, and if two models yield similar values, we use the simpler model (i.e., the model with the fewer environmental predictor variables). Under the null model, all environmental predictors have zero regression coefficients (i.e., no trends between the environmental predictors and proloculus size). Figs. 4 and 5 illustrate the correlations between the environmental predictors and log adult/proloculus size ratios. POC flux, particulate organic carbon flux.

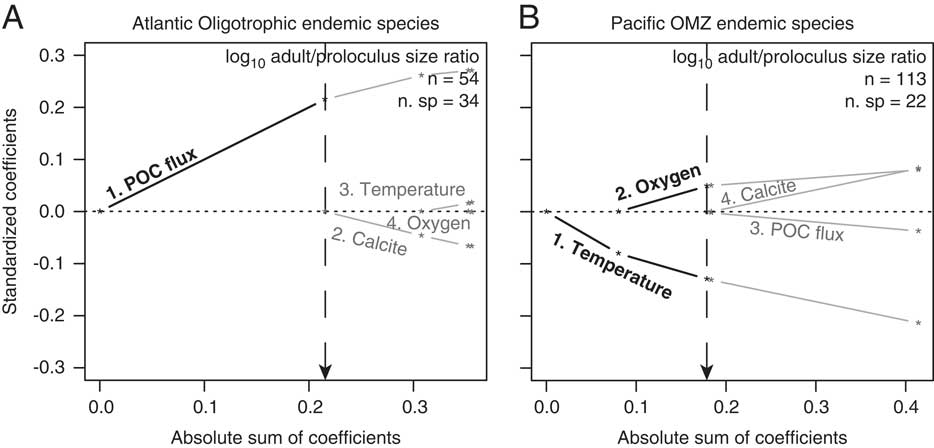
Among-species adult/proloculus size ratios of endemic species occurring in Atlantic oligotrophic waters correlate positively with POC flux (Table 2, Fig. 5A). Within OMZ endemic species only, both temperature (inverse correlation) and dissolved oxygen (negative correlation) influence the among-species distribution of adult/proloculus size ratios (Table 2, Fig. 5B).

Figure 5 Results of L1-regularized regression analysis assessing the correlations between environmental predictors and among-species log adult/proloculus size ratios for species endemic to western Atlantic oligotrophic waters (A) and species endemic to eastern Pacific OMZs (B). Bold black lines and text illustrate the significant environmental variables that comprise the best model for predicting among-species log adult/proloculus size ratios based on AIC and BIC model selection criteria (see Table 2). Gray lines and text are environmental predictors that are nonsignificant and not included in the best model. The numbers that lead the environmental predictors correspond to the order in which the predictor variables are added to the model. Dashed vertical lines point to the absolute sum of the coefficients of the environmental predictors that comprise the best-supported model, shown visually with bold lines and text. All data and lines that plot to the right of the dashed vertical line are new models introducing new variables and return to gray because these models and their variables are nonsignificant.
North American benthic foraminiferal adult/proloculus size ratios are primarily structured by the physicochemical controls on adult test size rather than on proloculus size. For among-species proloculus volumes, the model selection criteria for three of our eight analyses favor the null model (Atlantic cosmopolitans, Atlantic endemics, and Pacific endemics; see Table 3). Under the null model, all environmental predictors have zero regression coefficients (i.e., no meaningful correlation exists between the environmental predictors and proloculus size). Models consistent with first principles of cell physiology are expected to show a positive correlation of dissolved oxygen, calcite saturation, and POC flux with proloculus size, and an inverse correlation between temperature and proloculus size. The best-fit models describing the among-species distribution of proloculus sizes from the North American continental margin for the remaining five analyses include associations that violate predictions from first principles of cell physiology (i.e., North American cosmopolitans, North America endemics, Pacific cosmopolitans, Atlantic oligotrophic endemics, and Pacific OMZ endemics; see Table 3). For example, the favored model based on AIC and BIC model selection criteria for North American cosmopolitan species suggests that foraminiferal proloculus volumes decrease with increasing dissolved oxygen concentrations (i.e., inverse correlation). However, physiological principles predict larger maximum sizes with increasing dissolved oxygen concentrations (i.e., positive correlation).
Table 3 The order (i.e., step) of environmental variables added to the model to best predict the among-species distribution of proloculus volumes for: cosmopolitan species on the North American Atlantic and Pacific continental margins (total and broken out by coast), endemic species on the North American Atlantic and Pacific continental margins (total and broken out by coast), and endemic species in Atlantic oligotrophic waters and Pacific oxygen minimum zones (OMZs). The Akaike information criterion (AIC) and Bayesian information criterion (BIC) values are reported as the difference (∆) between the model in question and the model with the lowest reported value. Our model selection process considers both AIC and BIC values, and if two models yield similar values, we use the simpler model (i.e., the model with the fewer environmental predictor variables). Under the null model, all environmental predictors have zero regression coefficients (i.e., no trends between the environmental predictors and proloculus size). Because we do not provide figures illustrating these model results, we give the direction of association between among-species log proloculus volumes and the four environmental predictor variables: + denotes a positive correlation; − denotes an inverse correlation. POC flux, particulate organic carbon flux.
Size Patterns
Although there are no significant differences in the mean proloculus volumes of cosmopolitan species versus all endemic species, or between Atlantic versus Pacific endemic species, size differences are apparent among these subgroups (Fig. 6A). In general, endemic species tend to have a larger range of proloculus volumes than cosmopolitan species, and the minimum proloculus size for endemic species is approximately one order of magnitude smaller than that of cosmopolitan species. The among-species distribution of adult test volumes mirrors the distribution of proloculus volumes (Fig. 6B). This pattern reflects the strong positive correlation between the adult test volume and proloculus volume of the holotype specimens (Table 4, Fig. 7). However, the median adult volumes of species endemic to the Pacific are significantly larger than endemics in the Atlantic (Fig. 6B).
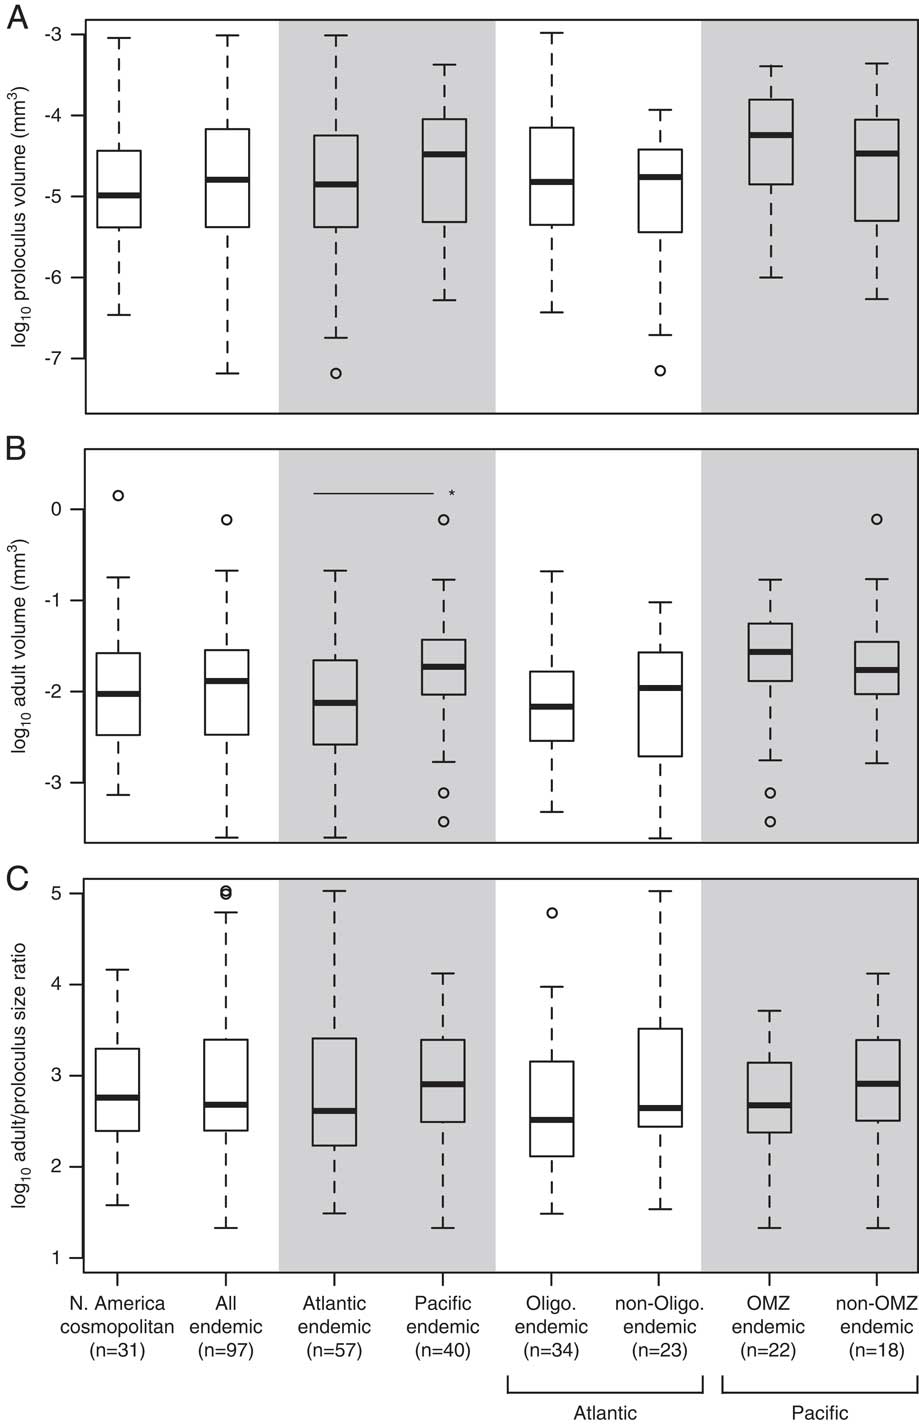
Figure 6 The among-species distribution of log proloculus volumes (A), log adult test volumes (B), and log adult/proloculus size ratios (C) for North American cosmopolitan species and species endemic to the Atlantic and Pacific continental margins of North America. We further separated Atlantic endemics into species occurring in oligotrophic waters and Pacific endemic species into those occurring in OMZs. In B, the horizontal line with asterisk denotes a significant difference in the mean volumes between Atlantic and Pacific endemic species determined using an independent two-sample t-test (p<0.01). Box-plot whisker lengths represent 1.5×interquartile range.

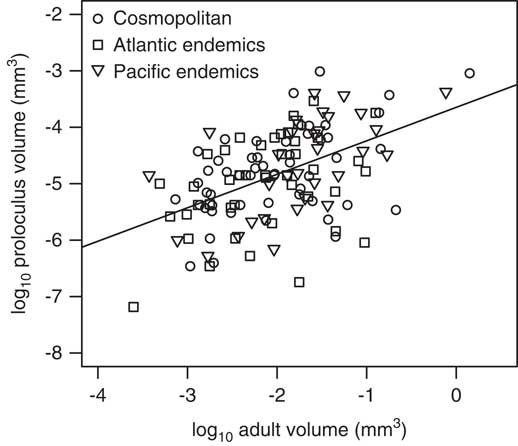
Figure 7 Relationship between log proloculus versus adult test volumes per species for both cosmopolitan and endemic foraminifera from the North American continental margin. Gray points are measurements for single holotype specimens, and the solid line represents the slope from the standardized major axis regression for all North American species (m=0.59). The slopes for the standardized major axes for the Atlantic and Pacific endemics are 0.51 and 0.73, respectively (refer to Table 4).
Table 4 Summary of standardized major axis regressions for the relationship between proloculus and adult test volumes calculated for North American cosmopolitan species and species endemic to the Atlantic, Pacific, western Atlantic oligotrophic waters, and eastern Pacific oxygen minimum zones (OMZs) in log10-log10 space. We also include the standardized major axis regression results for rotaliid foraminifera (modern and fossil representatives) reported by Caval-Holme et al. (Reference Caval-Holme, Payne and Skotheim2013). The slope and intercept ranges are reported as±95% confidence intervals.
Rotaliid species have invariant median adult/proloculus size ratios across the different North American subgroups (Fig. 6C). The median adult/proloculus size ratio for the North American data set is 2.7±0.7 log units. Overall, endemic species exhibit a greater range of adult/proloculus size ratios than cosmopolitan species (Fig. 6C). This large range of adult/proloculus size ratios is primarily driven by species endemic to the Atlantic, rather than those endemic to the Pacific continental margin of North America.
Select foraminiferal species possess traits that are hypothesized to provide metabolic energy (i.e., nitrate-storing vacuoles, bacterial ectosymbionts, chloroplast husbandry, algal endosymbionts). Our North American data set includes seven species that have nitrate-storing vacuoles, bacterial ectosymbionts, and/or are known to denitrify (see Supplementary Table S2). These species are: Bolivina alata, B. argentea, B. seminude, Bulimina aculeate, Globobulimina auriculata, G. pacifica, and Uvigerina peregrina. Both the proloculus and adult test volumes of these seven species are relatively large (Fig. 8A,B). However, the adult/proloculus size ratios of these species are smaller than those of North American species that are not currently known to possess these traits (Fig. 8C).
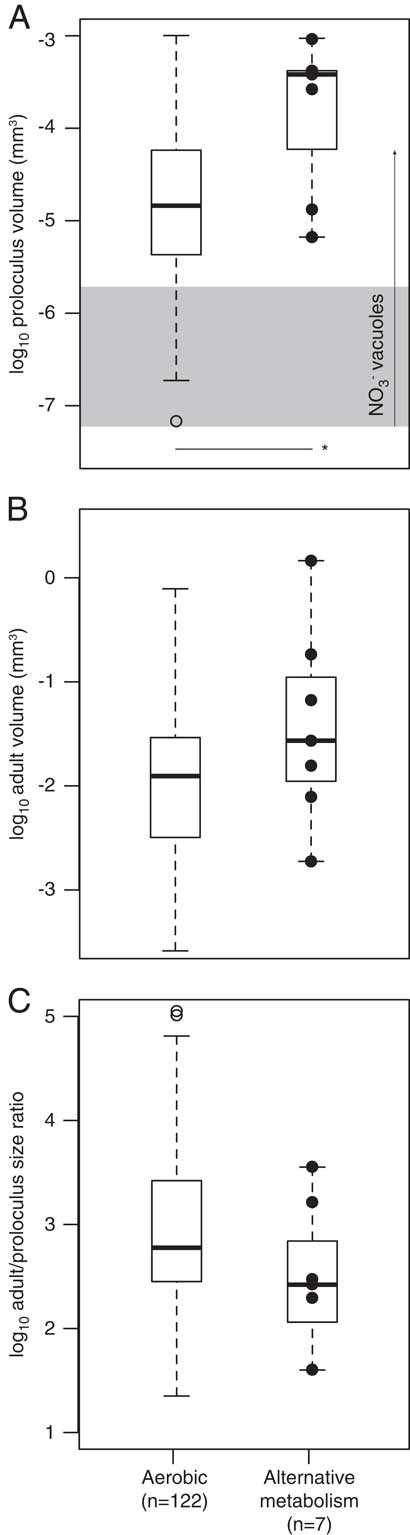
Figure 8 The among-species distribution of log proloculus volumes (A), log adult test volumes (B), and log adult/proloculus size ratios (C) for species with no known evidence for an alternative metabolism (presumed aerobic) and species with traits (solid black circles) that are hypothesized to provide additional metabolic energy to foraminifera (Bolivina alata, B. argentea, B. seminude, Bulimina aculeate, Globobulimina auriculata, G. pacifica, and Uvigerina peregrina; see Supplementary Table S2). In A, the horizontal line with asterisk denotes a significant difference in the mean proloculus volumes of aerobic species versus species with known alternative metabolic strategies (p<0.05). The horizontal gray box in A represents the typical size of nitrate-storing vacuoles (0.005–0.015 mm), and the vertical arrow marks the large vacuole (0.05 mm) discovered in Nonionella stella (Bernhard et al. Reference Bernhard, Casciotti, McIlvin, Beaudoin, Visscher and Edgcomb2012a). Box-plot whisker lengths represent 1.5×interquartile range.
Discussion
Physicochemical Controls on Foraminiferal Sizes
The finding that among-species adult test sizes follow predictions from cell physiology whereas proloculus volumes do not is consistent with the expectation that environmental constraints related to surface area-to-volume scaling have a greater influence at larger sizes unless shape changes dramatically with size. The lack of environmental constraints on among-species proloculus volume may instead imply that the initial size of the cell is a function of the parent size (Table 3, Fig. 7; see Hallock Reference Hallock1985; Hottinger Reference Hottinger1982; Schenck Reference Schenck1944) and/or of other untested factors, such as fecundity, predation pressures, species interactions, or substrate type and grain size. In contrast, the biogeographic variations in adult test volume among modern benthic foraminiferal species from the North American continental margin are driven by variations in temperature and oxygen, reflecting environmental influence on foraminiferal energy metabolism (Keating-Bitonti and Payne Reference Keating-Bitonti and Payne2016). The significant associations between environmental predictors and among-species adult test sizes and adult/proloculus size ratios in North American benthic foraminifera are not a function of non-overlapping environmental predictor ranges (Table 1).
Temperature is the only significant predictor of endemic species adult/proloculus size ratios from the Atlantic and Pacific continental margins of North America, suggesting that endemics are less constrained by oceanographic conditions unique to their respective basins (e.g., Eldredge et al. Reference Eldredge, Thompson, Brakefield, Gavrilets, Jablonski, Jackson, Lenski, Lieberman, McPeek and Miller2005). However, the among-species distribution of adult/proloculus size ratios of OMZ and oligotrophic endemics suggests that they are influenced by the limiting energy resource in these environments (Fig. 5). Overall, these findings demonstrate that environmental constraints are weaker for endemic species relative to cosmopolitan species but, at least in extreme conditions of low oxygen or food availability, energetic resources do impose a significant constraint on endemic species.
Among-species adult/proloculus size ratios of cosmopolitan foraminifera tend to be influenced by the most limited environmental variable in the Atlantic or Pacific when occurring on that specific continental margin, in addition to ambient temperature. In the Pacific, among-species adult/proloculus size ratios of cosmopolitans are influenced by both temperature and dissolved oxygen concentrations (Fig. 4E). As oxygen is severely limited in areas of the eastern Pacific, impinging on the physiological tolerance of aerobic organisms (Gooday et al. Reference Gooday, Levin, da Silva, Bett, Cowie, Dissard, Gage, Hughes, Jeffreys, Lamont, Larkin, Murty, Schumacher, Whitcraft and Woulds2009; Levin Reference Levin2003), oxygen exhibits a greater influence (i.e., larger coefficient) over temperature on the biogeographic distribution of cosmopolitan adult/proloculus size ratios (Fig. 4E). Among-species adult/proloculus size ratios of cosmopolitan species present in the Atlantic are influenced by temperature, oxygen, and POC flux (Fig. 4C). The positive association of Atlantic cosmopolitan adult/proloculus size ratios to both POC flux and oxygen concentration suggests that food availability influences organism metabolism independently of dissolved oxygen concentrations.
The calcite saturation of seawater is never the most significant environmental variable in any of our models, consistent with evidence from other marine taxa that the energetic cost of calcification is relatively low (Wood et al. Reference Wood, Spicer and Widdicombe2008; Findlay et al. Reference Findlay, Wood, Kendall, Spicer, Twitchett and Widdicombe2009; Spalding et al. Reference Spalding, Fischer and Finnegan2015). However, overall test and proloculus dimensions might not capture the influence of calcite saturation. For example, chamber wall thickness might be more sensitive to calcite saturation than individual chamber or test volume. Indeed, dissolved oxygen and carbon dioxide covary in the oceans, such that oxygen minima coincide with carbon dioxide maxima (Paulmier et al. Reference Paulmier, Ruiz-Pino and Garcon2011). Thus, the observed pattern of thinning tests with decreasing oxygen concentrations in OMZs (e.g., Sen Gupta and Machain-Castillo Reference Sen Gupta and Machain-Castillo1993) might be a function of increasing carbon dioxide concentrations and, thus, decreasing calcite saturation.
Life-History Implications Inferred from Size Patterns
Reduced metabolic rates in cold conditions often correlate with retarded growth, increased longevity, and delayed maturation in marine invertebrates (Vance Reference Vance1973a, Reference Vanceb; Clarke Reference Clarke1979; Van Voorhies Reference Van Voorhies2001; Schöne et al. Reference Schöne, Tanabe, Dettman and Sato2003; Speakman Reference Speakman2005; Moss et al. Reference Moss, Ivany, Judd, Cummings, Bearden, Kim, Artruc and Driscoll2016). Benthic foraminifera might also attain relatively large adult test sizes in cold water due to suppressed metabolic rates (Fig. 4, 5B), thereby delaying reproduction and prolonging growth (Hallock Reference Hallock1985). However, planktonic foraminifera tend to have increased size ranges and overall larger tests in warm waters, features that are attributed to increased metabolic rates, fast growth, and short life spans (e.g., Bijma et al. Reference Bijma, Faber and Hemleben1990; Spero and Lea Reference Spero and Lea1996; Schmidt et al. Reference Schmidt, Renaud, Bollmann, Schiedbel and Thierstein2004; Lombard et al. Reference Lombard, Labeyrie, Michel, Spero and Lea2009).
Adult foraminifera living in OMZs are often larger than predicted based on first principles of cell physiology (Keating-Bitonti and Payne Reference Keating-Bitonti and Payne2017). Several benthic foraminiferal species recovered from oxygen-limited waters were documented with bacterial endosymbionts or with large vacuoles with NO3 concentrations greater than levels found in the ambient environment (refer to Supplementary Table S1; Risgaard-Petersen et al. Reference Risgaard-Petersen, Langezaal, Ingvardsen, Schmid, Jetten, Op den Camp, Derksen, Piña-Ochoa, Eriksson, Nielsen, Revsbech, Cedhagen and van der Zwaan2006; Piña-Ochoa et al. Reference Piña-Ochoa, Høgslund, Geslin, Cedhagen, Revsbech, Nielsen, Schweizer, Jorissen, Rysgaard and Risgaard-Petersen2010; Koho et al. Reference Koho, Piña-Ochoa, Geslin and Risgaard-Petersen2011; Bernhard et al. Reference Bernhard, Casciotti, McIlvin, Beaudoin, Visscher and Edgcomb2012a, Reference Bernhard, Edgcomb, Casciotti, McIlvin and Beaudoinb). Nitrate-storing vacuoles are hypothesized to allow the foraminifera to respire using stored nitrate, thereby providing metabolic energy to the eukaryote in the absence of oxygen. Under suboxic (<0.11 ml/L) to hypoxic (0.50–1.43 ml/L) conditions, it might be advantageous for foraminifera to be large to accommodate large vacuoles that potentially store nitrate. Bolivina argentea, Bulimina marginata, and Buliminella tenuata have vacuoles that range from 5 to 15 μm in diameter (Bernhard and Alve Reference Bernhard and Alve1996; Bernhard and Bowser Reference Bernhard and Bowser2008; Bernhard et al. Reference Bernhard, Casciotti, McIlvin, Beaudoin, Visscher and Edgcomb2012a), and one specimen of Nonionella stella was observed with a vacuole greater than 50 μm in diameter (Bernhard et al. Reference Bernhard, Casciotti, McIlvin, Beaudoin, Visscher and Edgcomb2012a). Both the proloculus and adult volumes of the seven species with nitrate-storing vacuoles in this data set are relatively large (Fig. 8A,B), suggesting that large proloculi are required to accommodate large nitrate-storing vacuoles acquired from parental protoplasm via vertical transfer, which may be essential for inhabiting OMZ environments. However, it remains unresolved whether test size differences between species with and without nitrate-storing vacuoles are related to other untested factors, such as prolonged life spans associated with reduced metabolic rates or the absence of predators in low-oxygen environments.
Organisms that perform denitrification are also capable of aerobic respiration, because both processes require the same core respiratory machinery (Chen and Strous Reference Chen and Strous2013). Bolivina argentea inhabits OMZs and is recognized as a facultative anaerobe capable of denitrification in the absence of oxygen (Bernhard et al. Reference Bernhard, Casciotti, McIlvin, Beaudoin, Visscher and Edgcomb2012a). The relatively small adult/proloculus size ratios of the seven benthic foraminiferal species with alternative metabolic strategies in our data set support the idea that these species are facultative anaerobes capable of nitrate reduction (Fig. 8C), because the energy yield from denitrification (∆G°′= −2670 kJ per mol glucose) is less than that of aerobic respiration (∆G°′=−2870 kJ per mol glucose; Strohm et al. Reference Strohm, Griffin, Zumft and Schink2007). In experimental treatments, individuals of Bulimina marginata with detectable intracellular nitrate concentrations were observed to secrete new chambers under oxic conditions, hypoxic conditions with nitrate, and hypoxic conditions without nitrate (Geslin et al. Reference Geslin, Barras, Langlet, Nardelli, Kim, Bonnin, Metzger and Jorissen2014). However, more chambers were added under oxic conditions, and the overall sizes of individuals decreased from aerobic conditions to hypoxic conditions with nitrate to hypoxic conditions without nitrate (Geslin et al. Reference Geslin, Barras, Langlet, Nardelli, Kim, Bonnin, Metzger and Jorissen2014), suggesting that the organism grows more effectively under aerobic conditions. Alternatively, these foraminifera may have severely reduced their metabolic rates to continue aerobic respiration in hypoxic waters. But the adult sizes of foraminifera relying on aerobic respiration to those using alternative metabolic strategies have overlapping test volumes (Fig. 8B), possibly because the energy yield between denitrification and aerobic respiration differs by less than 10%.
In a few instances, the best models for predicting among-species proloculus volumes show an inverse association with dissolved oxygen concentrations (i.e., North American cosmopolitan species, Pacific cosmopolitan species, and Pacific OMZ endemic species; see Table 3). An inverse association between proloculus volume and dissolved oxygen counters predictions based on first principles of cell physiology. In these cases, it is plausible that under low-oxygen conditions, parent foraminifera give rise to a small number of large daughter cells, whereas in well-oxygenated waters, parent cells might yield a higher number of small-sized daughter cells. However, asexual reproduction yielding large numbers of megalospheric individuals in OMZs typically follows seasonal fluxes of phytodetritus (Douglas and Staines-Urias Reference Douglas and Staines-Urias2007) further reducing oxygen concentrations.
Application of Proloculus Size Patterns to the Foraminiferal Fossil Record
Regardless of whether rotaliid species are classified as cosmopolitan or endemic, or possess traits that give them additional metabolic energy, foraminiferal adult/proloculus size ratios are constrained by physiochemical controls on adult test size. Keating-Bitonti and Payne (Reference Keating-Bitonti and Payne2016) documented that biogeographic patterns of among-species adult test V and V/SA are shaped by variations in local temperature and dissolved oxygen concentrations across the North American continental margin and that temporal and spatial patterns of adult foraminiferal morphology preserved in the fossil record likely reflect these physiochemical controls (e.g., Bernhard Reference Bernhard1986; Kaiho Reference Kaiho1994, Reference Kaiho1998, Reference Kaiho1999; Kaiho et al. Reference Kaiho, Takeda, Petrizzo and Zachos2006; Groves et al. Reference Groves, Rettori, Payne, Boyce and Altiner2007; Alegret et al. Reference Alegret, Ortiz, Arenillas and Molina2010; Payne et al. Reference Payne, Summers, Rego, Altiner, Wei, Yu and Lehrmann2011, Reference Payne, Groves, Jost, Nguyen, Moffitt, Hill and Skotheim2012; Song et al. Reference Song, Tong and Chen2011; Rego et al. Reference Rego, Wang, Altiner and Payne2012; Winguth et al. Reference Winguth, Thomas and Winguth2012). However, we find here that among-species variations of proloculus size do not systematically reflect local environmental conditions. Foraminiferal proloculus sizes are proportional to adult test sizes (Fig. 7), consistent with adult/offspring relationships observed in select groups of marine crustacean, cartilaginous fish, and mammals (Neuheimer et al. Reference Neuheimer, Hartvig, Heuschele, Hylander, Kiørboe, Olsson, Sainmont and Andersen2015) and in groups of planktonic and benthic foraminifera (Berger Reference Berger1969; Van Gorsel Reference Van Gorsel1978; Thomas Reference Thomas1980; Caval-Holme et al. Reference Caval-Holme, Payne and Skotheim2013). This finding suggests that foraminiferal proloculus sizes reflect parental size, while also reflecting sexual dimorphism between gamonts/schizonts and agamonts (megalospheric and microspheric forms, respectively; Schenck Reference Schenck1944). Thus, ancient environmental conditions likely cannot be reconstructed from megalospheric proloculus sizes alone.
However, previous studies have proposed a paleoclimate proxy based on proloculus sizes, suggesting that mean proloculus size decreases with warming seawater temperature and increasing salinity (Nigam Reference Nigam1986; Nigam and Rao Reference Nigam and Rao1987; Nigam and Khare Reference Nigam and Khare1995; Saraswat et al. Reference Saraswat, Nigam and Barreto2005). These studies calculated the mean proloculus size of a population using both microspheric and megalospheric forms; thus, a decrease in mean proloculus size reflects a greater proportion of microspheric forms. The relationship between mean proloculus size and the environment (e.g., temperature, salinity, or organic pollution) likely reflects reproductive strategy rather than the metabolic effect of temperature on cell size and might not be applicable to megalospheric or microspheric forms alone. Studies of within-species biogeographic variation in proloculus sizes of megalospheric forms also suggest that the environment underlies proloculus size distributions (Myers Reference Myers1943; Eder et al. Reference Eder, Briguglio and Hohenegger2016), but the environmental variable(s) shaping these patterns has not been identified nor have these patterns been quantified (see Beavington-Penney and Racey Reference Beavington-Penney and Racey2004). Furthermore, others have proposed that previously documented patterns of within-species proloculus size change might reflect the mixing of megalospheric and microspheric individuals (Röttger et al. Reference Röttger, Irwan and Schmaljohann1980; Racey Reference Racey2001; Beavington-Penney and Racey Reference Beavington-Penney and Racey2004), because it can be difficult to differentiate between the two forms (e.g., Nigam and Khare Reference Nigam and Khare1995; Saraswat et al. Reference Saraswat, Nigam and Barreto2005). Herein, our results suggest that among-species patterns of megalospheric proloculus sizes are not constrained by the local environment, and consequently, ancient environmental conditions cannot be inferred from the study of fossil foraminiferal proloculus sizes alone. Instead modern and fossil proloculus sizes appear to reflect the sizes of the parent (Berger Reference Berger1969; Van Gorsel Reference Van Gorsel1978; Caval-Holme et al. Reference Caval-Holme, Payne and Skotheim2013). Thus, morphological evolution of adult test sizes was likely driven by sharp environmental perturbations and gradual temperature and oxygen change over the Phanerozoic (Keating-Bitonti and Payne Reference Keating-Bitonti and Payne2016), whereas proloculus sizes appear to be genetically constrained (Eder et al. Reference Eder, Briguglio and Hohenegger2016).
Conclusions
Among-species variation in adult/proloculus size ratios in North American benthic foraminifera reflects physicochemical controls on adult test size. The among-species distributions of benthic foraminiferal proloculus volumes are not constrained by physical or chemical oceanographic variables. Our results also support that cosmopolitan and endemic species exhibit different physiological responses to variations in the local environment (e.g., Eldredge et al. Reference Eldredge, Thompson, Brakefield, Gavrilets, Jablonski, Jackson, Lenski, Lieberman, McPeek and Miller2005; Button et al. Reference Button, Llyod, Ezcurra and Butler2017). Foraminiferal endemic species are less physiologically constrained by the physical and chemical environment compared with co-occurring cosmopolitan species—temperature alone influences the distribution of adult/proloculus size ratios of Pacific and Atlantic endemic species. Although temperature influences the among-species distribution of adult/proloculus size ratios of cosmopolitan species, Pacific and Atlantic cosmopolitan species are also strongly influenced by dissolved oxygen and POC flux, respectively. Cosmopolitan species appear less buffered to variations in the availability of energetic resources than endemic species. Associations between oceanographic variables and among-species patterns of foraminiferal sizes lay the groundwork for interpreting possible life-history strategies of benthic foraminifera as they relate to local North American environmental habitats. Across the North American continental margin, large rotaliid species are common in cold water, which is possibly associated with increased longevity via reduced metabolic rates, as is seen in cold-induced gigantism in marine invertebrates. However, large rotaliid foraminifera do occur in warm, oligotrophic waters in the western Atlantic and in Pacific OMZs. The large sizes of foraminifera present in oligotrophic waters and OMZs may be attributed to their ability to gain metabolic energy from algal or bacterial symbionts or from nitrate reduction. Thus, the environment plays a strong role in the evolution of foraminiferal adult test sizes in addition to influencing their life-history strategies.
Acknowledgments
We thank many summer and high school interns for help collecting data. We especially thank C. M. Sobek for her exceptional work in collecting and analyzing proloculus data. We also thank D. T. Medeiros for help extracting oceanographic data in ArcGIS. The comments from P. M. Novack-Gottshall and two anonymous reviewers improved the article, and we thank the reviewers for their helpful feedback. C.R.K.-B. was supported by a U.S. National Science Foundation Graduate Research Fellowship and by the Stanford School of Earth, Energy & Environmental Sciences Professor “Si” Muller Memorial Fellowship. J.L.P. was supported by a CAREER grant from the U.S. National Science Foundation (EAR-1151022).
Supplementary Material
Data available from the Dryad Digital Repository: https://doi.org/10.5061/dryad.d5p86fp