


Introduction
The Cretaceous/Paleogene (K/Pg) boundary at ~66 Ma is perhaps best known for the extinction of nonavian dinosaurs (e.g., Schulte et al. Reference Schulte, Alegret, Arenillas, Arz, Barton, Bown, Bralower, Christeson, Claeys, Cockell, Collins, Deutsch, Goldin, Goto, Grajales-Nishimura, Grieve, Gulick, Johnson, Kiessling, Koeberl, Kring, MacLeod, Matsui, Melosh, Montanari, Morgan, Neal, Nichols, Norris, Pierazzo, Ravizza, Rebolledo-Vieyra, Reimold, Robin, Salge, Speijer, Sweet, Urrutia-Fucugauchi, Vajda, Whalen and Willumsen2010; Brusatte et al. Reference Brusatte, Butler, Barrett, Carrano, Evans, Lloyd, Mannion, Norell, Peppe, Upchurch and Williamson2015). However, there was also a major extinction of plant taxa across the K/Pg boundary, with ~50–60% and 15–30% of mega- and microfloral species becoming extinct, respectively (e.g., Wilf and Johnson Reference Wilf and Johnson2004; Nichols and Johnson Reference Nichols and Johnson2008; Vajda and Bercovici Reference Vajda and Bercovici2014). The best records of this extinction in plants are from North America (e.g., Nichols and Johnson, Reference Nichols and Johnson2008). The postextinction North American record documents a major restructuring of terrestrial ecosystems, a destabilization of terrestrial food webs, and a prolonged recovery that extended at least into the middle Paleocene (Hickey Reference Hickey1980; Wing et al. Reference Wing, Alroy and Hickey1995; McIver Reference McIver1999; Dunn Reference Dunn2003; Wilf and Johnson Reference Wilf and Johnson2004; Wilf et al. Reference Wilf, Labandeira, Johnson and Ellis2006; Peppe Reference Peppe2010; Blonder et al. Reference Blonder, Royer, Johnson, Miller and Enquist2014). Thus, reconstructions of patterns of plant community diversity and composition in the early Paleocene are necessary to fully understand both local and regional ecosystem recovery following the K/Pg mass extinction.
Extensive early Paleocene megafloral collections have been made in North America for over 150 years (e.g., Newberry Reference Newberry1868; Lesquereux Reference Lesquereux1878; Brown Reference Brown1962; Hickey Reference Hickey1980; Wolfe and Upchurch Reference Wolfe and Upchurch1987; Wing et al. Reference Wing, Alroy and Hickey1995; Johnson Reference Johnson2002; Barclay et al. Reference Barclay, Johnson, Betterton and Dilcher2003; Peppe Reference Peppe2010). The majority of these studies have focused on the Northern Great Plains (NGP) of North America (Fig. 1A) (e.g., Newberry Reference Newberry1868; Lesquereux Reference Lesquereux1878; Brown Reference Brown1962; Hickey Reference Hickey1980; Barclay et al. Reference Barclay, Johnson, Betterton and Dilcher2003; Dunn Reference Dunn2003; Wilf and Johnson Reference Wilf and Johnson2004; Peppe Reference Peppe2010), with large collections of floras from the first 300,000 years of the Paleocene being primarily from the Denver Basin (DB) of central Colorado (Barclay et al. Reference Barclay, Johnson, Betterton and Dilcher2003; Johnson et al. Reference Johnson, Reynolds, Werth and Thomasson2003) and the Williston Basin (WB) of North Dakota (e.g., Johnson Reference Johnson1989, Reference Johnson2002; Johnson and Hickey Reference Johnson and Hickey1990; Wilf and Johnson Reference Wilf and Johnson2004; Peppe Reference Peppe2010). Early Paleocene plant communities from the NGP are characterized by low diversity and are dominated by long-lived, cosmopolitan, mire-adapted taxa (Hickey Reference Hickey1980; Johnson Reference Johnson2002; Barclay et al. Reference Barclay, Johnson, Betterton and Dilcher2003; Peppe Reference Peppe2010). These floras were dominated by fast-growing angiosperms with high assimilation rates and low carbon investment, suggesting the K/Pg bolide impact selected against slower-growing evergreen species, leading to large-scale ecosystem restructuring (Blonder et al. Reference Blonder, Royer, Johnson, Miller and Enquist2014). These patterns of low floral diversity and relatively homogeneous floral composition have been documented across a distance of >1200 km from southern Alberta to central Colorado (e.g., Brown Reference Brown1962; Hickey Reference Hickey1980; McIver and Basinger Reference McIver and Basinger1993; Johnson Reference Johnson2002; Barclay et al. Reference Barclay, Johnson, Betterton and Dilcher2003; Dunn Reference Dunn2003; Peppe Reference Peppe2010). Analyses of NGP floras through the Paleocene indicate that it took several million years for floras to fully recover and approach levels of floral diversity common in the Late Cretaceous (Hickey Reference Hickey1980; Wing et al. Reference Wing, Alroy and Hickey1995; Dunn Reference Dunn2003; Wilf and Johnson Reference Wilf and Johnson2004; Peppe Reference Peppe2010).
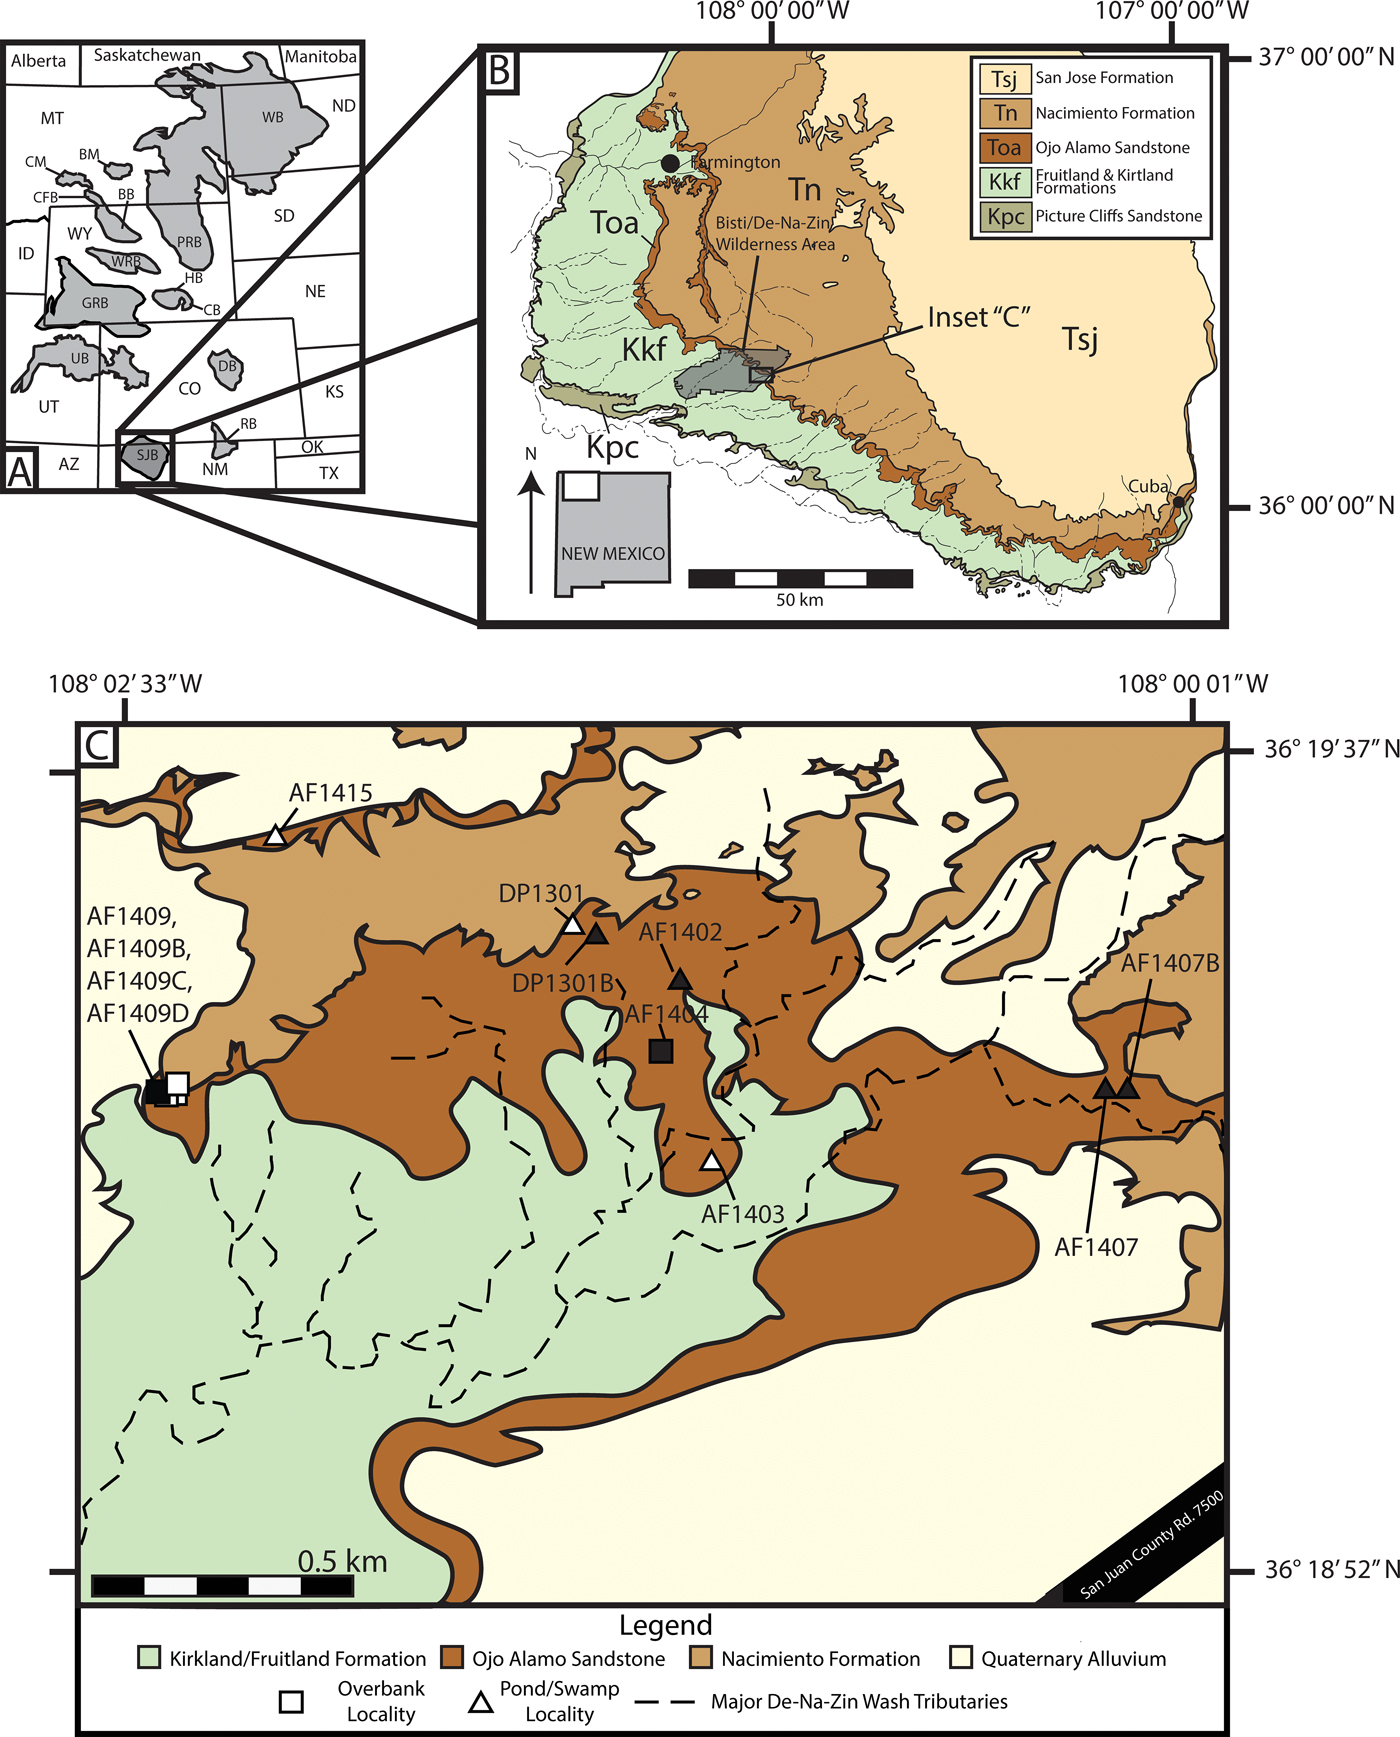
Figure 1. Regional basin map, San Juan Basin (SJB) geologic map, and map of the study area. A, Early Paleocene basins of western North America (modified from Peppe Reference Peppe2010) showing the location of the SJB. B, Geologic map of the southwestern SJB showing the geographic occurrences of Late Cretaceous–Eocene deposits and the study area (modified from Williamson et al. Reference Williamson, Nichols and Weil2008). C, Geologic map of the Bisti/De-Na-Zin Wilderness Area with fossil leaf localities indicated (filled shapes, census collections; open shapes, voucher collections).
In contrast to the patterns from the NGP (e.g., Brown Reference Brown1962; Johnson Reference Johnson2002; Barclay et al. Reference Barclay, Johnson, Betterton and Dilcher2003; Peppe Reference Peppe2010), fossil megafloral patterns from the first ~3.0 Myr of the Paleocene collected along the Colorado Front Range in the DB are considerably more diverse and comprise many species that are interpreted as endemic to the area (Johnson and Ellis Reference Johnson and Ellis2002; Ellis et al. Reference Ellis, Johnson and Dunn2003; Johnson et al. Reference Johnson, Reynolds, Werth and Thomasson2003). While contemporaneous floras from the NGP had ~10–40 morphotypes (Hickey Reference Hickey1980; Wing et al. Reference Wing, Alroy and Hickey1995; Johnson Reference Johnson2002; Dunn Reference Dunn2003; Wilf and Johnson Reference Wilf and Johnson2004; Peppe Reference Peppe2010), the floras from the Colorado Front Range typically have >30 morphotypes and are the basis for suggestions that rapid floral recovery and high rates of speciation following the K/Pg boundary along the margins of the ancestral Rocky Mountains (Johnson and Ellis Reference Johnson and Ellis2002; Ellis et al. Reference Ellis, Johnson and Dunn2003; Johnson et al. Reference Johnson, Reynolds, Werth and Thomasson2003). This pattern of recovery is in stark contrast to patterns of speciation and diversity documented across the NGP, including floras from <50 km to the east in the central DB (e.g., Wing et al. Reference Wing, Alroy and Hickey1995; Barclay et al. Reference Barclay, Johnson, Betterton and Dilcher2003; Johnson et al. Reference Johnson, Reynolds, Werth and Thomasson2003; Wilf and Johnson Reference Wilf and Johnson2004; Peppe, Reference Peppe2010), and suggests both latitudinal differences in diversity and/or the potential for local or regional diversity hotspots that resulted from rapid recovery after the K/Pg extinctions. Further, the high proportion of endemic megafloral taxa in the Colorado Front Range (Johnson and Ellis Reference Johnson and Ellis2002; Ellis et al. Reference Ellis, Johnson and Dunn2003; Johnson et al. Reference Johnson, Reynolds, Werth and Thomasson2003) suggests that the early Paleocene flora is not as homogeneous as has been suggested, and instead that there are latitudinal differences in floral composition across North America. Studies of pollen and fossil wood from the latest Cretaceous and early Paleocene also support a latitudinal gradient in floral composition across North America and a clear differentiation in composition of floras from the mid- to low latitudes and floras from the NGP (Frederiksen Reference Frederiksen1987; Nichols et al. Reference Nichols, Fleming, Frederiksen, Kauffman and Walliser1990; Lehman and Wheeler Reference Lehman and Wheeler2009). Nichols et al. (Reference Nichols, Fleming, Frederiksen, Kauffman and Walliser1990) found that floras from mid- to low latitudes had higher diversity and were more dominated by endemic taxa than floras from more northern provinces. However, relatively little research has been conducted on the fossil leaf floras from southern North America, limiting comparisons of the megafloral record across latitudes and a comparison of the biogeographic patterns identified from both fossil wood and pollen to the megafloral record.
Here we describe a relatively diverse early Paleocene fossil megaflora from the San Juan Basin of New Mexico that occurred within the first ~350 kyr of the Paleogene (Figs. 1, 2). We describe the composition and diversity of floral communities, examine differences in floral communities between depositional environments, and estimate mean annual temperature and precipitation within the San Juan Basin. Finally, we compare the earliest Paleocene San Juan Basin megaflora to contemporaneous megafloras from the NGP of North America to assess regional differences in floral diversity, composition, and paleoclimate during the earliest Paleocene.
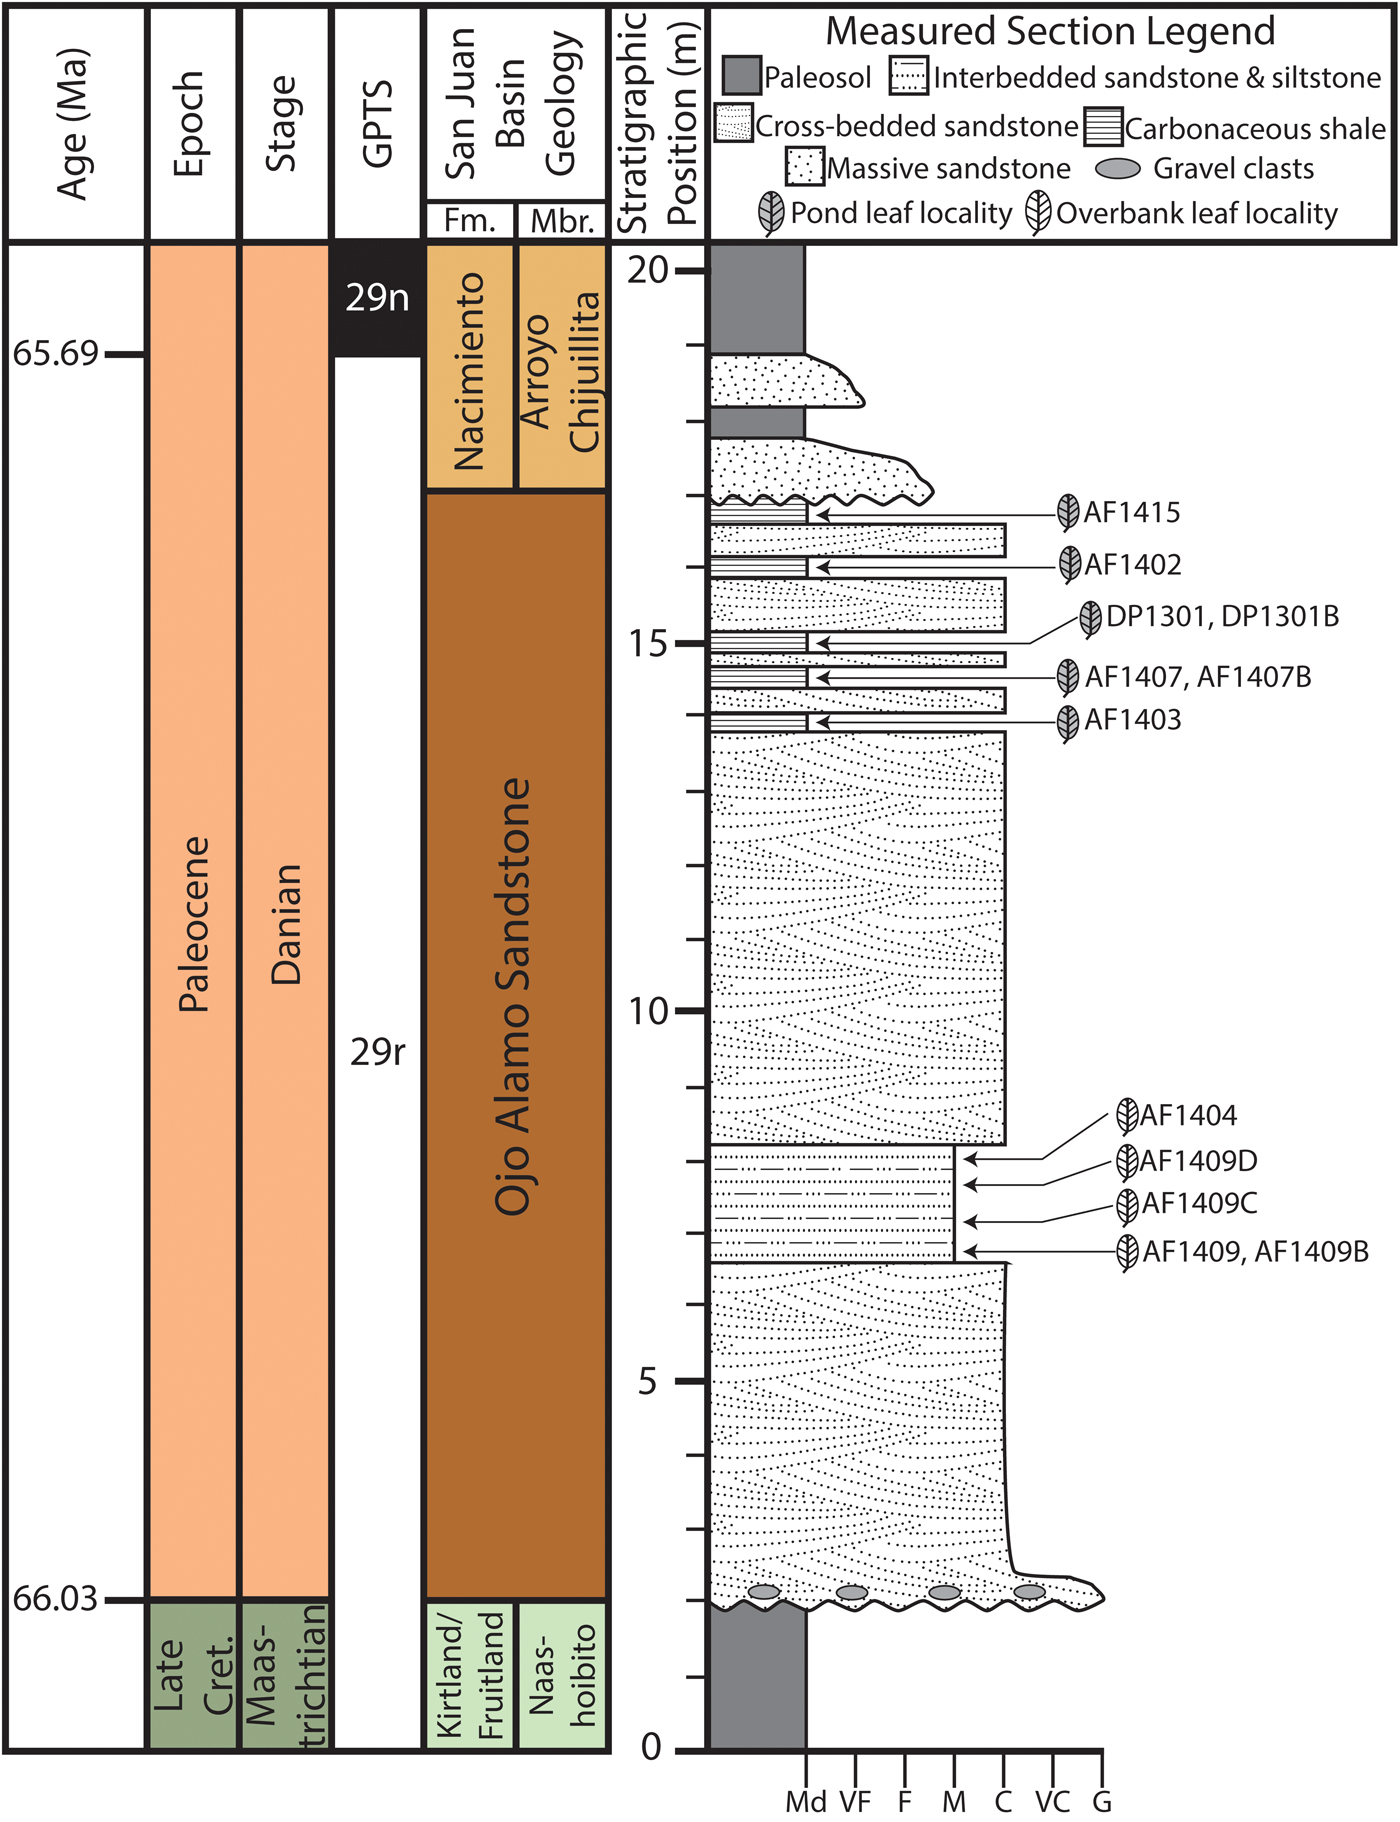
Figure 2. Generalized geochronology and measured section of latest Cretaceous Naashoibito Member and early Paleocene Ojo Alamo Sandstone and Nacimiento Formations. Age interpretations based on Mason (Reference Mason2013) and Peppe et al. (Reference Peppe, Heizler, Williamson, Mason, Brusatte, Weil and Secord2013). North American Land Mammal Age (NALMA) and biozone (Pu1, Pu2) from Williamson (Reference Williamson1996). The stratigraphic position and lithology of all fossil leaf–bearing horizons are shown.
Geologic Setting
The San Juan Basin (SJB), located in northwestern New Mexico and southwestern Colorado (Fig. 1A), is a foreland basin formed during the Laramide Orogeny (Chapin and Cather Reference Chapin and Cather1983; Williamson Reference Williamson1996). The basin preserves a relatively continuous succession of terrestrial sedimentary rocks spanning the Late Cretaceous (Campanian) through the early Paleocene (Baltz et al. Reference Baltz, Ash and Anderson1966; O'Sullivan et al. Reference O'Sullivan, Repenning, Beaumont and Page1972; Williamson Reference Williamson1996; Williamson et al. Reference Williamson, Nichols and Weil2008). Fossil plant material for this study was collected from the earliest Paleocene Ojo Alamo Sandstone in the Bisti/De-Na-Zin (BDNZ) Wilderness Area (Fig. 1B,C), which varies from 10 to 15 m in thickness in the study area and is predominantly a gold to yellow-colored, cross-bedded, medium- to coarse-grained sandstone with interbedded sandstone and siltstone deposits and localized carbonaceous shale beds (Supplementary Fig. 1; Baltz et al. Reference Baltz, Ash and Anderson1966; O'Sullivan et al. Reference O'Sullivan, Repenning, Beaumont and Page1972). The Ojo Alamo Sandstone is thought to represent an alluvial plain with one or more sediment sources in the southern Rocky Mountains that was deposited during the onset of tectonism associated with basin development (Powell Reference Powell and Fassett1973; Chapin and Cather Reference Chapin and Cather1983; Sikkink Reference Sikkink1987; Cather Reference Cather, Mack and Giles2004). The amalgamated channel belts, low mud to sand ratio, and the presence of relatively high flow regime bedforms correspond with proximal deposits in a distributed fluvial system (Weissmann et al. Reference Weissmann, Hartley, Scuderi, Nichols, Davidson, Owen, Atchley, Bhattacharyya, Chakraborty, Ghosh, Michel, Tabor, Driese and Nordt2013), which supports the hypothesis that the Ojo Alamo was deposited during a time of relatively limited accommodation space associated with the onset of basin subsidence in the latest Cretaceous and early Paleocene (Cather Reference Cather, Mack and Giles2004). The Ojo Alamo Sandstone overlies the Maastrichtian Naashoibito Member of the Kirtland Formation and underlies the early Paleocene Nacimiento Formation (Baltz et al. Reference Baltz, Ash and Anderson1966; Lindsay et al. Reference Lindsay, Jacobs and Butler1978; Williamson Reference Williamson1996; Mason Reference Mason2013; Peppe et al. Reference Peppe, Heizler, Williamson, Mason, Brusatte, Weil and Secord2013). The contact between the Ojo Alamo Sandstone and Nacimiento Formation is complex and regionally varies from being conformable with the basal paleosols of the Nacimiento weathering into the upper Ojo Alamo Sandstone to unconformable with evidence for the contact being erosive (e.g., Williamson and Lucas Reference Williamson and Lucas1992; Williamson Reference Williamson1996; Davis et al. Reference Davis, Peppe, Atchley, Williamson and Flynn2016). In the BDNZ, the contact between the Ojo Alamo Sandstone and Nacimiento Formation appears to generally be conformable (Williamson Reference Williamson1996; Davis et al. Reference Davis, Peppe, Atchley, Williamson and Flynn2016).
Differences in nomenclature between the Ojo Alamo Sandstone and the Naashoibito Member of the Kirtland Formation have caused confusion when relating the two lithologic units (e.g., Sullivan et al. Reference Sullivan, Lucas and Braman2005; Williamson and Weil Reference Williamson and Weil2008; Fassett Reference Fassett2009). The Ojo Alamo Sandstone and Naashoibito Member have both been recognized as unique stratigraphic units in different formations (i.e., the Ojo Alamo Sandstone is its own formation and the Naashoibito is a member of the Kirtland Formation [e.g., Baltz et al. Reference Baltz, Ash and Anderson1966; Williamson Reference Williamson1996; Williamson and Weil Reference Williamson and Weil2008; Williamson et al. Reference Williamson, Nichols and Weil2008]) or as different members within the Ojo Alamo Formation (i.e., the Kimbeto Member and the Naashoibito Member [e.g., Sullivan et al. Reference Sullivan, Lucas and Braman2005; Fassett Reference Fassett2009]). Herein we use the definition of Baltz et al. (Reference Baltz, Ash and Anderson1966) for the Ojo Alamo Sandstone and recognize it as a unique stratigraphic formation. For clarity, this is equivalent to the Kimbeto Member of the Ojo Alamo Formation proposed by Sullivan et al. (Reference Sullivan, Lucas and Braman2005).
In addition to confusion about the nomenclature of the Ojo Alamo Sandstone and the Naashoibito Member of the Kirtland Formation, the age of the units remains contentious. Some authors have claimed that both the Ojo Alamo Sandstone and Naashoibito Member of the Kirtland Formation are Paleocene (Fassett Reference Fassett2009), while others have interpreted the Naashoibito Member of the Kirtland Formation to be Late Cretaceous and the Ojo Alamo Sandstone to be early Paleocene (Sullivan and Lucas Reference Sullivan and Lucas2003; Sullivan et al. Reference Sullivan, Lucas and Braman2005; Williamson et al. Reference Williamson, Nichols and Weil2008). Palynostratigraphy of the Ojo Alamo Sandstone and the Nacimiento Formation indicates that the Ojo Alamo Sandstone is earliest Paleocene (Anderson Reference Anderson1959; Williamson et al. Reference Williamson, Nichols and Weil2008). Further, the occurrence of Momipites inaequalis in the Ojo Alamo Sandstone (Anderson Reference Anderson1959), suggests that it can be correlated to the North American Paleocene palynostratigraphic zones P1 or P2 (Nichols Reference Nichols, Raynolds and Flores2003). Mason (Reference Mason2013) used detrital sanidine dating to constrain the maximum depositional age of the Naashoibito Member of the Kirtland Formation to the late Maastrichtian and the Ojo Alamo Sandstone near Cuba, New Mexico, to early Paleocene in age. Magnetostratigraphy from the BDNZ Wilderness Area through the Naashoibito Member of the Kirtland Formation, Ojo Alamo Sandstone, and lower Nacimiento Formation indicate that the upper Naashoibito Member of the Kirtland Formation, the entire Ojo Alamo Sandstone, and the basal 4 m of the Nacimiento Formation are all reversed polarity, indicating deposition within magnetic chron 29r (Peppe et al. Reference Peppe, Heizler, Williamson, Mason, Brusatte, Weil and Secord2013). Based on the Ojo Alamo Sandstone pollen assemblage and geochronology of the Naashoibito Member of the Kirtland Formation, Ojo Alamo Sandstone, and Nacimiento Formation, we interpret that the Ojo Alamo floras, which are the focus of this work, to have been deposited within C29r during the first ~350 kyr of the Paleocene (Fig. 2).
Methods
Collection and Classification
Plant fossils were collected from 12 localities from the Ojo Alamo Sandstone in the BDNZ Wilderness Area during field seasons in 2013–2016 (Fig. 1C). Because the upper and lower contacts of the Ojo Alamo are not flat lying, the stratigraphic position of each leaf locality was measured to both from the top of the underlying Naashoibito Member of the Kirtland Formation and to the base of the overlying Nacimiento Formation (Fig. 2). Localities ranged from 4.65 to 14.5 m above the base of the Ojo Alamo Sandstone and between 10.0 and 1.0 m below the Nacimiento Formation contact (Fig. 2). Localities were assigned a two-letter code for site discoverer, and a field locality number using a two-digit annual number indicating the year of collection and a sequential site number (e.g., AF1404 is the fourth site found by A.F. in 2014 and DP1301 is the first site found by D.P. in 2013); when more than one quarry was collected at a locality, sites were given an additional letter to denote different quarries (e.g., AF1409D is the fourth quarry from the ninth site found by A.F. in 2014). All collected specimens are stored in the Carlisle Geology Research Building at Baylor University in Waco, Texas, USA.
Fossil leaves were collected using the bench and quarry method in which large blocks of matrix were split along leaf-bearing bedding planes (following Johnson Reference Johnson1989). Fossil leaf quarries covered ~5–10 m2 of surface area and generally contained multiple, relatively thin (~5–25 cm) leaf-bearing horizons. At all leaf quarries, the sedimentological features of the site were recorded, and sites were assigned to sedimentary facies.
Voucher collections were made at all fossil localities. These voucher collections were selectively collected based on preservation. In addition to collecting the best-preserved specimens, when making voucher collections, we also collected at least one specimen from each known morphotype and all reasonably well-preserved unidentified plant fossils. Census collections were made at six of these localities, in addition to the voucher collection. During census collections, we quantitatively counted all identifiable plant material. At least 300 identifiable specimens were tallied in the field during census collections, because modern taphonomic studies have shown that ≥300 specimens are needed to accurately reflect floral composition (Burnham et al. Reference Burnham, Wing and Parker1992). During census collections, a new quarry adjacent to the voucher collection site was dug, and a new collection was made for the census. Representative samples and/or well-preserved samples from each identifiable morphotype and all unknown fossil material were collected. All collected specimens were given a unique site and specimen identification number (i.e., the sixth census morphotype from the site AF1404 census collection was labeled AF1404-C-006 with the “-C” denoting census collections from sites with voucher collections). After collection, all samples were wrapped in toilet paper, labeled, and shipped to Baylor University for additional analyses.
Fossil leaves are common in the Ojo Alamo Sandstone and were collected from two distinct lithologies, which we have interpreted as different depositional environments (Supplementary Fig. 1). The first fossil leaf–bearing lithology is interbedded medium- to fine-grained sandstone and siltstone beds (Supplementary Fig. 1D). The interbeds generally dip at relatively low angles and pinch out laterally. Sedimentary structures, such as ripples and small-scale cross-bedding, occasionally occur. Well-preserved fossil leaves are common in the fine-grained interbeds and rare in the coarser-grained sandstone beds. Based on the physical characteristics, we interpret these deposits to be downstream accretionary bar forms in a braided river system with the finer-grained siltstones representing periodic flooding over the predominantly sand bar forms (Powell Reference Powell and Fassett1973; Miall Reference Miall, James and Darlrymple2010). We classified five leaf localities collected from this sedimentary facies as “overbank facies” (42% of sites; Figs. 1C and 2, Supplementary Fig. 1D).
The second fossil leaf–bearing lithology is very fine grained, thinly laminated, carbonaceous shale beds with locally abundant sulfur and jarosite. The carbonaceous shales are often preserved as lenticular deposits ~15–25 m across and ~1–4 m in thickness (Supplementary Fig. 1F,G). The beds are flat lying, and no additional sedimentary structures were observed. Fossil leaves generally occur in very dense leaf mats in these beds. We interpret the carbonaceous shale deposits to be low-lying, abandoned channel fills that were off axis from the major source of deposition in the braided stream, allowing ponding of water and very-fine-grained sediments to be deposited (Miall Reference Miall, James and Darlrymple2010). These deposits are analogous to oxbow lakes in meandering fluvial systems (Miall Reference Miall, James and Darlrymple2010). We classified seven leaf localities from this sedimentary facies as “pond facies” (58% of sites; Figs. 1C and 2, Supplementary Fig. 1F,G).
In the lab at Baylor University, we assigned all identifiable plant material to SJB–wide morphotypes (morphotypes denoted by the prefix SJ- and their morphotype number, e.g., SJ-13). Morphotypes are distinct floral morphologies within a flora with no formal taxonomic assignment but are presumed to represent biological species (for review of morphotyping method, see Ash et al. [Reference Ash, Ellis, Hickey, Johnson and Wilf1999], Peppe et al. [Reference Peppe, Hickey, Miller and Green2008], and Ellis et al. [Reference Ellis, Daly, Hickey, Mitchell, Johnson, Wilf and Wing2009]). When possible, morphotypes were also assigned to previously described Linnaean taxa for comparison to previously published collections (Supplementary Table 1). The majority of morphotypes from the Ojo Alamo Sandstone represent apparently previously undescribed species and are presumed to represent endemic taxa. Non-monocotyledonous angiosperm morphotypes (which will be referred to as dicotyledonous angiosperms or dicots for the remainder of the text following common convention) were described using the Manual of Leaf Architecture (Ellis et al. Reference Ellis, Daly, Hickey, Mitchell, Johnson, Wilf and Wing2009). All other plant groups were described based on their morphology and distinctive traits. Brief descriptions and illustrations of all morphotypes are included in the Supplementary Material (Appendix 1), and a systematic list of morphotypes with their inferred taxonomy and species names is included in Supplementary Table 1.
Floral Diversity
The SJB megafloral diversity and composition were independently analyzed. These analyses were then compared with age-equivalent sites (i.e., early Paleocene localities within magnetic C29r) from the DB of central Colorado (Barclay et al. Reference Barclay, Johnson, Betterton and Dilcher2003) and the WB of western North Dakota and eastern Montana (Wilf and Johnson Reference Wilf and Johnson2004; Peppe Reference Peppe2010) (Fig. 1A). These contemporaneous localities provided a tightly constrained interval spanning ~350 kyr after the K/Pg boundary (Ogg Reference Ogg, Gradstein, Ogg, Schmitz and Ogg2012). The geographic extent of collections made in the SJB (~5 km2) is similar to the collection area in the DB (~1.5 km2; Barclay et al. Reference Barclay, Johnson, Betterton and Dilcher2003). However, the WB material was collected over an area >100 km2 (Wilf and Johnson Reference Wilf and Johnson2004; Peppe Reference Peppe2010), which may have affected the diversity results of the WB when compared with the SJB and DB.
All diversity analyses were performed using the paleontological statistical program PAST 3.0 (Hammer et al. Reference Hammer, Harper and Ryan2001). Rarefaction analyses were conducted on the six megafloral quantitative collections in the SJB, and all quantitative collections from sites within C29r in the DB and WB (Barclay et al. Reference Barclay, Johnson, Betterton and Dilcher2003; Wilf and Johnson Reference Wilf and Johnson2004; Peppe Reference Peppe2010) using all vegetative (i.e., nonreproductive) morphotypes. Diversity analyses were performed using only vegetative morphotypes due uncertainty of taxonomic placement of reproductive organs and the possibility of double counting morphotypes. Rarefaction analyses for only dicot angiosperm leaves were also conducted for the quantitatively collected localities from the SJB, DB, and WB with ≥200 dicotyledonous angiosperm samples. Total basin rarefaction analyses, in which all census data from each basin were combined, were also calculated for all plant groups and only dicot angiosperms from the SJB, DB, and WB. Ecological diversity indices were calculated using the same quantitatively collected localities from the SJB, DB, and WB to compare the species richness, evenness, and dominance of the different floras. The differences in floral species richness was estimated using the Margalef diversity index (D mg) (Margalef Reference Margalef1958; Magurran Reference Magurran2004). Floral evenness was assessed using Pielou's evenness index (J′) (Pielou Reference Pielou1969). Floral dominance was assessed using the Berger-Parker index (d) (Berger and Parker Reference Berger and Parker1970). All diversity indices were bootstrapped (N = 10,000) to generate confidence for site and basin comparisons.
In addition to species richness and diversity analyses, the influence of depositional facies, floral heterogeneity, and similarity was analyzed using the six SJB census collections. Detrended correspondence analysis (DCA) was used to assess the influence of depositional facies (i.e., landscape position) on floral composition. Cluster analysis was also performed using the Raup-Crick similarity index (Raup and Crick Reference Raup and Crick1979) to identify groupings of localities with all analyses bootstrapped (N = 10,000). Floral heterogeneity between sites (i.e., β-diversity) was analyzed using the Bray-Curtis distance index (Bray and Curtis Reference Bray and Curtis1957) between all pairs of census localities. The total, within-facies, and between-facies resultswere then averaged to obtain total and facies-specific values of floral heterogeneity.
Paleoclimate and Paleoecology
Mean annual temperature (MAT) and mean annual precipitation (MAP) were reconstructed using leaf physiognomic methods. For the SJB material, digital leaf physiognomy (DiLP), a multivariate paleoclimate model that uses the size and shape of fossil leaves, was used to estimate the MAT and MAP (Huff et al. Reference Huff, Wilf and Azumah2003; Royer et al. Reference Royer, Wilf, Janesko, Kowalski and Dilcher2005; Peppe et al. Reference Peppe, Royer, Cariglino, Oliver, Newman, Leight, Enikolopov, Fernandez-Burgos, Herrera, Adams, Correa, Currano, Erickson, Hinojosa, Hoganson, Iglesias, Jaramillo, Johnson, Jordan, Kraft, Lovelock, Lusk, Niinemets, Peñuelas, Rapson, Wing and Wright2011). All nonaquatic woody dicot angiosperm leaves were measured using the protocols of Peppe et al. (Reference Peppe, Royer, Cariglino, Oliver, Newman, Leight, Enikolopov, Fernandez-Burgos, Herrera, Adams, Correa, Currano, Erickson, Hinojosa, Hoganson, Iglesias, Jaramillo, Johnson, Jordan, Kraft, Lovelock, Lusk, Niinemets, Peñuelas, Rapson, Wing and Wright2011) and Royer et al. (Reference Royer, Wilf, Janesko, Kowalski and Dilcher2005), which are briefly summarized here (see Supplementary Fig. 2 for examples). Fossil leaf specimens were digitally extracted from the rock matrix using Adobe Photoshop (Adobe Systems, San Jose, CA). The leaf size was then reconstructed for sufficiently well-preserved specimens, and the inferred blade area, inferred major axis length, and inferred Feret's diameter were calculated for each specimen in this subset of fossil leaves. For any morphotypes with an entire margin (i.e., lacking leaf margin teeth) for which leaf size could not be reconstructed, only the margin state was recorded. Fragmentary toothed leaves were included if two or more consecutive teeth and at least 25% of the leaf area and margin were preserved. For fragmentary specimens, the damaged margin was removed and only the total number of teeth, undamaged perimeter length, and undamaged leaf area were recorded. For toothed leaves too fragmentary to measure for DiLP, only the margin state was scored.
Leaf margin analysis (LMA) (e.g., Wilf Reference Wilf1997; Miller et al. Reference Miller, Brandon and Hickey2006; Peppe et al. Reference Peppe, Baumgartner, Flynn, Blonder, Croft, Su and Simpson2018) and leaf area analysis (LAA) (e.g., Wilf et al. Reference Wilf, Wing, Greenwood and Greenwood1998; Peppe et al. Reference Peppe, Baumgartner, Flynn, Blonder, Croft, Su and Simpson2018) were used to estimate MAT and MAP, respectively, for the SJB, DB, and WB to facilitate regional paleoclimate comparisons. LMA is a univariate climate model that uses the presence or absence of toothed woody dicot angiosperm leaves to estimate MAT (Wilf Reference Wilf1997; Miller et al. Reference Miller, Brandon and Hickey2006; Peppe et al. Reference Peppe, Baumgartner, Flynn, Blonder, Croft, Su and Simpson2018). The standard error for the LMA MAT estimate was calculated using the uncertainty equation of Miller et al. (Reference Miller, Brandon and Hickey2006). LAA is a univariate climate model that uses the average leaf size of a flora to estimate MAP (Wilf et al. Reference Wilf, Wing, Greenwood and Greenwood1998; Peppe et al. Reference Peppe, Baumgartner, Flynn, Blonder, Croft, Su and Simpson2018). Each morphotype was scored to a Raunkiaer-Webb leaf size class (Webb Reference Webb1959) to estimate leaf area. Site mean leaf area was calculated using the methods of Wilf et al. (Reference Wilf, Wing, Greenwood and Greenwood1998).
Leaf mass per area (M a) is a proxy for leaf life span (Wright et al. Reference Wright, Reich, Westoby, Ackerly, Baruch, Bongers, Cavender-Bares, Chapin, Cornelissen, Diemer, Flexas, Garnier, Groom, Gulias, Hikosaka, Lamont, Lee, Lee, Lusk, Midgley, Navas, Niinemets, Oleksyn, Osada, Poorter, Poot, Prior, Pyankov, Roumet, Thomas, Tjoelker, Veneklaas and Villar2004; Royer et al. Reference Royer, Sack, Wilf, Lusk, Jordan, Niinemets, Wright, Westoby, Cariglino, Coley, Cutter, Johnson, Labandeira, Moles, Palmer and Valladares2007, Reference Royer, Miller, Peppe and Hickey2010; Riva et al. Reference Riva, Olmo, Poorter, Ubera and Villar2016), and the M a threshold between deciduous and evergreen taxa is ~129 g m−2 (Wright et al. Reference Wright, Reich, Westoby, Ackerly, Baruch, Bongers, Cavender-Bares, Chapin, Cornelissen, Diemer, Flexas, Garnier, Groom, Gulias, Hikosaka, Lamont, Lee, Lee, Lusk, Midgley, Navas, Niinemets, Oleksyn, Osada, Poorter, Poot, Prior, Pyankov, Roumet, Thomas, Tjoelker, Veneklaas and Villar2004; Royer et al. Reference Royer, Sack, Wilf, Lusk, Jordan, Niinemets, Wright, Westoby, Cariglino, Coley, Cutter, Johnson, Labandeira, Moles, Palmer and Valladares2007, Reference Royer, Miller, Peppe and Hickey2010). The M a of fossil leaves was estimated following the methods of Royer et al. (Reference Royer, Sack, Wilf, Lusk, Jordan, Niinemets, Wright, Westoby, Cariglino, Coley, Cutter, Johnson, Labandeira, Moles, Palmer and Valladares2007) using the relationship between petiole width (PW) and leaf area (A) to M a.
Results
San Juan Basin Floral Description
Megafloral collections from the SJB yielded 55 morphotypes: 5 pteridophytes (9.43% of the morphotypes), 1 lycophyte (1.89% of morphotypes), 2 conifers (3.77%), 7 monocotyledonous (monocot) angiosperms (13.21%), and 38 dicot angiosperms (71.70%) (Table 1). The 6 census collections produced 2939 specimens composed of 4.86% pteridophytes, 0.71% lycophytes, 3.27% conifers, 4.83% monocots, and 86.33% dicots (Table 1). The majority of the morphotypes have not been previously described (69.81%) and may represen taxa endemic to the SJB during the early Paleocene (Supplementary Table 1).
Table 1. Number of morphotypes and specimens by major taxonomic category and organ type. For detailed taxonomic information see Supplementary Table 1; for morphotype descriptions and illustrations see Supplementary Appendix 1.

San Juan Basin Floral Diversity
The average site rarefied richness from the six Ojo Alamo census localities was 12.99 ± 0.86 morphotypes (downsampled to 300 specimens per locality; Fig. 3, Supplementary Table 7). With the exception of site AF1402, the site rarefaction curves were not asymptotic, indicating that total species richness at most sites has not been fully sampled (Fig. 3) (Foote Reference Foote1992; Hammer et al. Reference Hammer, Harper and Ryan2001). The rarefied richness for the entire Ojo Alamo flora was 34.52 ± 2.17 morphotypes (downsampled to 1000 specimens), Supplementary Table 7), and the rarefied richness for only dicot leaves was 21.79 ± 1.90 morphotypes (downsampled to 900 specimens).

Figure 3. Rarefaction curves using all identified vegetative plant organs from the six census localities in the early Paleocene Ojo Alamo Sandstone; envelopes indicate 95% confidence intervals. Dark gray curves indicate pond localities and light gray curves indicate overbank localities. Overbank localities have greater rarefied richness at both the site and study area scales, indicating facies effect on floral species richness.
There was a strong facies effect on floral composition and diversity within the SJB flora. The pond and overbank floras had a similar number of total morphotypes, 28 and 32 morphotypes, respectively (Table 2). However, the taxonomic composition of the floras from each facies is notably different. Floras from both facies share 12 morphotypes despite being located within a relatively small geographic area (~5 km2; Fig. 1). DCA indicated that composition and relative abundance of morphotypes was considerably different between the pond and overbank facies (Fig. 3A). Raup-Crick cluster analysis resulted in two major clusters corresponding to the overbank and pond localities (Fig. 3B), and the clustering of overbank and pond localities into separate groups occurred 100% of the time, indicating the difference in floral composition between facies is highly significant. Cluster analysis also indicated that overbank localities were less similar to each other than the pond localities, with the two overbank localities having a 0.25 similarity index, while the four pond localities had a similarity index >0.9 (Fig. 4B). The overall mean Bray-Curtis distance between localities was 0.278, indicating considerable compositional differences between the censused floras (Table 3). The average Bray-Curtis distance was 0.571 between pond localities and 0.396 between overbank localities, indicating that the pond localities were more similar to one another than the overbank localities. Additionally, the mean Bray-Curtis distance was 0.154 between facies and 0.588 within facies. These results are statistically significant (t = 4.312, p = 0.008, df = 13), indicating that the β-diversity between different facies was significantly greater than within facies. The diversity and species richness of the pond and overbank floras were also significantly different. When all plant groups were included, the overbank flora had a greater site-based rarefied richness at 300 specimens than the pond flora (17.70 ± 0.51 morphotypes [n = 2] for the overbank vs. 10.63 ± 1.04 morphotypes [n = 4] for the pond; Fig. 4). Further, when all sites from each facies were combined, the overbank flora had significantly greater rarefied richness than the pond flora (Fig. 4). The total overbank flora also had a significantly greater D mg value than the total pond flora (overbank flora: 4.157; pond flora: 2.976), indicating greater species richness (Table 2). The overbank flora was also significantly more even (overbank J′: 0.6985 ± 0.0287; pond J′: 0.3327 ± 0.0200) and less dominated by the most common morphotype than the pond flora (overbank d: 0.1858 ± 0.0219; pond d: 0.7755 ± 0.0174) (Table 2). Taken together, these results demonstrate that the overbank floras and pond floras are taxonomically distinct, and the overbank floras are more diverse and species rich than the pond floras.

Figure 4. A, Detrended correspondence analysis scatter plot of all San Juan Basin (SJB) census localities and morphotypes (axis 1 eigenvalue = 0.7338; axis 2 eigenvalue = 0.1302). Localities clustered by their floral facies with the pond floras located on the left side of the plot and the overbank facies in the upper right. There was a closer relationship between morphotypes found in individual overbank facies localities compared with pond facies localities. B, Dendrogram of six SJB census localities showing two major clusters of localities (Cohen correlation = 0.9702). Dendrogram generated using the Raup-Crick index (Raup and Crick Reference Raup and Crick1979). Localities clustered together based on their depositional facies. Percentages at each branching point indicate percentage of 10,000 iterations in which that branching point appeared. In 100% of runs, the two overbank and four pond localities formed separate clusters.
Table 2. Comparison of total number of morphotypes, number of specimens, Margalef's diversity index (Margalef Reference Margalef1958), Pielou's evenness index (Pielou Reference Pielou1969), and the Berger-Parker dominance index (Berger and Parker Reference Berger and Parker1970) for each floral facies and total flora. The pond flora had fewer morphotypes, lower diversity, and evenness compared with the overbank flora. Additionally, the pond flora was more strongly dominated by the most common morphotype. Error indicates 95% confidence interval for estimates.

Table 3. Bray-Curtis index of similarity: β-diversity proxy. Mean distance = 0.278. Bray-Curtis distance within facies (0.588) is greater than between facies (0.154) and is statistically significant (t = 4.312, df = 13, p = 0.0008). Average Bray-Curtis distance between pond localities (0.571) is greater than between overbank localities (0.396), indicating pond facies had more similar floral composition.

San Juan Basin Paleoclimate and Paleoecology
The estimated MAT using DiLP with all measurable dicot angiosperm morphotypes from the Ojo Alamo Sandstone was 27.4 ± 4.0°C (n = 30 morphotypes), and using LMA it was 23.5 ± 2.5°C (n = 33 morphotypes) (Table 4, Supplementary Table 5). The estimated MAP using DiLP for the Ojo Alamo Sandstone was 154.4 cm/yr (+126.9/−69.6cm/yr, n = 30 morphotypes), and using LAA it was 192.8 cm/yr (+83.3/−58.2cm/yr, n = 33 morphotypes) (Table 4). DiLP is likely underestimating MAP, because large fossil leaves within our collection were often fragmentary and impossible to include in DiLP analysis (see further discussion of this general point in Peppe et al. [Reference Peppe, Baumgartner, Flynn, Blonder, Croft, Su and Simpson2018]). When leaf area estimate from LAA was used in the DiLP model, the MAP estimate was 201.0 cm/yr (+165.3/−90.7 cm/yr), which likely represents a more reasonable approximation of MAP.
Table 4. San Juan Basin paleoclimate estimates using digital leaf physiognomy (DiLP) (Peppe et al. Reference Peppe, Royer, Cariglino, Oliver, Newman, Leight, Enikolopov, Fernandez-Burgos, Herrera, Adams, Correa, Currano, Erickson, Hinojosa, Hoganson, Iglesias, Jaramillo, Johnson, Jordan, Kraft, Lovelock, Lusk, Niinemets, Peñuelas, Rapson, Wing and Wright2011), leaf margin analysis (LMA) (Miller et al. Reference Miller, Brandon and Hickey2006), leaf area analysis (LAA) (Wilf et al. Reference Wilf, Wing, Greenwood and Greenwood1998), and M a (Royer et al. Reference Royer, Sack, Wilf, Lusk, Jordan, Niinemets, Wright, Westoby, Cariglino, Coley, Cutter, Johnson, Labandeira, Moles, Palmer and Valladares2007) for the total flora and each floral facies. Error indicates 95% confidence intervals for each estimate. MAT, mean annual temperature; MAP, mean annual precipitation.

To assess the effect of facies on paleoclimate estimates, the DiLP MAT and MAP were calculated separately for the overbank and pond floras. The two different data sets used to calculate these estimates had very little overlap in their morphotype composition (Supplementary Table 6), yet their paleoclimate estimates were similar and overlap within uncertainty. The MAT estimated using DiLP was 23.6 ± 4.0°C for the pond flora and 27.3 ± 4.0°C for the overbank flora (Table 4, Supplementary Table 6). The MAP estimated using DiLP was 156.3 cm/yr (+128.5/−70.5 cm/yr) for the pond flora and 174.3 cm/yr (+143.3/−78.6 cm/yr) for the overbank flora (Table 4, Supplementary Table 5). These similar estimates for MAT and MAP for the overbank and pond facies indicate that despite differences in the taxonomic composition, there is no obvious facies effect with respect to paleoclimate estimates.
The M a estimate for the total Ojo Alamo Sandstone was 78.1 g/m2 (+113.9/−55.2 g/m2, n = 11 morphotypes; Table 4), and only one morphotype had an M a greater than 129 g/m2. These results demonstrate that the majority of Ojo Alamo morphotypes had a leaf life span <12 months and were deciduous (Wright et al. Reference Wright, Reich, Westoby, Ackerly, Baruch, Bongers, Cavender-Bares, Chapin, Cornelissen, Diemer, Flexas, Garnier, Groom, Gulias, Hikosaka, Lamont, Lee, Lee, Lusk, Midgley, Navas, Niinemets, Oleksyn, Osada, Poorter, Poot, Prior, Pyankov, Roumet, Thomas, Tjoelker, Veneklaas and Villar2004; Royer et al. Reference Royer, Sack, Wilf, Lusk, Jordan, Niinemets, Wright, Westoby, Cariglino, Coley, Cutter, Johnson, Labandeira, Moles, Palmer and Valladares2007). This distribution of M a is most similar to the distribution found in riparian habitats in temperate rain forests and tropical seasonal forests (Fig. 5).

Figure 5. Comparison of Ojo Alamo Sandstone floral leaf mass per area distribution with representative modern sites with different biomes/environments (modern biome data from Peppe et al. Reference Peppe, Royer, Cariglino, Oliver, Newman, Leight, Enikolopov, Fernandez-Burgos, Herrera, Adams, Correa, Currano, Erickson, Hinojosa, Hoganson, Iglesias, Jaramillo, Johnson, Jordan, Kraft, Lovelock, Lusk, Niinemets, Peñuelas, Rapson, Wing and Wright2011). The leaf mass per area distribution of the SJB flora is most similar to riparian tropical seasonal forests, in agreement with the paleoclimate estimates, which indicate a tropical seasonal forest.
Regional Floral Diversity and Paleoclimate
All species richness indices indicate that the SJB had a higher species richness than contemporaneous floras in the NGP. The SJB flora had greater species richness (n = 55 morphotypes) than contemporaneous floras from the DB (n = 49 morphotypes [Barclay et al. Reference Barclay, Johnson, Betterton and Dilcher2003]) and the WB (n = 33 morphotypes [Wilf and Johnson Reference Wilf and Johnson2004]; n = 24 morphotypes [Peppe Reference Peppe2010]) (Supplementary Table 7). The mean site rarefied richness at 300 specimens from the SJB (12.99 ± 0.86) was greater than what has been reported for the DB (11.50 ± 0.58 [Barclay et al. Reference Barclay, Johnson, Betterton and Dilcher2003]) and the WB (7.64 ± 0.73 [Wilf and Johnson Reference Wilf and Johnson2004]; 11.06 ± 0.59 [Peppe Reference Peppe2010]), indicating greater α-diversity in the SJB than in floras from the NGP (Fig. 6A, Supplementary Table 7). The basin-wide rarefied richness downsampled to 1000 specimens was also greater in the SJB (34.52 ± 2.17) than what has been reported for the DB (22.53 ± 1.30 [Barclay et al. Reference Barclay, Johnson, Betterton and Dilcher2003]) and the WB (20.52 ± 1.47 [Wilf and Johnson Reference Wilf and Johnson2004]; 18.95 ± 0.20 [Peppe Reference Peppe2010]) (Fig. 6C, Supplementary Table 7). The difference in both site and basin-wide rarefied richness is smaller, but still distinct, when using only dicot angiosperm leaves (Fig. 6B–D), because the SJB flora had a higher proportion of non-angiosperm morphotypes, in particular pteridophytes, when compared with the DB and WB floras. The D mg for the SJB (5.386) was greater than what has been reported for the DB (3.268 [Barclay et al. Reference Barclay, Johnson, Betterton and Dilcher2003]) and the WB (3.205 [Wilf and Johnson Reference Wilf and Johnson2004]; 2.596 [Peppe Reference Peppe2010]), indicating greater species richness, similar to the pattern observed from the rarefaction analysis (Fig. 7A, Supplementary Table 7). The differences between the SJB and the DB and WB were significant (p = 0.0027 to <0.0001), but there was no significant difference between the DB and WB (p = 0.9509 to 0.2217) (Supplementary Table 8A).

Figure 6. Regional rarefaction comparison between the San Juan Basin (SJB) (this study), the Denver Basin (DB) (Barclay et al. Reference Barclay, Johnson, Betterton and Dilcher2003), and the Williston Basin (WB) (Wilf and Johnson Reference Wilf and Johnson2004; Peppe Reference Peppe2010) using plant vegetative organs with envelopes indicating 95% confidence intervals. A, All census localities using all groups; B, all census localities using dicot angiosperms only; C, basin-wide using all groups; and D, basin-wide using only dicot angiosperms. At both the site and basin-wide levels, the SJB flora has greater rarefied richness than the DB and WB floras, but the difference is smaller when only dicot angiosperms are included, due to the high diversity and abundance of non-dicot angiosperm taxa in the SJB flora.

Figure 7. Diversity comparison between the San Juan Basin (SJB) (this study), Denver Basin (DB) (Barclay et al. Reference Barclay, Johnson, Betterton and Dilcher2003), and Williston Basin (WB) (Wilf and Johnson Reference Wilf and Johnson2004; Peppe Reference Peppe2010). A, Margalef's index (D mg), B, Pielou's evenness (J′), and C, Berger-Parker index (d). The SJB D mg value for the SJB flora was significantly higher than for both the DB and WB floras, indicating greater species richness. The J′ value was significantly lower and the d value was significantly greater for the SJB compared with the DB and WB, indicating the SJB flora was significantly less even and more heavily dominated by the most common taxa. Bars indicate 95% confidence intervals. For absolute values and pairwise comparisons, see Supplementary Tables 7 and 8.
Diversity indices indicate that while the SJB floras had higher species richness than contemporaneous floras, it was less even and more dominated by the most common morphotype than floras from the DB and the WB. The J′ value for the SJB (0.4488 ± 0.0164) was lower than what has been reported for the DB (0.6583 ± 0.0139 [Barclay et al. Reference Barclay, Johnson, Betterton and Dilcher2003]) and the WB (0.6425 ± 0.0089 [Wilf and Johnson Reference Wilf and Johnson2004]; 0.6746 ± 0.0205 [Peppe Reference Peppe2010]), indicating the SJB flora is less even (Fig. 7B, Supplementary Table 7). This difference was significant (p < 0.0001) when the J′ permutations from the SJB were compared to those of the DB and WB, but there was no significant difference between the DB and WB (p = 0.8309 to 0.9974) (Supplementary Table 8B). Finally, the d value for the SJB (0.6282 ± 0.0176) was greater than what has been reported for the DB (0.2332 ± 0.0184 [Barclay Reference Barclay, Johnson, Betterton and Dilcher2003]) and WB (0.3167 ± 0.0136 [Wilf and Johnson Reference Wilf and Johnson2004]; 0.2917 ± 0.0273 [Peppe Reference Peppe2010]), indicating the SJB flora was more strongly dominated by the most common morphotype (Fig. 7C, Supplementary Table 7). The difference in d values between the SJB and the DB and WB was significant when the permutations between the SJB and the other basins were calculated (p ≤ 0.0001). Additionally, the d value of the DB flora was also significantly different than for both WB floras (p ≤ 0.0001), but there was no significant difference between both WB floras (p = 0.1031) (Supplementary Table 8C).
Paleoclimate estimates therefore indicate that then SJB was warmer and wetter than the DB and WB. MAT estimates using LMA for the SJB are >6°C warmer than estimates for the DB and >14°C warmer than those for the WB (Table 5, Fig. 8). The estimated MAP using LAA from the SJB is >35 cm/yr wetter than MAP estimates for the DB and WB, though these differences are within the uncertainty of the estimates (Table 5, Fig. 8).

Figure 8. Modern ecosystem plots with paleoclimate variables. The San Juan Basin (SJB) flora corresponded with modern tropical seasonal forests using both digital leaf physiognomy (DiLP) and leaf margin analysis (LMA) + leaf area analysis (LAA). Both the Denver Basin (DB) and Williston Basin (WB) corresponded with warm and cool temperate forests, respectively, indicating the SJB represents a different biome than previously studied localities. The 95% confidence intervals for all paleoclimate estimates are shown by gray bars.
Table 5. Comparison of San Juan Basin (this study), Denver Basin (Barclay et al. Reference Barclay, Johnson, Betterton and Dilcher2003), and Williston Basin (Peppe Reference Peppe2010) mean annual temperature (MAT) estimates using leaf margin analysis (Miller et al. Reference Miller, Brandon and Hickey2006) and mean annual precipitation (MAP) using leaf area analysis (Wilf et al. Reference Wilf, Wing, Greenwood and Greenwood1998). Error indicates 95% confidence interval.

In addition to these LMA and LAA paleoclimate estimates, there are estimates for MAT and MAP from the WB using DiLP (Peppe et al. Reference Peppe, Royer, Cariglino, Oliver, Newman, Leight, Enikolopov, Fernandez-Burgos, Herrera, Adams, Correa, Currano, Erickson, Hinojosa, Hoganson, Iglesias, Jaramillo, Johnson, Jordan, Kraft, Lovelock, Lusk, Niinemets, Peñuelas, Rapson, Wing and Wright2011) that can be compared with the ones for the SJB flora. There are no DiLP MAT or MAP estimates for the DB. MAT using DiLP is 27.4 ± 4.0°C for the SJB and 15.7 ± 4.0°C for the WB (Peppe et al. Reference Peppe, Royer, Cariglino, Oliver, Newman, Leight, Enikolopov, Fernandez-Burgos, Herrera, Adams, Correa, Currano, Erickson, Hinojosa, Hoganson, Iglesias, Jaramillo, Johnson, Jordan, Kraft, Lovelock, Lusk, Niinemets, Peñuelas, Rapson, Wing and Wright2011), considerably warmer than LMA estimates for the same floras (3.1°C and 5.5°C warmer for the SJB and the WB, respectively). The large difference in MAT between DiLP and LMA is probably related to the freshwater margin effect, wherein toothed leaves are more common in environments with seasonal water availability because leaf teeth allow for more rapid leaf growth (Peppe et al. Reference Peppe, Royer, Cariglino, Oliver, Newman, Leight, Enikolopov, Fernandez-Burgos, Herrera, Adams, Correa, Currano, Erickson, Hinojosa, Hoganson, Iglesias, Jaramillo, Johnson, Jordan, Kraft, Lovelock, Lusk, Niinemets, Peñuelas, Rapson, Wing and Wright2011), which can cause LMA to underestimate MAT. Thus, we interpret the DiLP MAT estimates to be a more accurate reconstruction of climate. However, the magnitude of difference in MAT between the SJB and WB is similar using LMA and DiLP (14.1°C and 11.7°C, respectively), suggesting that the magnitude of differences in LMA MAT estimates between the basins are reasonable. The DiLP estimated MAP for the SJB (154.4 cm/yr + 126.9/−69.6 cm/yr) is lower than estimates for the WB (175.0 cm/yr + 144.0/−79.0 cm/yr [Peppe et al. Reference Peppe, Royer, Cariglino, Oliver, Newman, Leight, Enikolopov, Fernandez-Burgos, Herrera, Adams, Correa, Currano, Erickson, Hinojosa, Hoganson, Iglesias, Jaramillo, Johnson, Jordan, Kraft, Lovelock, Lusk, Niinemets, Peñuelas, Rapson, Wing and Wright2011]). However, as discussed earlier the DiLP MAP estimates are probably too low, and when the average leaf size from LAA is used in DiLP, the MAP estimates for the SJB are >25 cm wetter than those for the WB. The MAP estimates using LAA and DiLP for the SJB and WB overlap within uncertainty, suggesting that both are reasonable approximations of MAP.
Discussion
San Juan Basin Flora
San Juan Basin Floral Composition
The early Paleocene SJB flora is dominated by dicot angiosperms, which account for 66.04% of morphotypes and 86.19% of specimens collected during censuses (Table 1), similar to observed patterns in early Paleocene floras from across North America (e.g., Brown Reference Brown1962; Barclay et al. Reference Barclay, Johnson, Betterton and Dilcher2003; Dunn Reference Dunn2003; Wilf and Johnson Reference Wilf and Johnson2004; Peppe Reference Peppe2010). The majority of dicot angiosperm leaves were interpreted to be woody plants (i.e., trees or shrubs; 94.24%) consistent with modern taphonomic studies (Ellis and Johnson Reference Ellis and Johnson2013). Interestingly, pteridophytes are relatively common (9.09% of morphotypes and 4.86% of specimens; Table 1) and conifers are relatively rare (3.64% of morphotypes and 3.26% of specimens; Table 1), which is a different pattern than observed in contemporaneous floras from the NGP (i.e., Barclay et al. Reference Barclay, Johnson, Betterton and Dilcher2003; Wilf and Johnson Reference Wilf and Johnson2004; Peppe Reference Peppe2010; Table 1).
Landscape Floral Heterogeneity
There is significant facies effect on the Ojo Alamo floral composition and diversity (Figs. 3 and 4, Tables 2 and 3). Our interpretation for the depositional facies (pond vs. overbank) is based on the sedimentological features of the sites (Supplementary Fig. 1) and is qualitatively supported by the floral composition of each facies. For example, the pond flora is more strongly dominated by non-angiosperm morphotypes than the overbank facies. The modern nearest living relatives of the majority of these non-angiosperm morphotypes, such as the ferns Onoclea sensibilis (SJ-56) and the cupressaceous conifer Cupressinocladus interruptus (SJ-68), are commonly found in water-saturated environments such as ponds and/or swamps (e.g., Mehltreter et al. Reference Mehltreter, Walker and Sharpe2010; Pittermann et al. Reference Pittermann, Stuart, Dawson and Moreau2012). In comparison, the overbank facies is more strongly dominated by dicot angiosperms and the modern relatives of common overbank morphotypes such as Platanites marginata (SJ-71) and Browneia serrata (SJ-78) that commonly inhabit disturbed lake and streamside environments (Stromberg Reference Stromberg2001; Manchester and Hickey Reference Manchester and Hickey2007), as would be expected in downstream and lateral bar forms in a braided stream.
The strong facies effect on diversity could be explained by taphonomic differences between the facies or lateral heterogeneity in the floral communities between the environments. If taphonomy caused the observed facies effect, we would expect the overbank facies to have higher species richness than the pond facies due to a larger catchment area “collecting” multiple depositional environments (Ellis and Johnson Reference Ellis and Johnson2013). Additionally, we would expect that because the overbank facies incorporated morphotypes from other facies, paleoclimate estimates between facies might differ due to the incorporation of allochthonous morphotypes. However, while the overbank facies did have higher species richness than the pond facies (Table 2), the two facies shared relatively few morphotypes. Only 12 morphotypes (22.64%) are found in both the pond and overbank facies, and the majority of the shared morphotypes, such as Platanites raynoldsii (SJ-36) and Averrhoites affinis (SJ-46), occur at the majority of SJB sites and also have widespread distributions throughout the Western Interior of North America during the early Paleocene (e.g., Johnson Reference Johnson2002; Barclay et al. Reference Barclay, Johnson, Betterton and Dilcher2003; Dunn Reference Dunn2003; Peppe Reference Peppe2010). Conversely, most facies-restricted morphotypes have only been identified in the SJB. Further, while the pond floras are relatively homogeneous, there is a large difference in species composition between the overbank sites, indicating a considerable variability in floral composition within the higher-disturbance overbank facies (Figs. 3A,B and 4). Within groups, the overbank localities were more dissimilar to each other than the pond localities (Table 3), which suggests considerable variability in the floral composition between overbank facies localities and between the pond and overbank facies. Conversely, two pond localities that were collected along a transect from the same carbonaceous shale deposits and are separated by the shortest geographical distance (AF1407 and AF1407B; Fig. 1C) have a relatively low Bray-Curtis similarity (0.316; Table 3), indicating the occurrence of spatial heterogeneity within the plant community even within the facies that is more likely to preserve relatively autochthonous flora. Anecdotally, the overbank deposits preserve many complete compound leaves of P. raynoldsii (SJ-36) and P. marginata (SJ-71), as well as many relatively complete branches of C. interruptus (SJ-68), which are delicate and are unlikely to have been preserved over long transport distances, suggesting the overbank deposits primarily sampled an autochthonous or parautochthonous flora. Thus, there is no evidence to suggest that the overbank facies sampled taxa from the pond facies. Finally, DiLP paleoclimate estimates for the two facies were nearly identical, which suggests both facies were sampling relatively autochthonous or parautochthonous floras (Table 4). Based on the differences in floral composition between the pond and overbank facies, differences between floras collected from the overbank facies, and the similar paleoclimate estimates between facies, it is unlikely that the facies effect that we document is the result of differences in taphonomy between the overbank and pond facies.
Instead, we interpret the facies effect to be the result of landscape heterogeneity in the Ojo Alamo Sandstone plant communities. This strong facies effect, in which the overbank floras have higher species richness and diversity than the pond floras, is best explained by the intermediate disturbance hypothesis, which predicts the highest species diversity occurs in areas of intermediate disturbance (Connell Reference Connell1978). In tropical forest communities, disturbance creates holes in the canopy that allow a succession of plant species to colonize the newly available growing area, leading to greater species richness (e.g., Brokaw and Busing Reference Brokaw and Busing2000; Molino Reference Molino2001). The overbank flora was deposited in more active parts of the depositional system, and thus underwent more disturbance, which in turn likely resulted in greater floral diversity. The overbank facies had clear evidence of repeated depositional events, likely from flooding and high water (Supplementary Fig. 1), which would have regularly disturbed the landscape and likely killed some of the standing vegetation. The modern relatives of common SJB overbank flora species (e.g., P. raynoldsii, SJ-36) are commonly pioneer species (Stromberg Reference Stromberg2001), supporting our hypothesis that episodic disturbance in these localities created canopy breaks that allowed colonization by pioneer species. In comparison, the lower-diversity pond flora was deposited in a restricted and less active area of the depositional system that encountered relatively little disturbance, which may have allowed a few species (i.e., A. affinis, SJ-46) to become dominant. The effect of disturbance on diversity is also highlighted by the pond flora being significantly less even and more dominated by a single morphotype when compared with the overbank flora (Table 2). These results indicate considerable landscape heterogeneity in the SJB flora and suggest that if a larger spatial area was collected, the species richness and diversity would likely increase.
Paleoclimate and Paleoecology
The Ojo Alamo Sandstone has been interpreted to represent a braided stream system on an alluvial plain subject to seasonal precipitation (Powell Reference Powell and Fassett1973; Fassett Reference Fassett, Flores and Kaplan1985; Sikkink Reference Sikkink1987). Our MAT and MAP estimates indicate that the climate of the SJB flora is most similar to a tropical seasonal forest biome (Fig. 8), which is typified by environments with a pronounced dry season (Whittaker Reference Whittaker1975), supporting the interpretation of seasonal precipitation. The M a estimates for the Ojo Alamo Sandstone flora also suggest seasonal precipitation. Deciduous taxa are commonly found in disturbed environments and in environments with marked differences between seasons in rainfall and/or temperature (e.g., Whittaker Reference Whittaker1975; Reich et al. Reference Reich, Walters and Ellsworth1992; Lavorel et al. Reference Lavorel, McIntyre, Landsberg and Forbes1997; Yoshifuji et al. Reference Yoshifuji, Kumagai, Tanaka, Tanaka, Komatsu, Suzuki and Tantasirin2006; Poorter et al. Reference Poorter, Niinemets, Poorter, Wright and Villar2009). Further, in tropical forest ecosystems, the degree of deciduousness in plant communities is controlled by the amount of precipitation and the length and magnitude of the dry season (Condit et al. Reference Condit, Watts, Bohlman, Pérez, Foster and Hubbell2000; Pyke et al. Reference Pyke, Condit, Aguilar and Lao2001), and modern tropical forests dominated by deciduous species are marked by a long dry season with little to no precipitation and a short but intense wet season (Bullock and Solis-Magallanes Reference Bullock and Solis-Magallanes1990). The distributions of M a for the Ojo Alamo flora indicate that it sampled a riparian temperate rain forest/tropical seasonal forest (Figs. 5 and 8), which also suggests that precipitation during the deposition of the Ojo Alamo Sandstone was seasonal with a pronounced dry season. This interpretation is further supported by fossil wood anatomy from the early Paleocene SJB that exhibited variations in vessel density and diameter that may correspond with seasonal variations in precipitation (Wheeler et al. Reference Wheeler, McClammer and LaPasha1995). Taken together, the sedimentological and paleontological evidence from the Ojo Alamo indicates that it was deposited in a tropical seasonal forest biome with a considerable dry season.
Regional Patterns of Vegetation and Paleoclimate
Regional Patterns in Floral Composition
Previous research on early Paleocene floras from North America has suggested that they are relatively similar across the continent (e.g., Brown Reference Brown1962; Johnson Reference Johnson2002; Johnson et al. Reference Johnson, Reynolds, Werth and Thomasson2003; Barclay et al. Reference Barclay, Johnson, Betterton and Dilcher2003; Peppe Reference Peppe2010) and are dominated by diagnostic “FU1 taxa” (sensu Johnson and Hickey Reference Johnson and Hickey1990; Johnson Reference Johnson2002). In the SJB, the FU1 taxa P. raynoldsii, B. serrata (SJ-78), “Populus” nebrascensis (SJ-13), and Paranymphaea crassfolia (SJ-51) are present. However, the majority of FU1 taxa, such as the dicot angiosperms Quereuxia angulata, Mciveraephyllum nebrascense, and Zizophoides flabella and the taxodiaceous conifers Glyptostrobus europaeus and Metasequoia occidentalis, are absent. Further, with the exception of P. raynoldsii (SJ-36), the FU1 taxa present in the SJB are very rare, while accessory taxa from the NGP, such as A. affinis (SJ-46) and Ditaxocladus catenulatus (SJ-102), are common in the SJB. Further, Gingko adiantoides, which is also common in the NGP (Johnson Reference Johnson2002; Peppe Reference Peppe2010) is notably absent from the SJB flora. The SJB was likely too warm for G. adiantoides and the taxodiaceous conifers M. occidentalis and G. europaeus, as their nearest living relatives are primarily restricted to temperate climates in latitudes above ~35°N (e.g., Tralau Reference Tralau1967; Ziegler et al. Reference Ziegler, Rees, Rowley, Bekker, Qing, Hulver, Yin and Harrison1996; Liu et al. Reference Liu, Arens and Li2007).
Though markedly different, the floral composition and relative abundance of morphotypes between the SJB and contemporaneous localities in the NGP have some similarities. For example, the most common SJB morphotype (A. affinis, SJ-46) is relatively uncommon or absent in floras from North Dakota and Montana (Johnson Reference Johnson2002; Peppe Reference Peppe2010), but is a common morphotype in the West Bijou Site from the DB (Barclay et al. Reference Barclay, Johnson, Betterton and Dilcher2003). Additionally, the most common morphotype found by Johnson (Reference Johnson2002) in the WB flora was P. raynoldsii (SJ-36), which is a common morphotype from the SJB, but relatively rare in the DB (Barclay et al. Reference Barclay, Johnson, Betterton and Dilcher2003). Conversely, the most abundant morphotype in the DB (M. nebrascense; Barclay et al. Reference Barclay, Johnson, Betterton and Dilcher2003) is also common in the WB (Peppe Reference Peppe2010), but absent in the SJB. This suggests some plant species had extensive ranges during the early Paleocene, while others, such as the most common constituents of the FU1 flora from the NGP, were restricted to more northern latitudes.
The greater diversity and abundance of pteridophyte morphotypes in the SJB were likely linked to the warmer and wetter climate compared to contemporaneous localities and the transition from temperate to tropical forests (Figs. 6B–D and 8, Table 5) (Barclay et al. Reference Barclay, Johnson, Betterton and Dilcher2003; Wilf and Johnson Reference Wilf and Johnson2004; Peppe Reference Peppe2010). This suggests a latitudinal difference in pteridophyte diversity and abundance across North America in the early Paleocene. The greater abundance and diversity of pteridophytes may have been driven by higher rate of speciation in tropical ecosystems compared with temperate forests, a pattern that has been well documented in modern fern communities (Haufler et al. Reference Haufler, Hooper and Therrien2000). Additionally, the climate of the SJB was likely better suited to pteridophytes than the climate of the more northern basins (Mehltreter et al. Reference Mehltreter, Walker and Sharpe2010; Table 5). There is evidence that the SJB, in addition to being warmer and wetter than other basins, experienced seasonal precipitation (e.g., Wheeler et al. Reference Wheeler, McClammer and LaPasha1995; Davis et al. Reference Davis, Peppe, Atchley, Williamson and Flynn2016). The modern relatives of the most common pteridophyte morphotype found in the SJB (SJ-57, cf. Anemia) are drought tolerant and are often found in seasonally dry and warm habitats (Tryon and Tryon Reference Tryon and Tryon1982) similar to those predicted for the SJB based on the paleoclimate estimates. Additionally, fossil relatives of SJ-57 (cf. Anemia) from the Lower Cretaceous Crato Formation in Brazil have been interpreted to be ground cover in dry, sunny areas with adaptations to survive drought stress (Mohr et al. Reference Mohr, Bernardes-de-Oliveira, Loveridge, Pons, Sucerquia and Castro-Fernandes2015). Taken together, the lack of many diagnostic FU1 flora species and the relatively high abundance of pteridophytes in the SJB flora suggest significant latitudinal variation in floral composition across western North America immediately following the K/Pg boundary.
Palynological work from the latest Cretaceous and earliest Paleocene (e.g., Frederiksen Reference Frederiksen1987; Nichols et al. Reference Nichols, Fleming, Frederiksen, Kauffman and Walliser1990) also supports this latitudinal compositional gradient found in the megaflora. Frederiksen (Reference Frederiksen1987) found different palynological floral provinces during the latest Cretaceous along the continental margin and the Western Interior. Interestingly, he found that the SJB palynological assemblage shared a higher percentage of palynomorphs with the continental margin than with other localities in the continental interior, suggesting that the SJB was composed of a different floral assemblage than other Western Interior basins. Using palynological collections from the earliest Paleocene, Nichols et al. (Reference Nichols, Fleming, Frederiksen, Kauffman and Walliser1990) found three pollen-based floral clusters that roughly correspond to the southern, mid-, and high latitudes of North America. The southern group, including the SJB and DB, had greater species richness and greater endemism than the mid- and northern groups, which include the WB (Nichols et al. Reference Nichols, Fleming, Frederiksen, Kauffman and Walliser1990). A “southern” floristic province is also supported by fossil wood collections from Mexico, Texas, and New Mexico, which suggest that the vegetation across these areas was similar from the Campanian through the Paleocene (e.g., Wheeler et al. Reference Wheeler, McClammer and LaPasha1995; Lehman and Wheeler Reference Lehman and Wheeler2009). When combined, our megafloral analyses and the palynology and fossil wood record from the Late Cretaceous and early Paleocene all suggest latitudinal variation in floral compositions across North America and a marked difference in the SJB flora compared with floras in of the NGP of North America in the early Paleocene, and also possibly in the Late Cretaceous.
Regional Patterns of Floral Diversity
The species richness of the SJB flora is 10–55% higher than those of contemporaneous floras from North America (Supplementary Table 7). The SJB flora also has ~15–20% higher rarefied richness at the site level and ~35–40% higher rarefied richness at the basin-wide level (Table 5). The increased relative difference in rarefied richness at the basin-wide level is driven by the predominance of non-dicot angiosperm taxa and the large amount of lateral heterogeneity in the SJB (Fig. 6B–D, Supplementary Table 7). However, while the SJB flora was more species rich, it was significantly less even and more strongly dominated by common morphotypes than contemporaneous NGP floras (Fig. 7B,C, Supplementary Table 7). While the most common taxa make up between 21.54 and 33.19% of samples from the DB and WB, the most common taxa make up 62.67% of samples collected in the SJB (Table 5). The high richness but uneven flora runs counter to the hypothesis that the earliest Paleocene floras had low species richness and were relatively even (e.g., Hickey Reference Hickey1980; Johnson and Ellis Reference Johnson and Ellis2002; Barclay et al. Reference Barclay, Johnson, Betterton and Dilcher2003; Wilf and Johnson Reference Wilf and Johnson2004). This suggests notably different patterns in floral diversity across North America after the K/Pg extinction event, with the floras from the NGP being relatively even and homogeneous on the landscape, but low in species richness, while the floras from the SJB, and potentially other areas in southern North America, were uneven but species rich and very heterogeneous. These differences may have been driven by climate in the earliest Paleocene, in which the warm temperatures in southern North America allowed more rapid speciation following the K/Pg extinction event. Additionally, the latitudinal gradient in floral species richness in the early Paleocene documented here is consistent with a relatively steep mammalian latitudinal diversity gradient in the early Paleocene (Marcot et al. Reference Marcot, Fox and Niebuhr2016), suggesting that they may be related.
Interestingly, early Paleocene fossil floras from Patagonia (Iglesias et al. Reference Iglesias, Wilf, Johnson, Zamuner, Cúneo, Matheos and Singer2007; Comer et al. Reference Comer, Slingerland, Krause, Iglesias, Clyde, Raigemborn and Wilf2015) had species richness similar to the SJB floras (rarefied richness using only dicot angiosperm leaves downsampled to 2000 specimens: SJB = 28.28 ± 1.18 morphotypes; Salamanca Flora = 32.47 ± 0.67 morphotypes). The high species richness in Patagonia has been linked to lower rates of extinction than in North America and dispersal of refugia taxa following the K/Pg boundary (Donovan et al. Reference Donovan, Iglesias, Wilf, Labandeira and Cúneo2016). Similar to the SJB flora, the early Paleocene megaflora from the Salamanca Formation in Argentina (64.67–63.49 Ma) had >50% more species than comparable North American localities (Iglesias et al. Reference Iglesias, Wilf, Johnson, Zamuner, Cúneo, Matheos and Singer2007). This suggests that the pattern in macrofloral diversity found in the SJB could be more similar to South American floras than to floras from the NGP in North America, but further work will need to be done to test this hypothesis.
Regional Patterns of Paleoclimate and Paleoecology
Paleoclimate estimates for the SJB, DB, and WB indicate that climate in the SJB was markedly warmer and somewhat wetter than contemporaneous basins in western North America (Table 5, Fig. 8). MAT in the SJB is reconstructed to be >6°C warmer than in the DB and >11°C warmer than in the WB (Table 5, Fig. 8), and the paleolatitudes of the SJB, DB, and WB were ~42°N, ~44°N, and ~51°N, respectively (reconstructed based on Torsvik et al. [Reference Torsvik, Müller, Van der Voo, Steinberger and Gaina2008]). This difference in MAT and the latitudinal differences between the sites implies that continental latitudinal temperature gradients across the Western Interior of North America were at least as steep in the early Paleocene as in the modern (e.g., North et al. Reference North, Cahalan and Coakly1981). Further, when compared with modern biomes (Whittaker Reference Whittaker1975), the DB and WB climate estimates indicate a temperate deciduous forest biome, while the SJB is reconstructed as a tropical seasonal forest (Fig. 8). Today, tropical seasonal forests are primarily restricted to north and south latitudes <30° (Murphy and Lugo Reference Murphy and Lugo1986; Mooney et al. Reference Mooney, Bullock, Medina, Bullock, Mooney and Medina1995; Dupuy et al. Reference Dupuy, Maitre and Amsallem1999). Thus, the climate and ecosystem reconstructions for the SJB, DB, and WB indicate greater latitudinal expansion of tropical biomes and the transition between tropical and temperate forests in the earliest Paleocene compared with the present.
In modern ecosystems, there is a strong latitudinal diversity gradient, and tropical forests have higher α- and β-diversity than temperate forests (e.g., Givnish Reference Givnish1999; Phillips and Miller Reference Phillips and Miller2002; Leigh et al. Reference Leigh, Davidar, Dick, Puyravaud, Terborgh, ter Steege and Wright2004; Kraft et al. Reference Kraft, Comita, Chase, Sanders, Swenson, Crist, Stegen, Vellend, Boyle and Anderson2011; Brown Reference Brown2014). In our comparison between contemporaneous floras across North America, we document a similar pattern of increasing species richness with decreasing latitude (Figs. 6 and 7, Supplementary Table 7). This demonstrates that in the earliest Paleocene, there was a strong latitudinal diversity gradient, suggesting that it was either maintained across the K/Pg boundary or that it was rapidly reestablished within the first ~350 kyr of the earliest Paleocene. Our results, which document considerable differences in climate and species richness between the SJB, DB, and WB, support the concept that the latitudinal diversity gradient is linked to climate and has been through much of Earth's history (e.g., see review by Brown [Reference Brown2014]). Thus, we hypothesize that the differences in floral diversity and composition across North America in the earliest Paleocene were driven by differences in climate that caused the latitudinal transition from temperate forests in the NGP to paratropical forests in the SJB.
Conclusion
The Ojo Alamo Sandstone preserves a species-rich, heterogeneous, and uneven megaflora in the SJB deposited within 350 kyr of the Cretaceous/Paleogene boundary. The SJB flora is dominated by dicot angiosperms with pteridophytes, conifers, and monocot angiosperms as common accessory taxa. There is a strong facies effect on floral diversity and composition in the SJB: (1) an overbank flora found on riparian margins has higher species richness, is more even, and appears to have been dominated by fast-growing pioneer dicot angiosperms species and (2) a pond flora found in swamps or low-lying areas has lower species richness and is less even, and non-dicot angiosperm morphotypes appear to have been more common within this flora. The majority of morphotypes found in the SJB flora have not been previously described, suggesting that a large proportion of species may be endemic to the SJB. Paleoclimate estimates from the SJB indicate a very warm and wet climate consistent with a modern tropical seasonal forest biome.
When compared with contemporaneous floras from North America, the SJB flora has ~10–55% greater species richness, but is significantly less even. While taxa common in the NGP are present in the SJB flora, only P. raynoldsii is common, whereas accessory taxa in the NGP are important parts of the SJB flora. The SJB had a greater proportion and abundance of pteridophyte morphotypes than contemporaneous collections, likely linked the warm and wet climate. The pattern of laterally heterogeneous, species-rich, but uneven flora found in the SJB runs is different than the pattern found in the NGP (e.g., Johnson and Hickey Reference Johnson and Hickey1990; Johnson Reference Johnson2002; Peppe Reference Peppe2010), but potentially more similar to floras from the front range of the Rocky Mountains in Colorado (Johnson and Ellis Reference Johnson and Ellis2002; Johnson et al. Reference Johnson, Reynolds, Werth and Thomasson2003). Additionally, the SJB paleoclimate estimates indicate a warmer and wetter environment than previously studied localities farther north (Barclay et al. Reference Barclay, Johnson, Betterton and Dilcher2003; Peppe Reference Peppe2010). Taken together, these results demonstrate that the early Paleocene flora in the SJB is markedly different from floras in the NGP and that there were significant differences in species composition and diversity along a north–south gradient in North America in the earliest Paleocene. The latitudinal differences in megaflora observed in this study are similar to those found in the microflora (i.e., Fredericksen Reference Frederiksen1987; Nichols et al. Reference Nichols, Fleming, Frederiksen, Kauffman and Walliser1990) and fossil wood (Lehman and Wheeler Reference Lehman and Wheeler2009). We hypothesize that the warm, wet conditions in the SJB drove rapid rates of speciation following the K/Pg boundary, resulting in a heterogeneous, endemic flora in the earliest Paleocene. These results indicate that the floral response to the K/Pg boundary likely varied regionally across North America and was influenced by latitudinal differences in paleoclimate and paleoecology.
Acknowledgments
This work was supported by the National Science Foundation (EAR-132552), the American Chemical Society Petroleum Research Fund (PRF#52822-DN18), the Geological Society of America, Dallas Paleontological Society, and Baylor University Department of Geosciences’ Dixon Fund. We thank T. Williamson for significant logistical support for this research project; B. Abbuhl, P. Wright, J. Milligan, R. Secord, S. Brusatte, U. Denenclaw, C. Leslie, A. Davis, S. Atchley, A. Baumgartner, and A. Weil for assistance in the field and lab; and R. Dunn, S. Manchester, and E. Currano for their assistance identifying morphotypes. We would also like to thank S. Atchley, S. Dworkin, B. Hockaday, and J. White, two anonymous reviewers, associate editor K. Boyce, and editor C. Jaramillo for their helpful comments on previous versions of this article.


