


Introduction
The bone histology of non-archosaurian archosauromorphs has received great attention in the last decade (Ricqlès et al. Reference Ricqlès, Padian, Knoll and Horner2008; Nesbitt et al. Reference Nesbitt, Stocker, Small and Downs2009; Botha-Brink and Smith Reference Botha-Brink and Smith2011; Werning and Irmis Reference Werning and Irmis2011; Legendre et al. Reference Legendre, Segalen and Cubo2013, Reference Legendre, Guenard, Botha-Brink and Cubo2016; Ezcurra et al. Reference Ezcurra, Scheyer and Butler2014; Mukherjee Reference Mukherjee2015; Veiga et al. Reference Veiga, Soares and Sayao2015; Werning and Nesbitt Reference Werning and Nesbitt2016; Jaquier and Scheyer Reference Jaquier and Scheyer2017). Ricqlès et al. (Reference Ricqlès, Padian, Knoll and Horner2008) suggested that the capacity of reaching and maintaining very high bone growth rates is an apomorphic feature of archosauriforms. Botha-Brink and Smith (Reference Botha-Brink and Smith2011) showed that this capacity may have been acquired in a more inclusive node, by the last common ancestor of the clade Prolacerta–archosaurifoms, with a reversion in Vancleavea (see also Nesbitt et al. Reference Nesbitt, Stocker, Small and Downs2009). Padian and Horner (Reference Padian and Horner2002) hypothesized that “the types of tissue deposited in the bones of extinct animals are the most direct evidence of basal metabolic rates, because they directly reflect growth rates […]. The sustained deposition of fast-growing bone tissues, as displayed by mammals, birds and other dinosaurs, must reflect sustained high basal metabolic rates” (p. 123). Montes et al. (Reference Montes, Le Roy, Perret, De Buffrenil, Castanet and Cubo2007) provided evidence for this hypothesis by showing that the variation of bone growth rates significantly explains the variation of resting metabolic rates in a sample of extant amniotes. They argued that this is due to the fact that high rates of protein synthesis and degradation involved in the periosteal osteogenesis and endosteal osteolysis are energy consuming (Montes et al. Reference Montes, Le Roy, Perret, De Buffrenil, Castanet and Cubo2007). Consistently, Legendre et al. (Reference Legendre, Guenard, Botha-Brink and Cubo2016) inferred resting metabolic rates of a sample of Archosauromorpha using quantitative bone histology and phylogenetic eigenvector maps. Interestingly, they inferred a resting metabolic rate of Prolacerta included within the range of variation of extant mammals (Legendre et al. Reference Legendre, Guenard, Botha-Brink and Cubo2016). Resting metabolic rate depends on bone growth rate (as noted earlier), but it depends also on the presence of thermogenetic mechanisms. We define endothermy as the presence of any mechanism of nonshivering thermogenesis (e.g., Lowell and Spiegelman Reference Lowell and Spiegelman2000; Rowland et al. Reference Rowland, Bal and Periasamy2015; Nowack et al. Reference Nowack, Giroud, Arnold and Ruf2017) that increases both body temperature and resting metabolic rate. Thus, the resting metabolic rate of an extinct organism may be a good proxy to infer its thermometabolic regime (endothermy vs. ectothermy). Using this proxy, the results obtained by Legendre et al. (Reference Legendre, Guenard, Botha-Brink and Cubo2016) suggest that endothermy may have been acquired by the last common ancestor of the clade Prolacerta–archosauriforms. The next step to better constrain the phylogenetic frame of the acquisition of endothermy by Archosauromorpha involves inferring the resting metabolic rate of Allokotosauria, the sister-group of the clade Prolacerta–archosauriforms (Nesbitt et al. Reference Nesbitt, Flynn, Pritchard, Parrish, Ranivoharimanana and Wyss2015; see also Ezcurra Reference Ezcurra2016). Therefore, we analyzed the bone histology and inferred the resting metabolic rates of Azendohsaurus laaroussii (Archosauromorpha: Allokotosauria; Nesbitt et al. Reference Nesbitt, Flynn, Pritchard, Parrish, Ranivoharimanana and Wyss2015; Ezcurra Reference Ezcurra2016) using phylogenetic eigenvector maps.
Materials and Methods
Materials
We histologically analyzed skeletal remains from the non-archosauriform archosauromorph A. laaroussii from the Upper Triassic (Carnian) of the Argana Basin (Morocco) deposited at the Muséum National d'Histoire Naturelle (MNHN). Azendohsaurus laaroussii Dutuit, Reference Dutuit1972 was originally described on the basis of a dental fragment and two isolated teeth specialized for plant feeding (Dutuit Reference Dutuit1972). On the basis on comparison with ornithischian dinosaurs such as Fabrosaurus and Scelidosaurus, it was attributed to a new ornithischian dinosaur, making it one of the earliest dinosaurs to be identified (Dutuit Reference Dutuit1972; Thulborn Reference Thulborn1973, Reference Thulborn1974; Bonaparte Reference Bonaparte1976; Galton Reference Galton1985, Reference Galton, Weishampel, Dodson and Osmólska1990; Weishampel Reference Weishampel, Weishampel, Dodson and Osmólska1990; Gauffre Reference Gauffre1993; Hunt and Lucas Reference Hunt, Lucas, Fraser and Sues1994; Flynn et al. Reference Flynn, Parrish, Rakotosamimanana, Simpson, Whatley and Wyss1999). In addition to the craniodental remains, hundreds of disarticulated and monospecific postcranial remains have been recovered from the locus typicus of A. laaroussii (Dutuit Reference Dutuit1976). The analysis of these specimens argues strongly against a phylogenetic position inside Dinosauria (Jalil and Knoll Reference Jalil and Knoll2002). Flynn et al. (Reference Flynn, Nesbitt, Parrish, Ranivoharimana and Wyss2010) named the new species Azendohsaurus madagaskarensis from the Triassic of Madagascar and provided for the first time a comprehensive description of the cranial anatomy of the genus. More recently, Nesbitt et al. (Reference Nesbitt, Flynn, Pritchard, Parrish, Ranivoharimanana and Wyss2015) provided an extensive description the postcranial anatomy of A. madagaskarensis, which is now one of the best-known early archosauromorphs.
All the available postcranial material in the MNHN collection attributed to A. laaroussii is monotypic (Khaldoun Reference Khaldoun2014). It was collected from the locus typicus of A. laaroussii during the same initial field season (Dutuit Reference Dutuit1976) and strongly resembles the postcranial skeleton of A. madagaskarensis (Fig. 1). This material can be confidently attributed to A. laaroussii. Among the diagnostic postcranial characters of the Malagasy form, only two can be checked on the available material of A. laaroussii, and both are present: a posteriorly expanded T-shaped interclavicle and hyposphene-hypantra intervertebral articulations in anterior trunk vertebrae. This later character state was considered autapomorphic for A. madagaskarensis by Nesbitt et al. (Reference Nesbitt, Flynn, Pritchard, Parrish, Ranivoharimanana and Wyss2015), but it may be a synapomorphy for the genus Azendohsaurus. The proportions of the studied skeletal elements MNHN.F.ALM 435 (right humerus), MNHN.F.ALM 497 (left femur), and MNHN.F.ALM 369 (right tibia) show that they are from different specimens.

Figure 1. Azendohsaurus laaroussii Dutuit, Reference Dutuit1972 (Argana Basin, Irohalène Member, Carnian): A, B, MNHN.F.ALM 586 left humerus (A) and mold of MNHN.F.ALM 435 right humerus (B) in dorsal (dor), ventral (ven), anterior (ant), proximal (pro), and distal (dis) views; C, D, MNHN.F. ALM 498 and 502, two ends of the same left femur glued (C) and mold of MNHN.F.ALM 497 left femur (D) in ventral, dorsal, and posterior (pos) views; E, F, MNHN.F.ALM 398 right tibia (E) and MNHN.F.ALM 369 mold of right tibia (F) in medial (med) and lateral (lat) views. The arrowheads show the level of the thin sections. Other abbreviations: a.fi, articulation for fibula; cap, capittellum; dp, deltopectoral crest; ect, ectepicondyle; gr, groove; int, internal trochanter; tro, trochlea.
Histological Methods
Skeletal elements were molded and cast before sectioning to preserve morphological information. Casts and bone remains after histological sampling were reposited at the paleontology collection of the MNHN, where they are available upon a request to the curator. Mid-diaphyses were embedded in epoxy resin and processed histologically following standard procedures (Lamm Reference Lamm2013). Transverse sections as well as longitudinal sections (at the anterior, posterior, dorsal, and ventral sides for humerus and femur and at the anterior, posterior, medial, and lateral sides for the tibia) were obtained and mounted on glass slides. These were analyzed and photographed in a Nikon Eclipse E600POL microscope using normal light and cross-polarized light with a lambda compensator. Thin sections were reposited at the vertebrate hard tissues histological collection of the MNHN, where they are available upon request to the curator (thin sections MNHN-F-HISTOS 2348 to 2362).
Qualitative Histology
The nomenclature and classification of bone tissues is based on bone organization at different integration levels (Francillon-Vieillot et al. Reference Francillon-Vieillot, de Buffrénil, Castanet, Geraudie, Meunier, Sire, Zylberberg, de Ricqlès and Carter1990). At the level of bone matrix organization, three character states have been defined based on the organization of collagen fibers: the presence (or absence) of woven-fibered bone matrix (WB), parallel-fibered bone matrix (PFB), and lamellar bone matrix (LB). At the level of organization of bone as a tissue, two character states have been defined based on the organization of the collagen fibers, the vascular density, and the cyclicity of bone apposition: the presence of lamellar-zonal bone (LZB) and the presence of the fibrolamellar bone (FLB). See Francillon-Vieillot et al. (Reference Francillon-Vieillot, de Buffrénil, Castanet, Geraudie, Meunier, Sire, Zylberberg, de Ricqlès and Carter1990) for a detailed description of these character states. This pattern-oriented approach has been recently expanded toward a process-oriented view based on the developmental origin of the components of bone tissue (Prondvai et al. Reference Prondvai, Stein, de Ricqles and Cubo2014). In process-oriented paleohistology, the developmental mechanisms involved in the formation of bone tissue are inferred from the fine architecture of the bone matrix. PFB and LB are formed by the process of dynamic osteogenesis, whereas WB is formed by the process of static osteogenesis (Ferretti et al. Reference Ferretti, Palumbo, Contri and Marotti2002; Palumbo et al. Reference Palumbo, Ferretti and Marotti2004; Marotti Reference Marotti2010; Prondvai et al. Reference Prondvai, Stein, de Ricqles and Cubo2014; Stein and Prondvai Reference Stein and Prondvai2014; Cubo et al. Reference Cubo, Hui, Clarac and Quilhac2017). Cortices can also have a composite nature, including (1) a scaffold of WB formed by the process of static osteogenesis and (2) centripetal layers infilling primary osteons made of PFB or LB formed by the process of dynamic osteogenesis. This last tissue type has been named “woven-parallel complex” by Prondvai et al. (Reference Prondvai, Stein, de Ricqles and Cubo2014). In the context of process-oriented paleohistology, the widely used term “FLB” is a special case of a woven-parallel complex in which there is abundant woven bone and dense vascularity in the form of primary osteons (Prondvai et al. Reference Prondvai, Stein, de Ricqles and Cubo2014).
Quantitative Histology
We quantified the vascular density (number of vascular canals by square millimeter) in four orthogonal transects of the transverse sections of humerus, femur, and tibia of A. laaroussii. We used the data set published by Legendre et al. (Reference Legendre, Guenard, Botha-Brink and Cubo2016) for comparative purposes. It contains the resting metabolic rates and the vascular densities of humerus, femur, and tibia of a sample of 13 extant species and 14 extinct species of tetrapods. Data for Mus musculus were removed, because this species was an outlier.
Phylogenetic Comparative Methods
We tested whether vascular density explains a significant fraction of the variation of resting metabolic rate using phylogenetic generalized least-squares regressions (PGLS; Grafen Reference Grafen1989), with the ‘caper’ package (Orme et al. Reference Orme, Freckleton, Thomas, Petzoldt, Fritz, Isaac and Pearse2013) in R (R Core Team 2016). For this, we used the data set and the phylogeny published by Legendre et al. (Reference Legendre, Guenard, Botha-Brink and Cubo2016).
Moreover, we inferred the resting metabolic rates of A. laaroussii and those for 14 species of extinct tetrapods using phylogenetic eigenvector maps (Guenard et al. Reference Guenard, Legendre and Peres-Neto2013) with the ‘MPSEM’ package (Guenard et al. Reference Guenard, Legendre and Peres-Neto2013) in R (R Core Team 2016). For this, we used our data from A. laaroussii and the data set and the phylogeny published by Legendre et al. (Reference Legendre, Guenard, Botha-Brink and Cubo2016).
Finally, we performed an optimization of the presence of fibrolamellar bone (using our data for A. laaroussii and published data for other Archosauromorpha) and an optimization of the presence of endothermy (using observed resting metabolic rates for extant species and inferred resting metabolic rates for extinct ones as a proxy for the thermometabolic regime) onto phylogenies of Archosauromorpha and Tetrapoda, respectively, using parsimony in Mesquite (Maddison and Maddison Reference Maddison and Maddison2015).
Results
Bone Histology of Azendohsaurus laaroussii
Supplementary Fig. 1 shows composite images of the entire diaphyseal cross sections of humerus, femur, and tibia. The medial region of the transverse section of the tibia is avascular (Fig. 2A). The bone matrix appears isotropic (red in online figure) under cross-polarized light with a lambda compensator (Fig. 2B) and black in cross-polarized light without a lambda compensator (not shown). This can be interpreted either as woven bone or as parallel-fibered bone with fibers perpendicular to the transverse plane of section (Stein and Prondvai Reference Stein and Prondvai2014). The longitudinal section of the same (medial) region is also avascular (Fig. 2C). In the longitudinal section, the bone matrix appears anisotropic (blue in online figure, but it can be yellow depending on the orientation to the polarizers) under cross-polarized light with a lambda compensator (Fig. 2D). These complementary patterns of interference suggest that the cortex is composed of parallel-fibered bone, with collagen fibers running parallel to the longitudinal axis of the tibia. Osteocyte lacunae have a rounded aspect in the transverse section (Fig. 2A,B) and an elongate spindle shape in the longitudinal section (Fig. 2C,D). Their main axis is thus aligned with the collagen fibers of the surrounding matrix, whereas the canaliculi are perpendicular (Fig. 2C,D). We can observe erosion cavities lined by a coating of endosteal lamellar tissue around the medullary cavity (Fig. 2A,B).

Figure 2. Transverse (A, B, E, F) and longitudinal (C, D, G, H) sections of the medial (A–D) and posterior (E–H) regions of the right tibia MNHN.F.ALM 369 of Azendohsaurus laaroussii under normal light (A, C, E, G) and cross-polarized light with lambda compensator (B, D, F, H). Periosteum is on the left. Arrows, primary osteons; arrowheads, erosion cavities lined along its periphery by a coating of endosteal lamellar tissue. Scale bars, 300 µm.
The posterior region of the transverse section of the tibia is well vascularized (Fig. 2E). Vascular density is higher in the deep cortex than in the outer cortex. Vascular canals are longitudinal: they are rounded in transverse section (Fig. 2E,F) and elongated (with the main axis parallel to the main axis of the tibia) in the longitudinal section (Fig. 2G,H). The scarce vascular canals of the outer cortex are simple primary canals, whereas those of the deep cortex form small primary osteons (Fig. 2F). An avascular outer circumferential layer is absent. The bone matrix is isotropic (it appears red in online figure) under cross-polarized light with a lambda compensator in the transverse section (Fig. 2F) and anisotropic (blue in online figure) in the longitudinal section (Fig. 2H). This pattern suggests that bone matrix in the posterior region of the tibia is composed of parallel-fibered bone, with collagen fibers running parallel to the longitudinal axis of the tibia. Osteocyte lacunae have a rounded aspect in the transverse section (Fig. 2E,F) and an elongate spindle shape in the longitudinal section (Fig. 2G,H). The anterior and the lateral regions of the tibia are similar to the posterior region in all respects but one: the lateral region contains a line of arrested growth split into two lines.
The stylopodial bones (femur and humerus) show a well-developed vascularization in the deep cortex, mainly formed by vascular canals parallel to the bone periphery (circular canals) connected through abundant radial anastomoses (Fig. 3A–D). This pattern of vascular orientation is more regular in the femur (Fig. 3A,B) than in the humerus (Fig. 3C,D), but vascular density decreases from the inner to the outer cortex in both cases. The bone matrix is made of either a scaffold of woven bone containing primary osteons (fibrolamellar bone; e.g., Fig. 3E,F) or a scaffold of parallel-fibered bone containing both simple vascular canals and primary osteons (e.g., Fig. 3G,H). We can observe the anisotropic (blue in online figure) aspect of the scaffold of bone matrix in a longitudinal section of the humerus under polarized light, suggesting that it is made of parallel-fibered bone with collagen fibers oriented parallel to the main axis of the bone (Fig. 3H). Please note that the matrix around vascular canals appears isotropic (red in online figure) in this longitudinal section (Fig. 3H), whereas it appears anisotropoic (blue in online figure) in the transverse section (Fig. 3G), suggesting that it is made of parallel-fibered bone forming primary osteons with collagen fibers perpendicular to the main axis of the humerus. Avascular outer circumferential layers or lines of arrested growth are absent in both femur and humerus (Fig. 3A–D).

Figure 3. Transverse sections of the left femur MNHN.F.ALM 497 (A, anterior region; B, posterior region; E, F, posterodorsal region) and the right humerus MNHN.F.ALM 435 (C, anterior region; D, posterior region; G, posterior region with higher magnification) and a longitudinal section of the same humerus (H, posterior region) of Azendohsaurus laaroussii under normal light (A–E) and cross-polarized light with lambda compensator (F–H). Periosteum is on the left in A and C, on the right in B and D, and at the bottom in G. Endosteum is at the bottom in E, F, H. Arrow, primary osteon; arrowhead, woven bone. Scale bars, 1 mm (A–D); 300 µm (E–H).
In summary, vascular canals are more abundant in the deep cortex than in the outer cortex in all three bones, suggesting an ontogenetic decrease of bone growth rates (e.g., Fig. 2E). Considering that the avascular outer circumferential layer of parallel-fibered bone is absent (we observed vascular canals near the bone periphery in many regions; e.g., Fig. 2E) and that lines of arrested growth are absent in all analyzed regions but one (the lateral region of the tibia), we conclude that the analyzed specimens were subadults. The two lines of arrested growth observed in the lateral region of the tibia probably correspond to the split of a single line formed during bone cortical drift, because they are absent in the anterior, posterior, and medial sides of the same section.
Inferring the Resting Metabolic Rate of Azendohsaurus laaroussii
First, we tested whether vascular density explains a significant fraction of the variation of resting metabolic rate using the sample of extant tetrapods published by Legendre et al. (Reference Legendre, Guenard, Botha-Brink and Cubo2016). For this, we used phylogenetic generalized least-squares regressions (Grafen Reference Grafen1989). In all three cases (humerus, femur, and tibia), vascular density explained highly significant portions of the variation of resting metabolic rate (85%, 73.3%, and 78.9%, respectively). Thus, a priori we can confidently infer the resting metabolic rate of A. laaroussii using the vascular density values measured in the humerus, the femur, and the tibia (65.56, 34.83, and 47.19 vascular canals by square millimeter, respectively) and the comparative data published by Legendre et al. (Reference Legendre, Guenard, Botha-Brink and Cubo2016).
Phylogenetic eigenvector maps (Guenard et al. Reference Guenard, Legendre and Peres-Neto2013) includes an Akaike information criterion (AIC) procedure to select the explanatory variables (here, vascular density and/or the phylogeny) to be used to infer the response variable (here, the resting metabolic rate) of extinct taxa (here, A. laaroussii and the sample of extinct Archosauromorpha published by Legendre et al. [Reference Legendre, Guenard, Botha-Brink and Cubo2016]). According to the AIC procedure, the variable that maximizes the R 2 and minimizes the AIC value should be selected. In the case of the humerus, we obtained the same R 2 when using vascular density and the phylogeny and when using only the phylogeny, but the AIC value was lower when using both vascular density and the phylogeny (Fig. 4). We inferred a resting metabolic rate of 3.11 ml O2 h−1 g−0.67 and a confidence interval of 2.87–3.36 ml O2 h−1 g−0.67 for A. laaroussii using the phylogeny and vascular density of the humerus (Fig. 4). In the case of the femur, we found a slightly higher R 2 and a lower AIC value when using the phylogeny only (Fig. 5). We inferred a resting metabolic rate of 2.20 ml O2 h−1 g−0.67 and a confidence interval of 1.55–2.85 ml O2 h−1 g−0.67 for A. laaroussii using only the phylogeny (this is equivalent to an optimization; Fig. 5). Finally, in the case of the tibia, we obtained again the same R squared when using vascular density and the phylogeny and when using only the phylogeny, but the AIC value was lower when using both vascular density and the phylogeny (Fig. 6). We inferred a resting metabolic rate of 2.53 ml O2 h−1 g−0.67 and a confidence interval of 2.25–2.82 ml O2 h−1 g−0.67 for A. laaroussii using the phylogeny and the vascular density of the tibia (Fig. 6).
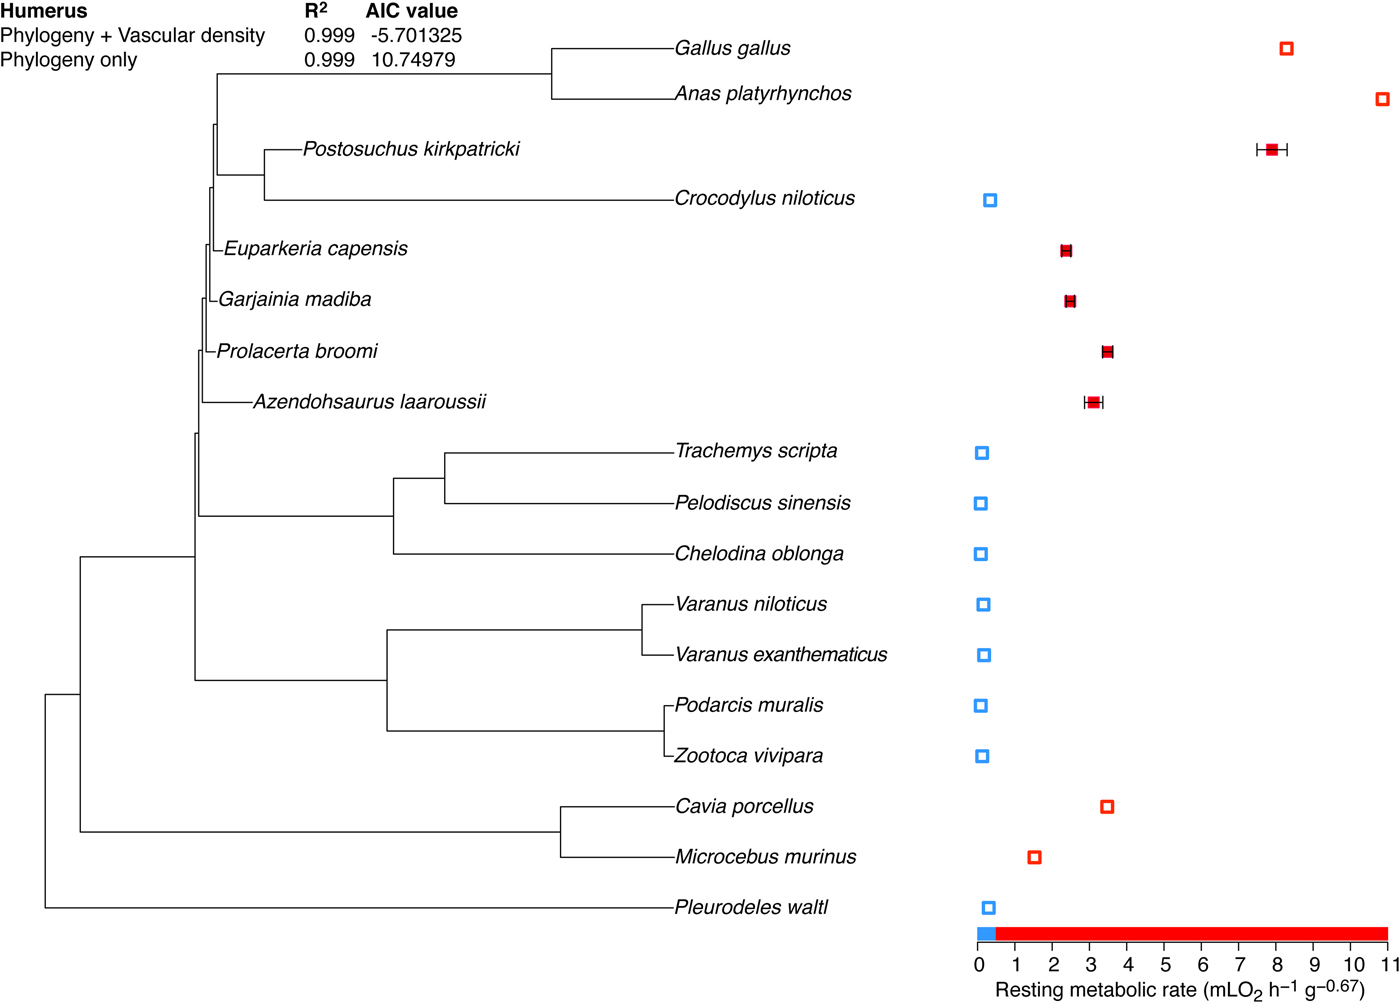
Figure 4. Resting metabolic rates quantified in a sample of extant tetrapods and inferred in a sample of extinct Archosauromopha using the phylogeny and the vascular density of the humerus. Data for Azendohsaurus laaroussii were obtained in this study and data for other taxa as well as the phylogeny were taken from Legendre et al. (Reference Legendre, Guenard, Botha-Brink and Cubo2016). Resting metabolic rates inferred for Azendohsaurus, Prolacerta, Garjainia, and Euparkeria are in the range of variation of extant mammals, whereas the value inferred for Postosuchus is in the range of variation of extant birds.

Figure 5. Resting metabolic rates quantified in a sample of extant tetrapods and inferred in a sample of extinct Archosauromopha using the phylogeny only. Data for Azendohsaurus laaroussii were obtained in this study and data for other taxa as well as the phylogeny were taken from Legendre et al. (Reference Legendre, Guenard, Botha-Brink and Cubo2016). Resting metabolic rates inferred for Azendohsaurus, Proterosuchus, and Maiasaura are in the range of variation of extant mammals; values inferred for Calyptosuchus, Lesothosaurus, Allosaurus, and Troodon are in the range of variation of extant birds, whereas the value inferred for Rutiodon is intermediate.

Figure 6. Resting metabolic rates quantified in a sample of extant tetrapods and inferred in a sample of extinct Archosauromopha using the phylogeny and the vascular density of the tibia. Data for Azendohsaurus laaroussii were obtained in this study and data for other taxa as well as the phylogeny were taken from Legendre et al. (Reference Legendre, Guenard, Botha-Brink and Cubo2016). Resting metabolic rate inferred for Azendohsaurus, Prolacerta, Proterosuchus, Garjainia, Lesothosaurus, Maiasaura, and Thecodontosaurus are in the range of variation of extant mammals; the value inferred for Allosaurus is in the range of variation of extant birds, whereas the value inferred for Lourinhanosaurus is intermediate.
Discussion
Evolution of Fibrolamellar Bone in Archosauromorpha
The formation of fibrolamellar bone is very energy consuming, because it involves the combined action of static osteogenesis (to form a scaffold of woven bone at high growth rates involving high rates of protein synthesis) and dynamic osteogenesis (osteonal infilling with lamellar or nonlamellar parallel-fibered bone) (Prondvai et al. Reference Prondvai, Stein, de Ricqles and Cubo2014). Therefore the capacity for reaching and maintaining very high bone growth rates during ontogeny, recorded by the presence of fibrolamellar bone in the bone cortex, may be a reliable proxy to infer the metabolic rate of extinct animals (see “Introduction”). Four previous studies have analyzed the evolution of the presence of fibrolamellar bone in Archosauromorpha in a phylogenetic context (Botha-Brink and Smith Reference Botha-Brink and Smith2011; Mukherjee Reference Mukherjee2015; Veiga et al. Reference Veiga, Soares and Sayao2015; Jaquier and Scheyer Reference Jaquier and Scheyer2017). Here, we performed parsimony optimizations of this character state (Fig. 7, Supplementary Figs. 2, 3) using our observations on the bone histology of A. laaroussii and previously published observations on other Archosauromorpha (summarized in Table 1).

Figure 7. Optimization using parsimony of the presence of fibrolamellar bone in the stylopodial and zeugopodial bones of the Archosauromorpha analyzed to date (data summarized in Table 1). The topology is based on Nesbitt et al. (Reference Nesbitt, Stocker, Small and Downs2009) for Archosauriformes and on Nesbitt et al. (Reference Nesbitt, Flynn, Pritchard, Parrish, Ranivoharimanana and Wyss2015) for non-archosauriform Archosauromorpha. The minimum ages of taxa are from the Paleobiology Database. Black branches indicate presence of fibrolamellar bone, white branches indicate absence, and black and white branches indicate uncertain character state.
Table 1. Bibliographic compilation of the presence/absence of fibrolamellar complex in the long bones of the non-archosaurian Archosauromorpha analyzed to date.

We observed three bone tissue types in the humerus, femur, and tibia of A. laaroussii: (1) avascular lamellar zonal bone (e.g., Fig. 2A–D); (2) a cortex formed by a scaffold of parallel-fibered bone (with collagen fibers parallel to the longitudinal axis of the bone) containing either small primary osteons infilled by lamellar parallel-fibered bone (inner part of the cortex; Fig. 2F) or simple vascular canals (outer part of the cortex; Fig. 2F), and (3) fibrolamellar bone (e.g., Fig. 3E,F). Therefore, we coded the presence of FLB for Azendohsaurus (Fig. 7, Supplementary Figs. 2, 3).
We coded the presence of FLB for Archosauria, because this character state has been reported both in Pseudosuchia (e.g., Ricqlès et al. Reference Ricqlès, Padian and Horner2003; Padian et al. Reference Padian, Horner and De Ricqles2004; Nesbitt Reference Nesbitt2007; Tumarkin-Deratzian Reference Tumarkin-Deratzian2007) and in Ornithodira (Ricqlès et al. Reference Ricqlès, Padian, Horner and Francillon-Vieillot2000; Padian et al. Reference Padian, Horner and De Ricqles2004; Cubo et al. Reference Cubo, Woodward, Wolff and Horner2015). Consistently, Cubo et al. (Reference Cubo, Le Roy, Martinez-Maza and Montes2012) inferred a high bone growth rate for the last common ancestor of archosaurs. Lepidosauromorpha has been chosen as an outgroup and is characterized by the absence of this character state (Fig. 7, Supplementary Figs. 2, 3).
We performed an optimization of the presence of FLB onto the phylogeny of Archosauromorpha published by Nesbitt et al. (Reference Nesbitt, Flynn, Pritchard, Parrish, Ranivoharimanana and Wyss2015) (Fig. 7). Moreover, we carried out two supplementary optimizations of the presence of FLB using the phylogenies of Archosauromorpha published by Pritchard et al. (Reference Pritchard, Turner, Nesbitt, Irmis and Smith2015) (Supplementary Fig. 2) and Ezcurra (Reference Ezcurra2016) (Supplementary Fig. 3). All three analyses showed a flickering on-and-off pattern that prevents inferring the primitive condition for this clade. Moreover, the parsimony method fails to find the condition for the four more inclusive (basal) nodes of the clade. The only robust conclusion obtained in the three analyses is congruent with that published by Botha-Brink and Smith (Reference Botha-Brink and Smith2011): the fibrolamellar bone was acquired by the last common ancestor of Prolacerta–archosauriforms, with a reversion in Vancleavea (Fig. 7, Supplementary Figs. 2, 3).
Constraining the Phylogenetic Frame of the Acquisition of Endothermy by Archosauromorpha
The resting metabolic rate may be a good proxy to infer the thermometabolic regime (endothermy vs. ectothermy) of extinct organisms, because thermogenesis is very energy consuming (see “Introduction”). Legendre et al. (Reference Legendre, Guenard, Botha-Brink and Cubo2016) used this proxy in Archosauromorpha and concluded that endothermy may have been acquired by the last common ancestor of the clade Prolacerta–archosauriforms. We inferred the resting metabolic rate of a member of the sister group of this clade (Azendohsaurus laaroussii: Allokotosauria) as the next step to better constrain the phylogenetic frame of the acquisition of endothermy by Archosauromorpha. Moreover, we inferred resting metabolic rate values for the sample of 14 extinct Archosauromorpha analyzed by Legendre et al. (Reference Legendre, Guenard, Botha-Brink and Cubo2016). The values inferred for all these taxa are included in the range of variation measured in the sample of extant endotherms (mammals and birds) (Figs. 4–6). Considering that thermogenesis is very energy consuming, we can reasonably assume that all these taxa were endotherms. A parsimony optimization of the presence of endothermy in the whole sample (including extant taxa of known thermometabolism and extinct taxa of inferred thermometabolism) shows that endothermy was acquired twice, by mammals and by the last common ancestor of the clade Azendohsaurus–archosauriforms, and that within this last clade there is a reversion in Crocodylia (Fig. 8). Considering that many archosauriforms have been found in the Permian and that endothermy may have been acquired in a more inclusive clade (Azendohsaurus–archosauriforms), this key evolutionary event probably took place in the Permian. Bernard et al. (Reference Bernard, Lécuyer, Vincent, Amiot, Bardet, Buffetaut, Cuny, Fourel, Martineau, Mazin and Prieur2010) inferred fully developed endothermy for ichthyosaurs and plesiosaurs and incipient endothermy for mosasaurs using a geochemical approach. These conclusions are congruent with those obtained using a paleohistological approach (Buffrénil and Mazin [Reference Buffrenil and Mazin1990] for ichthyosaurs; Fleischle et al. [Reference Fleischle, Wintrich and Sander2018] for plesiosaurs; and Houssaye et al. [Reference Houssaye, Lindgren, Pellegrini, Lee, Germain and Polcyn2013] for mosasaurs). Thermogenetic mechanisms have also been described in Actinopterygii: at the extraocular muscles that warm the eyes and brain in billfishes (Xiphioidei) and in the butterfly kingfish Gasterochisma melampus (Scombridae: Gasterochismatinae) (Davesne et al. Reference Davesne, Meunier, Friedman, Benson and Otero2018). Future research on the biochemical basis of thermogenesis in extant taxa and on paleobiological inference of resting metabolic rates in extinct taxa are needed to elucidate the origin and the evolutionary patterns of endothermy in Osteichthyes.

Figure 8. Optimization using parsimony of the presence of endothermy in a sample of tetrapods. The presence of endothermy was inferred in extinct tetrapods using resting metabolic rates estimated through phylogenetic eigenvector maps. Dark gray (red online) corresponds to the presence of endothermy and light gray (blue online) to the presence of ectothermy. The phylogeny has been taken from Legendre et al. (Reference Legendre, Guenard, Botha-Brink and Cubo2016).
Acknowledgments
We thank R. Allain, curator of paleontology at the MNHN, for giving us permission to perform histological analyses in the right humerus MNHN.F ALM 435, the left femur MNHN.F ALM 497, and the right tibia MNHN.F ALM 369 of A. laaroussii. We also thank D. Germain, curator of the vertebrate hard tissues histological collection of the MNHN, for including the thin sections produced in this study in that collection. Thanks also to H. Lamrous for the preparation of the thin sections, to P. Loubry for the photos, and to S. Fernandez for the drawings. Finally, we thank H. Woodward and an anonymous reviewer for their constructive comments.


