


Introduction
The assembly and evolution of regional biotas is a product of speciation, extinction, and migration. These processes operate over a wide range of spatial and temporal scales, so studies of modern and fossil ecosystems are required to understand their relative roles (Ricklefs and Jenkins Reference Ricklefs and Jenkins2011; Patzkowsky and Holland Reference Patzkowsky and Holland2012). Most studies of regional biotas in the fossil record have focused on patterns of turnover, lumping speciation and immigration (invasion) into a single origination term (Patzkowsky and Holland Reference Patzkowsky and Holland1997; Jackson and Johnson Reference Jackson and Johnson2000; Johnson and Curry Reference Johnson and Curry2001; Olszewski and Patzkowsky Reference Olszewski and Patzkowsky2001; Ivany et al. Reference Ivany, Brett, Wall, Wall and Handley2009). Of the few studies of invasions in the fossil record, all point to an important role for invasion in driving taxonomic turnover and change in diversity of regional biotas (Vermeij Reference Vermeij1991; Patzkowsky and Holland Reference Patzkowsky and Holland2007; Stigall Reference Stigall2010).
Invasions can affect the diversity and composition of regional biotas and the similarity between regions in three ways (Sax and Gaines Reference Sax and Gaines2003). First, invading taxa extend their ranges, thus increasing diversity in the recipient region but also decreasing the distinctness (beta diversity) between the donor and recipient regions. Second, invasions can further decrease the distinctness between regions if invading taxa drive endemic taxa to extinction in the recipient region. Finally, invasions can increase diversity in the donor region and increase the distinctness between regions if the invading population diverges to form a new species as it adapts to new environmental conditions.
Modern studies of invasion document their short-term effects, but questions remain whether the short-term effects are long lasting or merely transient with unforeseen long-term consequences such as a time lag to extinction of natives following invasion of exotic taxa (e.g., Rosenzweig Reference Rosenzweig2001; Strayer et al. Reference Strayer, Eviner, Jeschke and Pace2006; Sax and Gaines Reference Sax and Gaines2008; Gilbert and Levine Reference Gilbert and Levine2013). Studies of the fossil record usually cannot resolve the short-term effects of invasions seen in modern studies, but with the advantage of deep time it is possible to observe the state of an ecosystem before and after the invasion to determine the long-term consequences of invasion (Marshall et al. Reference Marshall, Webb, Sepkoski and Raup1982; Vermeij Reference Vermeij1991; Valentine and Jablonski Reference Valentine and Jablonski1993; Holland and Patzkowsky Reference Holland and Patzkowsky2007; Patzkowsky and Holland Reference Patzkowsky and Holland2007; Stigall Reference Stigall2010, Reference Stigall2012; Myers et al. Reference Myers, MacKenzie and Lieberman2013).
The fossil record has enormous potential for studies that compare taxonomic composition and diversity between regions, although few studies have done this explicitly (Kowalewski et al. Reference Kowalewski, Gurs, Nebelsick, Oschmann, Piller and Hoffmeister2002; Krug and Patzkowsky Reference Krug and Patzkowsky2007; Jablonski Reference Jablonski2008, Reference Jablonski2009), and there are challenges posed by the fossil record in the sampling of spatial structure (Smith Reference Smith2001; Valentine et al. Reference Valentine, Jablonski, Krug and Berke2013; Vilhena and Smith Reference Vilhena and Smith2013). Tectonic deformation, erosion, and burial by younger sediments limit the spatial distribution of fossiliferous rock available for sampling in any single time interval. Nonetheless, with a well-designed sampling strategy based on a high-resolution stratigraphic framework, it is often possible to compare the taxonomic composition and abundance relationships for similar environments in the same time interval between widely spaced outcrop areas (Patzkowsky and Holland Reference Patzkowsky and Holland2012).
Here, we compare ecological parameters of invading and noninvading genera shared between a warm-water region of Laurentia (Wyoming, U.S.A.) representative of warm-water donor environments on Laurentia and a recipient region (Ohio, Indiana, and Kentucky, U.S.A.) for a well-known Late Ordovician marine invasion in North America (Patzkowsky and Holland Reference Patzkowsky and Holland1993, Reference Patzkowsky and Holland2007; Holland Reference Holland1997; Holland and Patzkowsky Reference Holland and Patzkowsky2007). Specifically, we compare metrics of preferred environment, distribution, and abundance of taxa along a shallow-subtidal to deep-subtidal gradient between regions for the same time interval represented by the C5 depositional sequence. In particular, we compare how well ecological parameters are correlated for genera that participated in the biotic invasion and those genera that did not. We discuss the implications of our study for niche stability, speciation, long-term effects of invasion, and the long-term dynamics of regional biotas.
The Richmondian Invasion
The Richmondian Invasion (Holland Reference Holland1997) is marked by an influx of taxa to the eastern United States during the late Katian (Late Ordovician). The invasion is well known on the Cincinnati Arch, where it spans the C4 through C6 depositional sequences (Holland and Patzkowsky Reference Holland and Patzkowsky1996), with the majority of taxa invading in the C5 depositional sequence (Holland Reference Holland1997; Holland and Patzkowsky Reference Holland and Patzkowsky2007, Reference Holland and Patzkowsky2009a; Patzkowsky and Holland Reference Patzkowsky and Holland2007; Lam and Stigall Reference Lam and Stigall2015). Invading taxa are defined as those taxa present in C4–C6 strata but are not known from earlier strata (C1–C3) on the Cincinnati Arch. Invaders come from all major taxonomic groups that comprise Late Ordovician marine assemblages, including algae, sponges, rugosan (solitary and colonial) and tabulate corals, bryozoans, brachiopods, gastropods, cephalopods, bivalves, trilobites, ostracodes, and crinoids (Holland and Patzkowsky Reference Holland and Patzkowsky2009a). Many of the invading taxa exist outside the eastern United States in older strata, and some of these taxa are recurrent, because they are known from older Sandbian strata in the eastern United States, were eliminated in a regional extinction event, and then returned in the late Katian (Patzkowsky and Holland Reference Patzkowsky and Holland1993, Reference Patzkowsky and Holland1996, Reference Patzkowsky and Holland1997, Reference Patzkowsky and Holland1999; Holland Reference Holland1997). The invasion coincides with changes in carbonate lithologies that record a switch from cool-water carbonates to warm-water carbonates (Patzkowsky and Holland Reference Patzkowsky and Holland1993; Holland and Patzkowsky Reference Holland and Patzkowsky1996, Reference Holland and Patzkowsky1997). In Katian strata older than the C4 depositional sequence on the Cincinnati Arch and Nashville Dome, carbonates are characterized by beds of phosphatic skeletal grainstone and calcisiltite interbedded with siliciclastic mudstone, indicating cool, nutrient-rich water. In C4 and younger strata, carbonates contain abundant micrite and peloids and little phosphate, indicative of a switch to warmer, nutrient-poor water.
The Richmondian Invasion had several effects on the regional ecosystem (Holland Reference Holland1997; Patzkowsky and Holland Reference Patzkowsky and Holland1999, Reference Patzkowsky and Holland2007; Holland and Patzkowsky Reference Holland and Patzkowsky2007). The invasion began in the C4 sequence with incursions of brachiopods (Leptaena, Rhynchotrema, Retrorsirostra) and solitary rugose corals (Streptelasma, Grewingkia) in single beds, in which these taxa are common or abundant. These incursions also coincide with a breakdown of the depth-related gradient structure of the preceding time interval (Holland and Patzkowsky Reference Holland and Patzkowsky2007). The invasion was in full force by the C5 sequence, and the abundance relationships of the dominant taxa at the regional scale changed markedly from the C4 to the C5 depositional sequence. The C4 sequence is dominated by the brachiopods Zygospira and Rafinesquina followed by ramose trepostome, thin ramose trepostome, and bifoliate trepostome bryozoans. The C5 sequence is dominated by ramose trepostome, thin ramose trepostome, and cryptostome bryozoans followed by the brachiopods Rafinesquina and Hebertella (Patzkowsky and Holland Reference Patzkowsky and Holland2007). Regional richness of genera increased by nearly 40% as a result of the invasion. Partitioning of diversity shows that the increase in richness can be explained by two turnover (or beta) components: an increase in within-habitat turnover and a lesser increase in between-habitat turnover. This broad sweep of changes indicates that the regional ecosystem was not saturated with species and that the effects of the invasion were not ephemeral but long lasting.
The Richmondian Invasion was preceded by a regional extinction in the late Sandbian about 8–7 Myr earlier. Recurrent taxa, those eliminated from the eastern United States in the late Sandbian only to return in the late Katian (Richmondian) invasion, help identify the potential source area for the invasion. Corals, sponges, calcareous algae, and several genera of brachiopods that were eliminated in the eastern United States all found refuge in the warm, tropical water of Laurentia, now found in the western United States and across Canada (Foerste Reference Foerste1924; Roy Reference Roy1941; Patzkowsky and Holland Reference Patzkowsky and Holland1993, Reference Patzkowsky and Holland1996; Jin et al. Reference Jin, Harper, Rasmussen and Sheehan2012).
These recurrent taxa responded to oceanographic changes triggered by the Taconic orogeny, which eliminated warm-water conditions in the eastern United States (Patzkowsky and Holland Reference Patzkowsky and Holland1993; Holland and Patzkowsky Reference Holland and Patzkowsky1996, Reference Holland and Patzkowsky1997; Pope and Read Reference Pope and Read1998) and Canada (Lavoie Reference Lavoie1995) and replaced them with cool, nutrient-rich water masses. In the late Katian, warm-water conditions returned to the eastern United States, as oceanographic barriers to warm currents were breached (Patzkowsky and Holland Reference Patzkowsky and Holland1993; Holland and Patzkowsky Reference Holland and Patzkowsky1996) or as a result of short-lived global warming prior to the Late Ordovician glaciation (Pope and Read Reference Pope and Read1998; Fortey and Cocks Reference Fortey and Cocks2005). Recurrent assemblages in the eastern United States originally hampered correlation between the eastern United States and the western United States and Canada based on macrofossils (Miller et al. Reference Miller, Youngquist and Collinson1954; Mitchell and Sweet Reference Mitchell and Sweet1989). More recent graphic correlation of conodonts shows that many recurrent taxa existed in the western United States and Canada during times when they were absent from the eastern United States (Mitchell and Sweet Reference Mitchell and Sweet1989), which establishes the warm-water carbonate environments of Laurentia as a refuge from the late Sandbian regional extinction and a potential source of the late Katian (Richmondian) Invasion.
Bighorn Dolomite
The Bighorn Dolomite in Wyoming was deposited on a tropical carbonate platform (Fig. 1) in the Late Ordovician (Katian; Holland and Patzkowsky Reference Holland and Patzkowsky2009b, Reference Holland and Patzkowsky2012) and consists of three stratigraphic sequences correlated to the C2, C3, and C5 sequences in Cincinnati (Fig. 2) based on conodont graphic correlation (Sweet Reference Sweet1979, Reference Sweet1984). The uppermost member of the Bighorn Dolomite, the Horseshoe Mountain Member, comprises the C5 sequence. The Horseshoe Mountain Member consists of six parasequences, which are generally characterized by shallow-subtidal massive-bedded, pervasively burrowed dolomitic skeletal wackestone to mudstone overlain by peritidal laminated dolostone (Holland and Patzkowsky Reference Holland and Patzkowsky2009b, Reference Holland and Patzkowsky2012). One of these parasequences contains a basal shallow-subtidal facies that grades upward into fossiliferous deep subtidal, thin- to thick-bedded skeletal packstone, and thin-bedded argillaceous skeletal packstone (Rock Creek Beds, Fig. 2), which are in turn overlain by shallow-subtidal and peritidal facies.

Figure 1 Late Ordovician paleogeographic map of Laurentia showing positions of the Bighorn Mountains and the Cincinnati Arch. Map based on Northern Arizona University paleogeography website (Blakey Reference Blakey2015). White, land area; light gray, shallow shelf; medium gray, deep-shelf margins; dark gray, open ocean.
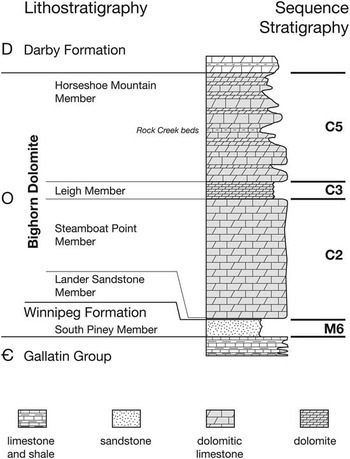
Figure 2 Stratigraphic column of the Bighorn Dolomite. Study interval is in the Horseshoe Mountain Member, correlative with the C5 depositional sequence on the Cincinnati Arch (Holland and Patzkowsky Reference Holland and Patzkowsky1996).
The paleoecology of the Bighorn Dolomite assemblages is not well known. Darton (Reference Darton1906) published the first and only synoptic list of taxa from the Bighorn Dolomite prior to this study. Subsequent studies focused on taxonomic treatments of individual taxa from the Horseshoe Mountain Member, with the exception of Miller and Carrier (Reference Miller and Carrier1942), who reported on the cephalopod fauna from the Steamboat Point Member. Studies of the Horseshoe Mountain Member, and in particular the Rock Creek Beds, include corals (Elias Reference Elias1983; Gierlowski and Langenheim Reference Gierlowski and Langenheim1985), crinoids (Kolata Reference Kolata1976), brachiopods (Macomber Reference Macomber1970), and a calcareous alga (Boyd Reference Boyd2007; Rendall and Husinec Reference Rendall and Husinec2012). Formal systematic study of the cephalopods, bryozoans, and trilobites are needed. A general description of biofacies and their relation to stratigraphic architecture through both the Steamboat Point and Horseshoe Mountain Members (C2 and C5 sequences) was based on estimates of taxon abundance on mostly vertical faces at a few stratigraphic sections in the northern Bighorn Mountains (Holland and Patzkowsky Reference Holland and Patzkowsky2009b). In the current paper, we present a more detailed analysis of the biotic gradients in the Horseshoe Mountain Member based on specimen counts from multiple sections.
The Bighorn Dolomite in the Bighorn Mountains is part of an extensive, shallow, warm-water, tropical carbonate platform on Laurentia (Jin et al. Reference Jin, Harper, Rasmussen and Sheehan2012). Shallow-subtidal facies characterized by pervasive Thalassinoides burrows and an associated diverse assemblage of corals, nautiloids, gastropods, brachiopods, and calcareous algae are known to span from the Great Basin (Nevada and Utah) through the Williston Basin (Wyoming and Manitoba) to North Greenland (Jin et al. Reference Jin, Harper, Rasmussen and Sheehan2012, Reference Jin, Harper, Cocks, McCausland, Rasmussen and Sheehan2013). Although it is not possible to say that the invasion was sourced specifically from the Bighorn Mountains region (see Wright and Stigall Reference Wright and Stigall2013; Bauer and Stigall Reference Bauer and Stigall2014), the Bighorn Dolomite (Horseshoe Mountain Member) environments are representative of warm-water environments that sourced the invasion (Patzkowsky and Holland Reference Patzkowsky and Holland1993, Reference Patzkowsky and Holland1996), and the ecological parameters of taxa in the Horseshoe Mountain Member are assumed to be representative of the tropical carbonate platform as a whole. Biogeographic relationships between regions based on parsimony analysis of endemicity (Lam and Stigall Reference Lam and Stigall2015) suggest that during the C5 interval, taxa invading the Cincinnati Arch were from the Upper Mississippi Valley and areas north of the Transcontinental Arch, which include the Bighorn Mountains and the localities included in this study. Because the Richmondian Invasion is linked to evidence of warming, it is reasonable to assume that invading taxa came from the widespread warm-water regions on Laurentia. For example, Plaesiomys subquadratus is a Richmondian invader derived from P. anticostiensis on Anticosti Island, Canada (Wright and Stigall Reference Wright and Stigall2013), which is another part of the extensive warm-water carbonate platform that includes the Bighorn Dolomite (Finnegan et al. Reference Finnegan, Bergmann, Eiler, Jones, Fike, Eisenman, Hughes, Tripati and Fischer2011; Jin et al. Reference Jin, Harper, Cocks, McCausland, Rasmussen and Sheehan2013).
The Environmental Niche of Fossil Taxa
Our concept of environmental niche follows closely that of Hutchinson (Reference Hutchinson1957) and Valentine (Reference Valentine1969) with some modification based on current use (e.g., Pearman et al. Reference Pearman, Guisan, Broennimann and Randin2008). The fundamental niche is defined as the combined suite of physical environmental variables, for which the intrinsic growth rate of the population is positive (Pearman et al. Reference Pearman, Guisan, Broennimann and Randin2008). The realized niche is the portion of the fundamental niche that is occupied by a species, and it includes modification of niche occupancy by biologic interactions, such as competition or predation.
Determining species’ response to environmental variables of the fundamental niche is exceedingly difficult in modern species, because it requires careful manipulative experiments (Pearman et al. Reference Pearman, Guisan, Broennimann and Randin2008), and it should therefore be essentially impossible in fossil taxa, but new approaches hold promise (Saupe et al. Reference Saupe, Hendricks, Portell, Dowsett, Haywood, Hunter and Lieberman2014; Myers et al. Reference Myers, Stigall and Lieberman2015). Here, we use the distribution and abundance of fossil taxa as a proxy for the realized niche (Hadly et al. Reference Hadly, Spaeth and Li2009; Holland and Zaffos Reference Holland and Zaffos2011; Patzkowsky and Holland Reference Patzkowsky and Holland2012; see also Ludvigsen et al. Reference Ludvigsen, Westrop, Pratt, Tuffnell and Young1986; Hopkins Reference Hopkins2014). We model distribution and abundance with a normal distribution (Holland Reference Holland1995), and we call the parameters that describe this distribution ecological parameters. Two of these parameters (preferred environment, environmental tolerance) are considered niche parameters that define the realized niche of a taxon. The other four parameters (peak abundance, occupancy, median abundance, rank abundance) describe the abundance of the taxon within its realized niche.
Describing the realized ecological niche of fossil taxa requires collecting and counting individual specimens from measured sections described in sufficient detail to infer proxy environmental information, such as water depth (Holland et al. Reference Holland, Miller, Meyer and Dattilo2001; Holland and Zaffos Reference Holland and Zaffos2011). Because of the time-intensive nature of these studies, the complete geographic range of fossil taxa usually cannot be studied, so estimates are made for smaller regions.
Niche stability (or stasis) is the tendency for a taxon to maintain its niche requirements over time (Pearman et al. Reference Pearman, Guisan, Broennimann and Randin2008; Stigall Reference Stigall2012; Saupe et al. Reference Saupe, Hendricks, Portell, Dowsett, Haywood, Hunter and Lieberman2014). Studies of niche stability typically investigate niches of individual species, but studies of niche stability in higher taxa (Hadly et al. Reference Hadly, Spaeth and Li2009) and broader ecological units (Crisp et al. Reference Crisp, Arroyo, Cook, Gandolfo, Jordan, McGlone, Weston, Westoby, Wilf and Linder2009) demonstrate that ecological stability can occur at many taxonomic levels. We compare ecological parameters of genera, and in some cases higher taxa, between regions to study niche stability. We use genera instead of species because genera are more easily identified in field samples than species, so their distributions and abundances are well known. In the absence of well-supported phylogenetic relationships of species within genera for most lower Paleozoic marine invertebrates, we assume that species within genera are phylogenetically related and, therefore, that congeneric species will have similar niche requirements. This basic assumption is well supported by decades of paleoecological research showing that genera occupy relatively discrete environmental zones (Elias Reference Elias1937; Ziegler Reference Ziegler1965; Johnson Reference Johnson1972) and persist with these same environmental characteristics for millions, even tens of millions of years (Boucot Reference Boucot1975, Reference Boucot1983; Patzkowsky Reference Patzkowsky1995; Patzkowsky and Holland Reference Patzkowsky and Holland1999; Holland and Patzkowsky Reference Holland and Patzkowsky2007; Holland and Zaffos Reference Holland and Zaffos2011). Even higher taxa can have ecological distributions that change little for tens to 100 million years or more (Walker and Laporte Reference Walker and Laporte1970; Sepkoski and Miller Reference Sepkoski and Miller1985).
The ecological conservatism of fossil genera is also consistent with modern data and theory that suggest that closely related species share similar ecological traits, although there are many counterexamples (Pearman et al. Reference Pearman, Guisan, Broennimann and Randin2008). Thus, niche stability in fossil taxa is an appropriate null hypothesis to test across space and through time. Evidence for niche stability of fossil genera implies niche stability of the constituent species, whereas evidence for a lack of niche stability of fossil genera (niche shift) implies variation in ecological parameters of the constituent species.
Data and Methods
Fossil collections from the Horseshoe Mountain Member (C5 sequence) are tied to measured sections from nine localities (Holland and Patzkowsky Reference Holland and Patzkowsky2012). Bedding surfaces were examined and macrofossils tallied for all identifiable fragments greater than 2 mm, for a total of 63 collections and 3396 individual specimens from 86 taxa. Taxonomic identifications are based on Miller and Carrier (Reference Miller and Carrier1942), Elias (Reference Elias1983), Gierlowski and Langenheim (Reference Gierlowski and Langenheim1985), Kolata (Reference Kolata1976), Macomber (Reference Macomber1970), and Boyd (Reference Boyd2007). Counting protocols are the same as in previous studies of the Cincinnati region (Holland and Patzkowsky Reference Holland and Patzkowsky2007), allowing a direct comparison of results. For example, brachiopod and bivalve counts are determined as the total number of articulated specimens plus the number of dorsal or ventral valves (left or right valves in bivalves), whichever is greater, plus one-half the number of unidentified valves. Trilobite counts include the number of complete specimens plus the number of cranidia or pygydia, whichever is greater. Colonial corals were counted as individual colonies, but diameters of colonies were also recorded. Bryozoans were counted in 1 cm parcels, so that a specimen 5 cm long would count as 5. Crinoid genera and morphotypes were identified based on columnals (Meyer et al. Reference Meyer, Miller, Holland and Dattilo2002), and their presence in the sample was noted by assigning a count of 1. Some taxonomic standardization was required for comparison between the Wyoming and Cincinnati region data, which tended to decrease differences between regions. For example, Labechia in the Bighorn data was changed to the more general term “stromatoporoid,” which was used in the Cincinnati data because more detailed identifications were often difficult to make. Data files for analyses in this study can be accessed at Dryad: doi:10.5061/dryad.r0j3s.
Cluster analysis of the Bighorn data was used to identify groups of samples characterized by associations of taxa with similar relative abundance relationships, called biofacies. Cluster analysis was performed using the agnes( ) function in the cluster package of R (R Development Core Team 2010). Clustering of samples was performed using Ward’s method on a Bray-Curtis distance matrix following standardization by row totals to correct for differences in sample size. Biofacies were defined by examining samples within clusters to determine their taxonomic composition and relative abundances of taxa. Environmental significance of biofacies was determined by assigning samples to depositional environments (shallow subtidal or deep subtidal) based on a combination of their lithologic composition, bedding characteristics, and sedimentary structures (Holland and Patzkowsky Reference Holland and Patzkowsky2012). The shallow-subtidal facies is characterized by massive-bedded skeletal wackestone and packstone with local thin (1–10 cm) beds of skeletal grainstone and pervasive Thalassinoides bioturbation. This facies contains abundant fossil taxa (corals, sponges, calcareous algae, brachiopods, cephalopods, and gastropods), and it is interpreted as an open-marine environment to several meters water depth. The deep-subtidal facies is characterized by thin-bedded (3–10 cm) to thick-bedded (30–100 cm) skeletal packstone with thin-bedded argillaceous skeletal packstone. This facies contains a diverse biota of solitary rugose corals, articulate brachiopods, trilobites, trepostome and cryptostome bryozoans, gastropods, bivalves, and echinoderms, and it is interpreted as being deposited between normal wave base and average storm-wave base. The deep-subtidal environment was subdivided to include a transition environment interpreted to be at the shallow end of the deep subtidal where beds become more thickly bedded in the gradation to the shallow-subtidal setting.
Detrended correspondence analysis (DCA) was performed with the decorana( ) function in the vegan package of R to determine the gradient structure of the Bighorn biofacies. DCA was performed on a samples-taxa matrix that was standardized by row total. DCA was also performed on a similar matrix of shallow- and deep-subtidal samples from the C5 Cincinnati data (Holland and Patzkowsky Reference Holland and Patzkowsky2007). The DCA analyses were used to compare gradient structure and taxonomic composition between Wyoming and the type Cincinnatian region. Nonmetric multidimensional scaling produced ordinations with overall structure similar to DCA, but DCA produced better-defined faunal gradients that agreed with field observations.
We tested for niche stability by comparing six ecological parameters (preferred environment, environmental tolerance, peak abundance, occupancy, median abundance, rank abundance) for taxa that are shared between the Wyoming and Cincinnati region data sets. Preferred environment (PE), environmental tolerance (ET), and peak abundance (PA) describe the shape and position of taxon response curves along an environmental gradient (Holland and Patzkowsky Reference Holland and Patzkowsky2004; Holland and Zaffos Reference Holland and Zaffos2011; Patzkowsky and Holland Reference Patzkowsky and Holland2012). These three parameters are based on the weighted-averaging algorithm that underlies DCA. Simulations show that weighted averaging is more accurate than logistic regression for estimating these three parameters (Holland and Zaffos Reference Holland and Zaffos2011). PE is simply the taxon scores on DCA axis 1, and it is calculated as the weighted average of the sample scores that contain the taxon. ET is calculated as the standard deviation of DCA axis 1 sample scores in which the taxon occurs and is an unbiased estimate of environmental tolerance. PA is calculated as the percent of sample scores within one ET of the PE that contains the taxon, and it measures the probability that a species will occur in a sample collected from that species’ PE. Occupancy is calculated as the proportion of all samples in which the taxon occurs, and it is a measure of habitat breadth and overall abundance. Median abundance is the middle proportional abundance value of the samples in which the taxon occurs, and it estimates local importance. Regional abundance is determined as a proportion of all individuals in all samples represented by the taxon, and it measures the dominance of the taxon in the ecosystem as a whole.
Our approach is to test for niche stability of assemblages of taxa rather than individual taxa by comparing rank correlations of ecological parameters of shared taxa between the two regions (Holland and Zaffos Reference Holland and Zaffos2011). High rank correlations of ecological parameters suggest strong niche stability across all taxa. If ecological parameters for individual taxa are not conserved, they will stand out as departures from the overall trend. Because genera may have species in Laurentia that do not occur in either the Bighorn region or on the Cincinnati Arch, comparison between the two areas may not include sister species but only more distantly related congeneric species (e.g., Wright and Stigall Reference Wright and Stigall2013). Nonetheless, high Spearman rank correlations for invading genera provide support for niche stability for the shared genera collectively. The approach used here avoids testing stability for each genus separately; instead, it assesses gradient structure, which reflects the environmental niches of all taxa taken together.
We performed three different correlation analyses. We compared ecological parameters between regions by calculating the correlation of all shared taxa. We also calculated the correlation coefficient for taxa present in both regions before and after the invasion (i.e., noninvading taxa) and for taxa that are shared yet were absent in the Cincinnati area prior to the invasion (i.e., invading taxa).
We are interested in determining whether shared taxa hold similar relative values in their ecological parameters in the Wyoming and Cincinnati regions, rather than assessing the linear relationship between the ecological parameters between the two regions. For this reason, we use the Spearman rank correlation coefficient (r s). Spearman’s r s assesses the relative rank of variates between two variables (in this case, the relative rank of a ecological parameter for taxa shared between regions), and it measures the monotonic relationship between variables rather than their linear relationship, which is measured by the Pearson correlation coefficient (Sokal and Rohlf Reference Sokal and Rohlf1995). We also calculate the Pearson correlation coefficient to compare our results with previous studies (Holland and Zaffos Reference Holland and Zaffos2011). We use the same numerical criterion (r = 0.5) as Holland and Zaffos (Reference Holland and Zaffos2011) to determine whether or not a parameter is stable. Although a correlation of 0.5 is arbitrary, it provides a cutoff for strong correlations above 0.5 that suggest niche stability and weak correlations below 0.5 that suggest niche shift.
For interpreting results, we emphasize the strength of the correlations rather than statistical significance of the correlations, which only reflects the certainty that correlations are not zero (Yoccoz Reference Yoccoz1991; Holland and Zaffos Reference Holland and Zaffos2011). However, because we subdivided the data to compare correlations between invaders and noninvaders, we evaluated the likelihood of the strength of the correlation coefficients of the subsets if the data points were drawn at random. We performed randomization tests (bootstraps) by resampling the original data 1000 times with replacement and calculating correlation coefficients.
Comparing ecological parameters of distribution and abundance between regions assumes a similar sampling of two gradients of similar length. We have attempted to control for gradient length by sampling from the same range of environments (shallow and deep subtidal). Using proportional measures of distribution and abundance controls for differences in sample size. Finally, emphasizing rank comparisons between regions emphasizes the relation of parameters among taxa rather than absolute changes in ecological parameters. Uneven sampling of gradients in the two regions is likely to decrease similarities between regions, making it difficult to find evidence for niche stability, thus any positive relationships that suggest niche stability are considered robust.
Results
Bighorn Biofacies
Cluster analysis revealed four clusters of samples that represent different positions along a depth gradient (Fig. 3).

Figure 3 Cluster analysis of Bighorn Dolomite fossil counts. Four main clusters were identified. Facies is encoded as third character in count name: S, shallow subtidal; T, transition between shallow subtidal and deep subtidal; D, deep subtidal.
Tabulate Coral–Sponge–Calcareous Algae Biofacies
Colonial tabulate corals (Paleofavosites, Calapoecia, Palaeophyllum, Catenipora), stromatoporoids (Aulacera), and calcareous green algae (Dimorphosiphon) dominate this biofacies (Fig. 3). Corals and sponges dominate individual collections and are widespread occurring in most collections. Although Dimorphosiphon occurs in only two of our samples, it was observed throughout the shallow-subtidal exposures. The rhynchonellid brachiopods Rhynchotrema and Lepidocyclus are also common, as are gastropods (e.g., Lophospira, Salpingostoma). Rare taxa include ramose trepostome bryozoans, orthoconic nautiloids, and colonial tabulates such as Cyathophylloides and Foerstephyllum. Crinoid columnals (Ectenocrinus, Glyptocrinus, Iocrinus) occur in most samples.
Diceromyonia–Gastropod–Streptelasma Biofacies
The dalmanellid brachiopod Diceromyonia, gastropods (e.g., Hormotoma, Lophospira), and the solitary rugose coral Streptelasma dominate this biofacies (Fig. 3). These taxa are abundant in individual collections but also are widespread through most collections in the biofacies. A suite of brachiopods are intermediate in abundance and presence in collections of this biofacies, including the strophomenids Oepikina, Thaerodonta, Megamyonia, and Strophomena; two species of the orthid Plaesiomys (P. occidentalis, P. rockymontana); and the rhynchonellids Lepidocyclus and Rhynchotrema. Rare taxa come from a wide range of groups including thin ramose trepostome bryozoans (Batostoma, Rhombotrypa) and bifoliate cryptostome bryozoans (Pachydictya), orthoconic nautiloids, gastropods, and a diverse array of trilobites (asaphids, Ceraurinus, Borealaspis, Achatella, Ceraurus, Isotelus). Crinoid columnals (Ectenocrinus, Dendrocrinus, Iocrinus) occur in most collections in this biofacies.
Streptelasma–Gastropod Biofacies
The solitary rugose coral Streptelasma and gastropods (e.g., Hormotoma and Lophospira) dominate this biofacies (Fig. 3). These taxa dominate individual collections and are also widespread through most collections in the biofacies. Taxa intermediate in abundance include the orthid brachiopod Diceromyonia, the strophomenid brachiopod Megamyonia, the solitary rugose coral Bighornia, and the gastropod Raphistoma. Rare taxa comprise a wide variety of higher taxa including gastropods (Liospira, Trochonema, Cyclonema, Fusispira, Salpingostoma, Maclurites), strophomenid brachiopods (Oepikina, Thaerodonta), orthid brachiopods (P. occidentalis, P. rockymontana), rhynchonellid brachiopods (Lepidocyclus, Rhynchotrema), atrypid brachiopods (Anazyga), colonial tabulates (Paleofavosites), solitary rugosans (Lobocorallium, Grewingkia), trilobites (asaphids, calymenids, illaenids, Sphaerocoryphe, Ceraurinus), orthoconic nautiloids, bivalves (Cyrtostropha), bryozoans, (Batostoma), inarticulate brachiopods (Petrocrania), and sponges. Crinoid columnals of Iocrinus, Dendrocrinus, and Ectenocrinus occur in many collections, but are not as widespread as in the previously described biofacies. Although the taxonomic composition and relative abundance of taxa in this biofacies is similar to the Diceromyonia–gastropod–Streptelasma biofacies, it differs primarily by the codominance of solitary rugosans (Streptelasma, Bighornia) and gastropods (Hormotoma, Lophospira) and the relative lack of dominant and intermediate-abundance brachiopods that characterize the Diceromyonia–gastropod–Streptelasma biofacies.
Megamyonia–Diceromyonia Biofacies
The strophomenid brachiopod Megamyonia and the orthid brachiopod Diceromyonia dominate this biofacies (Fig. 3). These two brachiopod genera dominate individual collections and also occur in every collection in the biofacies. Intermediate abundance taxa include the solitary rugosan Streptelasma, the orthid P. occidentalis, bryozoans (Batostoma, Rhombotrypa), and gastropods. Rare taxa in this biofacies include strophomenid brachiopods (Oepikina, Thaerodonta, Strophomena), rhynchonellid brachiopods (Lepidocyclus, Rhynchotrema, Hypsiptycha), orthid brachiopods (P. rockymontana, Vinlandostrophia), solitary rugosans (Bighornia, Grewingkia), gastropods (Lophospira, Hormotoma, Liospira, Raphistoma, Tropidodiscus), trilobites (asaphids, calymenids, Ceraurinus, Ceraurus), bryozoans (Cuffeyella, encrusting trepostomes, Batostoma), and colonial corals (Paleofavosites). Crinoid columnals occur in about half of the collections from this biofacies.
We determined the relative water depth of each biofacies by the proportion of samples classified as shallow subtidal, transition, or deep subtidal in the biofacies. The tabulate coral–sponge–calcareous algae biofacies contains only shallow-subtidal samples and is interpreted to be the shallowest of the four biofacies. The Diceromyonia–gastropod–Streptelasma biofacies contains 2 shallow, 15 transition, and 4 deep-subtidal samples, suggesting it is on the shallow end of the deep subtidal. The Streptelasma–gastropod biofacies contains two shallow, six transition, and seven deep-subtidal samples, suggesting it is slightly deeper than the Diceromyonia–gastropod–Streptelasma biofacies. The Megamyonia–Diceromyonia biofacies contains only two transition and nine deep-subtidal samples, suggesting it is the deepest of the four biofacies. The latter three deep-subtidal biofacies form a compact group, suggesting they share many taxa in common. The tabulate coral–sponge–calcareous algae biofacies links to this group at a high level (Fig. 3), suggesting it shares fewer taxa in common.
Ordination of Horseshoe Mountain Samples and Biofacies
DCA ordination of Horseshoe Mountain samples suggests that axis 1 can be interpreted primarily as a shallow- to deep-subtidal gradient (Fig. 4). Most shallow-subtidal (S) samples have relatively high axis 1 scores and are separated from the group of deep-subtidal (D) and transitional (T) samples with low axis 1 scores. Four shallow-subtidal samples plot with the deep subtidal–transitional group.

Figure 4 DCA ordination of Bighorn samples, coded by environment: S, shallow subtidal; T, transition; D, deep subtidal. Note the gap between transition and deep-subtidal samples on the left and shallow-subtidal samples on the right.
When coded by biofacies, the DCA ordination of samples (Fig. 5) shows a pattern consistent with the dendrogram (Fig. 3). The tabulate coral–sponge–calcareous green algae biofacies characterizes shallow-subtidal environments on the right side of the ordination and is dominated by colonial corals, algae, and stromatoporoids, which all have narrow environmental tolerances. Because these taxa never occur in deep-subtidal samples, a gap occurs that separates the shallow-subtidal biofacies from the three deep-subtidal biofacies. The three biofacies that dominate deep-subtidal environments are characterized by assemblages of gastropods, brachiopods, and solitary corals with broadly overlapping taxonomic compositions suggested by their close arrangement in ordination space. DCA axis 2 primarily reflects variation between the Diceromyonia–gastropod–Streptelasma biofacies and the Streptelasma–gastropod biofacies in the transitional samples.

Figure 5 DCA ordination of Bighorn samples coded by biofacies identified in the cluster analysis (Fig. 3). The close association of deep-subtidal assemblages suggests a patchy distribution of taxa characterized by three assemblages with broadly overlapping distributions of taxa.
Ordination of Cincinnati Samples
Ordination of shallow- and deep-subtidal samples from correlative strata (C5 sequence) in the Cincinnati area (Holland and Patzkowsky Reference Holland and Patzkowsky2007) shows broad overlap among shallow- and deep-subtidal samples, which reflects similarly broad overlap of taxa among samples (Fig. 6). The Cincinnati gradient is characterized by subtidal environments containing abundant trepostome bryozoans and the brachiopods Hebertella, Rafinesquina, and Vinlandostrophia. Deep-subtidal environments are also dominated by trepostome bryozoans and the strophomenid brachiopods Strophomena and Eochonetes, and to a lesser degree by the brachiopods Rafinesquina, Hebertella, Vinlandostrophia, Hiscobeccus, and Plaesiomys. The broadly overlapping shallow- and deep-subtidal samples contrast with the gap in the DCA ordination between shallow- and deep-subtidal samples from the Horseshoe Mountain Member in Wyoming (Fig. 5).

Figure 6 DCA ordination of C5 shallow- and deep-subtidal assemblages from Cincinnati Arch (data from Holland and Patzkowsky Reference Holland and Patzkowsky2007). Note the broadly overlapping distribution of shallow- and deep-subtidal assemblages compared with the Bighorn assemblages (Figs. 4 and 5).
Comparison of Ecological Parameters
Plots compare the ecological parameters of the 37 taxa (Table 1) that occur in both the Horseshoe Mountain Member and the type Cincinnatian region C5 (Figs. 7–10). Environmental tolerance (r s=−0.407) and peak abundance (r s=0.004) are not conserved between regions. Because calculating these parameters requires a minimum of two occurrences, taxa that are rare in at least one region had to be removed from the analyses. This step eliminated nearly half of the shared taxa and did not permit comparisons between invading and noninvading taxa. For these reasons, we do not consider environmental tolerance and peak abundance further.

Figure 7 Bivariate plot of (preferred environment;DCA Axis 1 taxon scores) for species of shared genera between the C5 Bighorn Dolomite (Horseshoe Mountain Member) and the C5 Cincinnati Arch collections. DCA taxon scores are based on DCA analysis of each region separately (Figs. 5 and 6), so the bivariate plot of DCA axis 1 scores represents a comparison of gradient position of species of shared genera between regions.

Figure 8 Bivariate plot of log of median abundance for each taxon shared between the Bighorn Dolomite and the Cincinnati Arch. Median abundance is defined as the median relative abundance of taxa in samples in which they occur.

Figure 9 Bivariate plot of occupancy for taxa shared between the Bighorn Dolomite and Cincinnati Arch. Occupancy is defined as the proportion of total samples in which the taxon occurs.

Figure 10 Bivariate plot of overall rank abundance for species of shared genera between the Bighorn Dolomite and the Cincinnati Arch. Rank abundance represents the ranks determined for all taxa in all samples for each region separately.
Table 1 Taxa shared between the C5 Horseshoe Mountain Member and the C5 Cincinnatian. N, non-invader; I, invader.

Of the four remaining parameters (preferred environment, median abundance, occupancy, rank abundance), none are conserved across all shared taxa (Table 2), as judged by the 0.5 criterion of Holland and Zaffos (Reference Holland and Zaffos2011). Preferred environment has the highest correlations (r p=0.433; r s=0.374), while the other parameters have correlations less than 0.223.
Table 2 Correlation coefficients for niche parameters of taxa shared between the C5 Horseshoe Mountain Member and the C5 Cincinnatian. Correlations greater than 0.5 are in bold. Significance levels determined by bootstrap analysis. See text for details. *, significant at 0.1; **, significant at 0.05; ***, significant at 0.01.
The results differ when invaders and noninvaders are treated separately. For preferred environment, occupancy, and rank abundance, invading taxa have higher correlations than noninvaders, and all are conserved relative to the 0.5 criterion (Table 2). Differences in the Spearman rank correlation coefficients are large between invader and noninvader taxa (preferred environment r s=0.746 vs. 0.228; occupancy r s=0.695 vs. 0.093; rank abundance r s=0.597 vs. 0.088). Bootstrap analyses indicate that the high correlations are unlikely to occur by drawing data points or data pairs randomly (Table 2). Median abundance is not conserved, nor do invading taxa have higher correlations than noninvading taxa.
Discussion
Gradient Comparison of Horseshoe Mountain Member and Type Cincinnatian Region
Nearly all studies of ecological gradients in marine fossil assemblages have identified water depth or onshore–offshore variation as the primary source of variation in taxonomic composition (Ziegler Reference Ziegler1965; Cisne and Rabe Reference Cisne and Rabe1978; Springer and Bambach Reference Springer and Bambach1985; Brett et al. Reference Brett, Boucot and Jones1993; Patzkowsky Reference Patzkowsky1995; Patzkowsky and Holland Reference Patzkowsky and Holland1999, Reference Patzkowsky and Holland2012; Holland and Patzkowsky Reference Holland and Patzkowsky2007). All of these studies are limited to a single depositional basin, and at that scale, water depth is the primary environmental variable that changes across the basin and through time. Nearly unknown is how ecological gradients vary over larger spatial scales within and among depositional basins. Investigating spatial variability in ecological gradients at this larger scale can reveal additional environmental variables controlling the distribution of taxa, and it can identify additional sources of beta diversity (Sepkoski Reference Sepkoski1988; Patzkowsky and Holland Reference Patzkowsky and Holland2012).
Lithologic variation of Late Ordovician rocks defines an environmental gradient from a carbonate platform in the western United States and Canada (Holland and Patzkowsky Reference Holland and Patzkowsky2012; Rendall and Husinec Reference Rendall and Husinec2012) to a mixed carbonate–siliciclastic ramp in the midwest United States (Holland Reference Holland1993; Holland and Patzkowsky Reference Holland and Patzkowsky1997) to a siliciclastic foreland basin in the east adjacent to the Taconic highlands (Lehmann et al. Reference Lehmann, Brett, Cole and Baird1995). Other environmental variables, such as temperature, water clarity, nutrients, likely also varied across Laurentia (Patzkowsky and Holland Reference Patzkowsky and Holland1993; Holland and Patzkowsky Reference Holland and Patzkowsky1997; Patzkowsky et al. Reference Patzkowsky, Slupik, Arthur, Pancost and Freeman1997). Fossil assemblages change across Laurentia as well, likely reflecting adaptation to this lithologic gradient and the effects of distance and limited dispersal capabilities. Bryozoan and coral assemblages vary enough to define three provinces from west to east that correspond to regions dominated by carbonate (Red River–Stony Mountain Province, which includes the Bighorn Mountains), mixed carbonate–siliciclastic (Cincinnati Province), and siliciclastic (Reedsville–Lorraine Province) deposition (Anstey and Chase Reference Anstey and Chase1974; Anstey Reference Anstey1986). These provincial-scale differences are seen in the Horseshoe Mountain and Cincinnati faunas of this study. Of the 113 taxa recognized in this study, only 37 are shared, that is, occur in the C5 sequence of both the Horseshoe Mountain Member and the type Cincinnatian region. These two regions also differ at higher taxonomic levels (Tables 3 and 4). Horseshoe Mountain faunas are dominated by corals and gastropods, which are less abundant in the Cincinnati region. Nautiloid cephalopods are also more common in the Horseshoe Mountain Member than in Cincinnati, despite their taxonomic importance in the Richmondian Invasion. Bryozoans dominate local assemblages in the Cincinnati region but are much less diverse and abundant in the Horseshoe Mountain assemblages.
Table 3 Shallow subtidal taxa by rank.

Table 4 Deep subtidal taxa by rank.

Basic structural differences in the faunal gradients of the Horseshoe Mountain Member and the Cincinnati region are evident in the DCA ordinations (Figs. 4 and 6): the Horseshoe Mountain Member shows a distinct gap between shallow- and deep-subtidal samples, whereas the Cincinnati ordination has broad overlap between shallow- and deep-subtidal samples. The gradient structure of these ordinations is understood better by comparing the dominant taxa in the shallow and deep subtidal (Tables 3 and 4). The Horseshoe Mountain gradient is characterized by a dominance of corals, algae, and stromatoporoids in shallow-subtidal environments, with gastropods and brachiopods being less important. Deep-subtidal environments of the Horseshoe Mountain are dominated by gastropods, brachiopods, and solitary corals. Little overlap occurs among the most abundant taxa in shallow- and deep-subtidal environments in the Horseshoe Mountain Member (Tables 3 and 4), with the exception of the solitary coral Streptelasma. Colonial corals, algae, and stromatoporoids have narrow environmental tolerances and do not occur in deep-subtidal samples, which explains the gap between the shallow- and deep-subtidal samples in the DCA ordination (Fig. 4).
The C5 Cincinnati gradient is characterized by shallow-subtidal environments containing abundant trepostome bryozoans and the brachiopods Hebertella, Rafinesquina, and Vinlandostrophia. Deep-subtidal environments are also dominated by trepostome bryozoans and the strophomenide brachiopods Strophomena and Eochonetes with the brachiopods Rafinesquina, Hebertella, Vinlandostrophia, Hiscobeccus, and Plaesiomys. The most abundant Cincinnatian taxa occur in both shallow- and deep-subtidal environments (Tables 3 and 4), suggesting broad taxonomic overlap between environments.
The C5 faunal gradient in Cincinnati is dominated by ramose trepostome and cryptostome bryozoans (Tables 3 and 4), which are more abundant and widespread than in earlier sequences (Holland and Patzkowsky Reference Holland and Patzkowsky2007). The dominance of widespread ramose trepostomes and cryptostomes in the C5 of Cincinnati results in poorly separated environments in the DCA ordination (Fig. 6). Removing bryozoans from the analysis improves the separation somewhat (Holland and Patzkowsky Reference Holland and Patzkowsky2007), but there is still large overlap among shallow- and deep-subtidal samples, suggesting that the gradient in Cincinnati contains more taxa with broadly overlapping taxon response curves compared with the Horseshoe Mountain Member.
The separation of shallow- and deep-subtidal samples in the Horseshoe Mountain Member compared with the broadly overlapping shallow- and deep-subtidal samples of the Cincinnatian reflects differences in how some species respond to environmental gradients on warm-water carbonate platforms compared with mixed siliciclastic-carbonate ramps. Incomplete sampling could produce such a gap, but exposures of the Horseshoe Mountain Member were often continuous through deep- and shallow-subtidal environments, so a sampling problem seems unlikely. The gap in the ordination, which reflects a sharp break in the number of species shared between environments, most likely reflects the narrow environmental tolerances of the corals and stromatoporoids that dominate shallow-subtidal environments. It could also signal a sharp environmental break on the carbonate platform between shallow- and deep-subtidal environments, which occurs commonly on carbonate platforms (e. g., Rankey et al. Reference Rankey, Guidry, Reeder and Guarin2009).
Geographic Persistence of Ecological Parameters
Ecological parameters of shared taxa are at best weakly similar between the Horseshoe Mountain Member and the type Cincinnatian region. Preferred environment, median abundance, occupancy, and rank abundance all have weakly positive Spearman rank correlations ranging between 0.17 and 0.37 (Table 2). Peak abundance is not correlated between regions (r s=0.004). Depth tolerance has a weak negative correlation between regions (r s=−0.41), although depth tolerance is the most difficult of these parameters to recover in simulations (Holland and Zaffos Reference Holland and Zaffos2011). The lack of any strong positive correlations indicates that as a whole the ecological parameters for taxa shared between areas are different, which is consistent with the differences in gradient ecology of the two regions. The differences in ecological characteristics between regions likely reflect the large-scale environmental differences between the two areas (Anstey and Chase Reference Anstey and Chase1974; Anstey Reference Anstey1986; Patzkowsky and Holland Reference Patzkowsky and Holland1993).
Of the few studies of niche stability in the marine fossil record, all have focused on how ecological parameters change through time. Holland and Zaffos (Reference Holland and Zaffos2011) compared ecological parameters between time intervals defined by depositional sequences over approximately 9 Myr in the Late Ordovician onshore–offshore gradient of the Cincinnati Arch in the eastern United States. Based on correlation of ecological parameters between time intervals, they found high correlations for peak abundance, intermediate correlations for preferred environment, and low correlations for environmental tolerance. Malizia and Stigall (Reference Malizia and Stigall2011; see also Stigall Reference Stigall2012) used environmental-niche modeling to study ecological change in articulate brachiopods, also for the Late Ordovician of the Cincinnati Arch. They found high levels of niche stability during intervals of gradual environmental change, but that niche shift occurred during intervals of rapid environmental change, especially during the Richmondian Invasion. Niche shift was characterized mostly by a decrease in variance of ecological parameters rather than a shift to new ecospace. Hadly et al. (Reference Hadly, Spaeth and Li2009) compared geographic range size for mammal genera and families between the Late Pleistocene and the late Holocene. Despite range shifts and extinction within clades, geographic range size is nearly constant over this interval of time. All of these studies suggest that within a region, at least some ecological parameters are generally stable, even in the face of considerable environmental change.
Our study differs from these previous studies by comparing ecological parameters between regions for the same time interval rather than within the same region through time. The spatial comparison of ecological parameters can help determine the processes underlying beta diversity at large spatial scales such as climatic gradients, dispersal, and ecological drift. Overall, we do not find strong evidence for niche stability among taxa shared between the Horseshoe Mountain Member and the type Cincinnatian region, suggesting that at these spatial scales, climatic gradients and other barriers to dispersal result in much greater variation of ecological parameters for taxa between regions than over periods of several million years within a region. However, the lack of niche stability of shared taxa does not hold when invaders are separated from noninvaders.
Strong Niche Stability of Invading Taxa
Within the shared taxa, the niches of those that are invaders are generally stable, suggesting that invaders are most successful when they can occupy similar niches in the donor and recipient regions. Many of the invaders are colonial corals, which have narrow niche requirements (Fig. 4 and “Discussion” above). Because these taxa make up a large proportion of the invaders, they increase the strength of the correlations of ecological parameters. In this study, the switch from cool-water to warm-water carbonates associated with the Richmondian Invasion may have favored the successful introduction of shallow, warm-water taxa with narrow niche requirements into the recipient Cincinnati region.
Our result is consistent with many modern studies that support niche stability of invading species, although there are also many counterexamples (e.g., Broennimann et al. Reference Broennimann, Treier, Müller-Schärer, Peterson and Guisan2007; Pearman et al. Reference Pearman, Guisan, Broennimann and Randin2008). For example, climatic niche shift, measured as a shift to new climate conditions in a multivariate niche space, is rare for 50 terrestrial plant species between Eurasia, North America, and Australia (Petitpierre et al. Reference Petitpierre, Kueffer, Broennimann, Randin, Daehler and Guisan2012). Only 15% of species shifted their distributions in the invaded region so that more than 10% of their distribution is outside the climate niche in the invaded area. Similarly, abundance changes little between the native and invaded range of grass and forb species from many sites around the globe (Firn et al. Reference Firn, Moore, MacDougall, Borer, Seabloom, HilleRisLambers, Harpole, Cleland, Brown, Knops, Prober, Pyke, Farrell, Bakker, O’Halloran, Adler, Collins, D’Antonio, Crawley, Wolkovich, La Pierre, Melbourne, Hautier, Morgan, Leakey, Kay, McCulley, Davies, Stevens, Chu, Holl, Klein, Fay, Hagenah, Kirkman and Buckley2011). What is interesting about our study is that given the scale of resolution within the C5 depositional sequence, niche stability may exist for up to 1 Myr after invasion (Holland and Zaffos Reference Holland and Zaffos2011).
Why Noninvaders Show Weak Niche Stability
Within the shared taxa, the ecological parameters of those that are not invaders have low correlations (r<0.3), suggesting niche shift of noninvading shared taxa between the Horseshoe Mountain Member and the type Cincinnatian region. One explanation for the low correlation may be that the noninvaders include taxonomic categories above the level of genus. Ten of the 27 shared noninvader taxa are low-resolution categories such as stromatoporoid or gastropod indet. (Table 1). Because higher-level taxa might contain a range of species and genera with widely varying ecological parameters, these higher taxa could cause the low correlations. If this explanation were true, we would expect that removing the higher taxonomic categories would improve the correlation of the remaining genera, suggesting niche stability for these taxa. Removing the higher-level taxa does not improve the correlations of remaining genera, which hover near zero (preferred environment, r s=−0.185; rank abundance, r s=−0.116; occupancy, r s=−0.13; median abundance, r s=−0.03). Thus, the shared noninvader genera have strongly differing ecological parameters between the two regions, suggesting niche shift for these taxa.
A second possible explanation for the low correlation is the phylogenetic distance between shared noninvader genera. Prior to the Richmondian Invasion, the warm-water regions of Laurentia and the Cincinnati region exchanged relatively few taxa for nearly 8 Myr (e.g., Patzkowsky and Holland Reference Patzkowsky and Holland1993; Wright and Stigall Reference Wright and Stigall2013; Lam and Stigall Reference Lam and Stigall2015), beginning with the onset of the Taconic orogeny and the shift from warm-water to cool-water carbonates. As argued above, if genera contain phylogenetically related species, this 8 Myr interval sets a minimum time on the separation of congeneric species shared between the two regions during which adaptation to local environments in the region could have led to niche drift between lineages. Such niche drift reflects the local adaptation of congeneric species in these regions, resulting in the gradual divergence of their ecological parameters.
A prediction of niche drift is that the correlation of ecological parameters will become progressively weaker as the time interval of comparison increases. The available evidence does not support this prediction. Over a 9 Myr interval in the Cincinnati area, both peak abundance and preferred environment were generally conserved (Holland and Zaffos Reference Holland and Zaffos2011). The strength of the correlations in these parameters remains relatively constant, even over progressively longer intervals of time, supporting niche stability for at least 9 Myr. If the poor correlation in ecological parameters of noninvading taxa seen in the present study cannot be explained by progressive niche drift over time in the type Cincinnatian series, and if this pattern applies in the warm-water regions of Laurentia, then it suggests that the observed niche shift must have occurred quickly. The most likely interval of this change would have been during the strong environmental changes associated with the onset of the Taconic orogeny, prior to the type Cincinnatian region.
Phylogenetic analyses of the brachiopod genera Glyptorthis, Plaesiomys, and Hebertella are generally consistent with this scenario (Wright and Stigall Reference Wright and Stigall2013). Prior to the onset of the Taconic orogeny, speciation events in southern Laurentia were dominated by vicariance events, but after the Taconic orogeny, speciation events are dominated by dispersal events and are concentrated in the late Katian during the Richmondian Invasion. However, Hebertella does show a burst of speciation on the Cincinnati Arch just after the switch from warm-water to cool-water carbonates (Wright and Stigall Reference Wright and Stigall2013). Confirmation or rejection of this hypothesis awaits additional paleoecological studies of ecological parameters of genera and detailed phylogenetic analyses of their evolutionary relationships.
Implications for the Assembly and Biodiversity of Regional Biotas
Most recent studies of long-term change in regional biotas have focused on describing patterns of turnover and measuring their rate of change (Bretsky and Bretsky Reference Bretsky and Bretsky1976; Brett and Baird Reference Brett and Baird1995; Patzkowsky and Holland Reference Patzkowsky and Holland1997; Olszewski and Patzkowsky Reference Olszewski and Patzkowsky2001; Ivany et al. Reference Ivany, Brett, Wall, Wall and Handley2009). Studies that place regional biotas in a larger spatial context to understand processes that generate and maintain diversity are few, but they all point to the important role of biotic invasion in shaping regional biotas (Vermeij Reference Vermeij1991; Patzkowsky and Holland Reference Patzkowsky and Holland2007; Dudei and Stigall Reference Dudei and Stigall2010; Stigall Reference Stigall2010; Myers et al. Reference Myers, MacKenzie and Lieberman2013).
The results of this study and previous work on the Richmondian Invasion suggest a specific role for biotic invasion that may apply to other invasions at other times. In the Cincinnati region, regional diversity increased by nearly 40% by increased packing of species along the depth gradient (Patzkowsky and Holland Reference Patzkowsky and Holland2007). Successful invaders from warm-water carbonate environments on Laurentia maintained their source-area ecological parameters even after invasion into the Cincinnati region. Divergence of the invading populations to form a new species upon arrival in the donor region added to the beta diversity between the donor and source areas and thus increased continental diversity (Vermeij Reference Vermeij1991; Briggs Reference Briggs2010; Wright and Stigall Reference Wright and Stigall2013). The weak spatial correlation of ecological parameters of noninvading shared taxa, coupled with the stronger correlation through time of the ecological parameters on the Cincinnati Arch (Holland and Zaffos Reference Holland and Zaffos2011), suggests that niche shift must have occurred rapidly during environmental changes associated with the Taconic orogeny (See also Wright and Stigall Reference Wright and Stigall2013), followed by near-stasis in niche characteristics. This suggests that most of the environmental differentiation among regions in the Ordovician of Laurentia arose during relatively brief windows of speciation and niche evolution. In contrast, the Richmondian Invasion witnessed the invasion of taxa from warm-water regions into the Cincinnati region with little niche shift in those invading taxa.
Conclusions
(1) Shallow-marine assemblages from the Bighorn Dolomite characterize equatorial warm-water carbonate platform environments during the Ordovician of Laurentia, and they are dominated by solitary and rugose corals, stromatoporoids, gastropods, nautiloid cephalopods, and brachiopods. Assemblages from the Cincinnati region characterize subtropical mixed carbonate–siliciclastic ramp environments and are dominated by trepostome and cryptostome bryozoans and brachiopods. Of the combined 113 taxa in these two areas, only 37 are shared, indicating substantial differentiation between the equatorial carbonate platform and the mixed carbonate–siliciclastic ramp adjacent to the Taconic foreland basin. Faunal gradients in both regions reflect differentiation of assemblages along a shallow- to deep-subtidal gradient, but the structure of this gradient differs in the two areas. In the Horseshoe Mountain Member, shallow-subtidal environments contain many narrowly distributed taxa (corals and stromatoporoids) and are distinct from deep-subtidal environments, as reflected in cluster analysis and ordinations. In the Cincinnati region, taxa are more broadly distributed, as reflected in the broad overlap of shallow- and deep-subtidal assemblages in ordinations.
(2) Ecological parameters of genera shared between these two regions are only weakly correlated. This weak conservatism of ecological niches contrasts with previous work indicating strong niche stability through time in the Cincinnati area. The spatial differences in ecological parameters suggest local adaptation to regional environmental conditions.
(3) Although shared taxa as a whole show weak niche stability, the subset of taxa that arrived in the Cincinnati area during the Richmondian Invasion shows strong niche stability, suggesting that invaders are most successful when they occupy similar niches in the donor and recipient regions. The noninvading subset of shared taxa represent lineages that diverged nearly 8 Myr before the Richmondian Invasion and have low correlations of ecological parameters. Niche stability within the Cincinnati region for the 8 Myr interval since separation of the regions suggests that niche shift may have occurred in a pulse associated with the onset of the Taconic orogeny and a switch from warm-water to cool-water carbonates in southern Laurentia.
Acknowledgments
We thank D. Jones, M. Aberhan, M. Kowalewski, and S. Marcus for their editorial efforts; C. Myers, G. Vermeij, and an anonymous reviewer for comments that improved the final manuscript; and NASA Exobiology and the Scientific Research Grant 8650-09 from the National Geographic Society.
Supplementary Material
Supplemental material deposited at Dryad: doi: 10.5061/dryad.r0j3s


