


Introduction
Zooxanthellate (Z) and azooxanthellate (AZ) corals are about equally diverse today (Cairns Reference Cairns1999, Reference Cairns2007) but differ strongly in their ecological requirements and environmental occupancy. By lacking photosymbionts, which can contribute up to 90% of the Z coral’s nutrition (Muscatine and Porter Reference Muscatine and Porter1977; Davies Reference Davies1984; Falkowski et al. Reference Falkowski, Dubinsky, Muscatine and Porter1984; Edmunds and Davies Reference Edmunds and Davies1986), AZ corals can live in greater water depth but require higher concentrations of nutrients than Z corals. Z corals live preferentially in well-lit, nutrient-depleted, warm waters, where they often build reef structures, whereas AZ corals, although living in tropical reef environments as well (Wellington and Trench Reference Wellington and Trench1985), preferentially occur in deep and cold waters in the aphotic zone (Cairns Reference Cairns2007). AZ corals may also build reefs in the deep, if nutrient levels are high and currents strong, but only a few AZ species are involved in reef building (Roberts et al. Reference Roberts, Wheeler and Freiwald2006). Most modern AZ coral species also live on sandy, silty, or even muddy bottoms, whereas Z corals preferentially occur in carbonate environments. Although a continuum exists from strong autotrophy to complete heterotrophy (Houlbrèque and Ferrier-Pagès Reference Houlbrèque and Ferrier-Pagès2009; Klaus et al. Reference Klaus, Murray, Swart and McNeill2013), the basic distinction between Z and AZ taxa is important because it determines ecological versatility, which is thought to be important for evolutionary rates (Liow Reference Liow2007).
How the ecological split arose in the evolution of scleractinian corals has long been discussed. The origin of scleractinian corals is deeply rooted in the Paleozoic (Stolarski et al. Reference Stolarski, Kitahara, Miller, Cairns, Mazur and Meibom2011), with a sparse representation of scleractinomorphs prior to the Triassic and a continuous record of scleractinians since then. The old view was that the coral-algal symbiosis has evolved from AZ ancestors (Stanley Reference Stanley1981). However, time-calibrated molecular phylogenies combined with ancestral state reconstructions provided evidence that the ancestral state of scleractinians was symbiotic and that at least three Z-AZ transitions occurred during their evolutionary history (Barbeitos et al. Reference Barbeitos, Romano and Lasker2010). An even more complete phylogenetic tree based on mitochondrial sequences suggests that the Gardineriidae and Micrabaciidae are the most basal extant lineages among the scleractinians. As these families are exclusively AZ and solitary, this was inferred to be the ancestral state of scleractinian corals (Kitahara et al. Reference Kitahara, Cairns, Stolarski, Blair and Miller2010; Stolarski et al. Reference Stolarski, Kitahara, Miller, Cairns, Mazur and Meibom2011). In summary, repeated losses and gains of photosymbiosis may have occurred in the evolution of corals and two questions are obvious: (1) were these changes linked to global environmental change; and (2) had they noticeable effects on evolutionary rates?
Given what is currently known about the ecology and evolution of scleractinian corals, we propose two corresponding hypotheses: (1) Losses of photosymbiosis or increases in the global relative abundance of AZ corals were triggered by rapid global change, whereas gains may be less coordinated. This hypothesis is based on the observations that regional-scale coral bleaching is today associated with elevated temperatures (Hughes et al. Reference Hughes, Baird, Bellwood, Card, Connolly, Folke, Grosberg, Hoegh-Guldberg, Jackson, Kleypas, Lough, Marshall, Nystrom, Palumbi, Pandolfi, Rosen and Roughgarden2003) and that the end-Cretaceous mass extinction had profound effects on the relative abundance of Z and AZ corals at global scales (Kiessling and Baron-Szabo Reference Kiessling and Baron-Szabo2004); in contrast, Z corals became gradually more common during the Triassic, a trend loosely associated with cooling (Kiessling Reference Kiessling2010). (2) Extinction rates of AZ corals are generally lower than those of Z corals because the former are less sensitive to environmental changes and occupy a broader range of habitats. Indeed Z corals were more prone to extinction than AZ corals in the end-Cretaceous mass extinction (Rosen Reference Rosen2000; Kiessling and Baron-Szabo Reference Kiessling and Baron-Szabo2004), but virtually nothing is known about comparative rates over longer stretches of time.
A large-scale loss of photosymbiosis should permit the occupancy of novel deeper-water habitats, such that we predict a subsequent offshore migration resembling a classical onshore-offshore pattern (Jablonski and Bottjer Reference Jablonski and Bottjer1990). These hypotheses are connected to address an even larger question: What accounts for characteristic differences in evolutionary rates between groups of organisms and environmental settings? Here we explore for the first time the biodiversity dynamics and environmental occupancy of scleractinian corals with inferred Z and AZ ecology over their entire fossil record. We conclude that AZ corals did occupy the same suite of environments as Z corals for most of the Mesozoic but started to depart environmentally in the late Early Cretaceous. This change of preferred environment, but not symbiotic mode, had significant effects on turnover rates.
Data and Methods
Data
We compiled fossil taxonomic occurrence data of scleractinian corals in the Paleobiology Database (PaleobioDB, http://paleobiodb.org, accessed 23 September 2014). These data, comprising 32,420 occurrences of 782 valid genera, were downloaded excluding taxa with uncertain genus identifications (e.g., in quotation marks or qualified as aff. or cf.). Although the PaleoDB is a collaborative effort with variable quality control, the great majority of the coral data (77.5%) have been entered by the first author’s working group and taxonomically vetted based on recent literature and opinions stated in the expert forum Corallosphere (http://www.corallosphere.org/, accessed September 2014). This vetting led to 5467 occurrences (17%) to being either re-identified or synonymized with currently accepted species or genera. The data set has been resolved to the level of stratigraphic stages as defined by Gradstein et al. (Reference Gradstein, Ogg, Schmitz and Ogg2012). To increase data coverage, imprecisely dated collections between two stages were randomly assigned to one. Repeated trials of random assignment did not change the patterns reported here. Environmental data and paleocoordinates were downloaded directly from the database and collections were parsed into shallow and deep, reef and non-reef, and carbonate or siliciclastic settings, using the criteria of previous studies (Kiessling and Aberhan Reference Kiessling and Aberhan2007; Kiessling et al. Reference Kiessling, Aberhan, Brenneis and Wagner2007, Reference Kiessling, Simpson and Foote2010). In brief, deep-water environments are defined, on the basis of sedimentological criteria, as those below the storm wave base, reefs as three-dimensional geological structures built by sessile calcifying organisms, and siliciclastic substrates as those dominated by terrigenous sediments such as clay and quartz sand. Importantly, the depth of the storm wave base is usually within the photic zone and varies among oceanic settings (Peters and Loss Reference Peters and Loss2012). Zooxanthellate corals therefore can live below the wave base and thus in deeper-water environments according to our definition. A separation into photic and aphotic environments is unfortunately not possible given the nature of the data, but our cutoff comes close to the 50 m used for distinguishing shallow and deep coral environments today (Cairns Reference Cairns2007).
Identification of Symbiotic Mode
Assignment of the symbiotic mode of corals was done at the genus level, separating inferred zooxanthellates (Z), azooxanthellates (AZ), and apozooxanthellates (AP, genera that include Z and AZ species). All assignments of extinct genera are inferred with varying degrees of confidence and are based on three basic approaches to assess the photosymbiotic mode of fossil corals: uniformitarian, geochemical, and morphological. The uniformitarian approach resides on the assumption that species, genera, and families that exclusively have one photosymbiotic state today also had this mode in the past. Geochemical data use either stable oxygen and carbon isotopes of the coral skeleton (Stanley and Swart Reference Stanley and Swart1995), or stable carbon and nitrogen isotopes in preserved organic matrices (Muscatine et al. Reference Muscatine, Goiran, Land, Jaubert, Cuif and Allemand2005). Morphological criteria are diverse and also based on uniformitarian principles. Corals with morphological characters that are found only in living corals with one particular symbiotic mode are assumed to also have had this mode in the past. Morphological criteria are corallite arrangement, corallite size for solitary corals, the morphology of septa, growth bands, and colony form in dysphotic water depth (Coates and Jackson Reference Coates and Jackson1987; Insalaco Reference Insalaco1996; Rosen Reference Rosen2000; Rosen et al. Reference Rosen, Aillud, Bosellini, Clarke, Insalaco, Valldeperas and Wilson2000; Gill et al. Reference Gill, Santantonio and Lathuiliere2004; Kiessling Reference Kiessling2010; Stanley and Helmle Reference Stanley and Helmle2010). Large solitary corals and colonial corals with cerioid, thamnasterioid, or meandroid corallite arrangement are virtually always Z (Table 1), whereas small solitary corals and colonial corals with dendroid corallite arrangement are mostly AZ. Problems with this approach are the definition of large versus small for solitary corals and the photosymbiotic mode of phaceloid corals, which have a rich fossil record but are rare today. Extant solitary Z corals are usually larger than 4 cm in diameter, which is about the largest diameter of solitary AZ corals such as Flabellum and Stephanocyathus. Some extant phaceloid corals such as Euphyllia and Lobophyllia are Z, whereas others like Cladopsammia and Tubastraea are AZ. We have dealt with these uncertainties in the following way: Solitary corals of intermediate size (>2 and <4 cm diameter) were classified as both Z and AZ as were doubtful (e.g., small) phaceloid corals. We ran analyses with our “best guess” and used the alternative assignments to assess the sensitivity of the results to erroneous assignments. Although there are problematic cases where morphology would suggest AZ in Z corals such as in Duncanopsammia (Veron Reference Veron1995) or where the environmental versatility of a coral would suggest AZ, whereas morphology points to Z (Kiessling et al. Reference Kiessling, Aragón, Scasso, Aberhan, Kriwet, Medina and Fracchia2005), 96% of extant corals would be classified correctly just on the basis of morphological criteria of their skeletons. This value is derived from extant genera where the match between our criteria and symbiotic mode can be assessed directly (Table 1).
Table 1 Symbiotic mode of extant coral genera also recorded as fossils.
To avoid circular reasoning, we did not take the occurrence of corals in tropical, shallow-water environments as evidence for a Z state. Sedimentological and fossil assemblage data were only used to infer aphotic environments and hence an AZ mode for the corals encountered there. The nine AP genera were analyzed together with the AZ group, because they are environmentally versatile (Best Reference Best2001) and thus ecologically similar to AZ corals. In total 760 coral genera could be assigned to a symbiotic mode (Supplementary Table 1) and parsed into one of 41 Mesozoic–Cenozoic stages. Although for the sake of brevity we refer to AZ and Z throughout the paper, one should note that these are inferences for which Rosen (Reference Rosen2000) has used the terms “az-like” and “z-like.”
Symbiotic mode and coloniality or clonality are strongly contingent (Barbeitos et al. Reference Barbeitos, Romano and Lasker2010; Simpson Reference Simpson2013) (Table 2), perhaps because clonality increases the physical tolerance to symbiotic invaders or because colonial corals are longer-lived, giving more time for the maturation of mutualistic interactions (Wulff Reference Wulff1985). There might also be a trade-off between macroevolutionary selection and microevolutionary variation accounting for the contingency (Simpson Reference Simpson2013). Although we repeated all tests described below by parsing the data set into colonial/solitary instead of Z/AZ, the biological interpretations would be less straightforward than for symbiotic mode and are thus not reported in detail.
Table 2 Contingency table of symbiotic mode and coloniality in the data set.
Diversity Dynamics and Sampling Standardization
Dynamics of coral diversity were assessed with range-based methods (Foote Reference Foote2000) because sampling is too volatile for modern occurrence-based methods (e.g., Alroy Reference Alroy2014). We report results from raw and sampling-standardized data. For the latter we applied the Shareholder Quorum subsampling (SQS) algorithm (Alroy Reference Alroy2010). SQS sampled-in-bin (SIB) diversity estimates were adjusted with the three-timer correction as proposed by Alroy (Reference Alroy2010). The genera drawn with SQS were recorded and turnover rates were calculated from interpolated ranges between the times of first and last occurrence. Other methods produce very similar results to SQS (Kocsis et al. Reference Kocsis, Kiessling and Pálfy2014). Range-through diversity metrics and turnover rates were assessed with recent genera included. The target quorum for SQS was always kept at 0.7. Reported values are geometric means of 500 subsampling trials.
To assess differences in turnover rates between symbiotic modes, we compared the median turnover rates in time series (dynamic approach). Stratigraphic ranges (durations) were also compared (static approach), for which we used the raw data as well as a subsampled data set, because the much higher number of fossil Z occurrences than AZ occurrences (Table 2) will artificially inflate the durations of the former (see Results). Because the number of single-interval genera is tightly related to the sampling probability (Foote and Raup Reference Foote and Raup1996), this may significantly bias calculations of taxon durations. However, single-interval genera with several occurrences reported in more than one reference may have been genuinely short-lived. Therefore we have omitted only single-reference genera from the assessment of durations. Estimates of durations were limited to extinct genera.
We conducted selectivity tests of taxonomic rates to see whether changes of environmental occupancy were related to selective originations or extinctions of a particular symbiotic mode. These tests were based on model selection criteria supporting either a one-rate model (no apparent selectivity) or a two-rate model (Kiessling and Simpson Reference Kiessling and Simpson2011; Kocsis et al. Reference Kocsis, Kiessling and Pálfy2014). Because these tests lose considerable power with subsampling, we have applied them only on raw taxonomic rates, which are very similar to SQS rates.
Finally, the completeness of the fossil record of each ecotype was computed by the ratio of sampled genera divided by sampling opportunities in each time interval, the latter being genera known before and after the focal time. In accordance with Foote and Miller (Reference Foote and Miller2007), range-endpoints were excluded because these must be sampled and thus inflate the completeness metric. Correlations between time series are always based on data after generalized differencing (McKinney and Oyen Reference McKinney and Oyen1989) to remove autocorrelations but not assuming a perfect autocorrelation.
Environmental Occupancy
We used fossil occurrences and genus diversities to characterize the range of environments that were occupied by Z and AZ corals. Regardless of the number of species sampled, the presence of a genus in a collection was treated as a single occurrence. Affinities were measured by comparing the observed and expected frequencies of occurrences in each environmental setting (Hopkins et al. Reference Hopkins, Simpson and Kiessling2014). A taxon demonstrates affinity for environment 1 if the expression
 $$^{1} O_{{gen}} /(^{1} O_{{gen}} {\plus}^{2} O_{{gen}} )-^{1} \!O_{{dat}} /(^{1} O_{{dat}} {\plus}^{2} O_{{dat}} )$$
is positive, where O denotes the number of occurrences in a particular environment (1 or 2) corresponding to either the taxon in focus (gen), or the subset of the entire coral data set that covers the duration of the taxon (dat). Affinities for shallow or deep water, and reefal or non-reefal environments as well as for carbonate or siliciclastic substrates were assessed with this method. Our interest was in tendencies of occupancy rather than significant affinities to particular environments, so we refrained from applying statistical tests and used zero as the split value between affinities. Similarly, we used proportional data to measure environmental occupancy. Because the number of occurrences was low in some time slices and time series were volatile, we applied locally weighted scatterplot smoothing (LOESS) to outline general trends. We applied nonparametric statistics such as Spearman’s rho for correlations and Wilcoxon signed-rank tests for assessing location shifts. All analyses were conducted in R (R Development Core Team 2014). To verify the presence of change points in time series we used the changepoint package (Killick and Eckley Reference Killick and Eckley2014), particularly the cpt.mean function with method “AMOC” (At Most One Change) to test if a single change point is statistically supported. The penalty was set to “None” to get a simple maximum likelihood estimate.
Results
Diversity Dynamics
The raw range-through diversity of all corals exhibits a steep increase in the Middle Jurassic and a maximum in the late Early Cretaceous (Aptian–Albian) after which diversity declined until the early Paleogene and rose thereafter (Fig. 1A). The subsampled SIB curve is similar, with a distinct peak in the Albian stage (Fig. 1A) and decline thereafter. The subsampled diversity trajectories of Z and AZ corals indicates that the overall diversity trajectories are largely driven by Z corals, whereas AZ corals increased in diversity more or less monotonically until the present day (Fig. 1B). However, the two curves are cross-correlated (ρ=0.48, p=0.025 for the complete time series from Hauterivian to Pleistocene). Figure 1B also highlights that the overall trajectories are not strongly affected by uncertain assignments of symbiotic mode. Only the Early Jurassic has many medium-sized solitary or phaceloid corals, for which our symbiotic assignments might be considerably off. Although the number of fossil occurrences of AZ genera is much lower than of Z corals, the overall sampling completeness is very similar for the two symbiotic modes (0.59 for Z vs. 0.55 for AZ, p=0.22, two-sided Wilcoxon test).
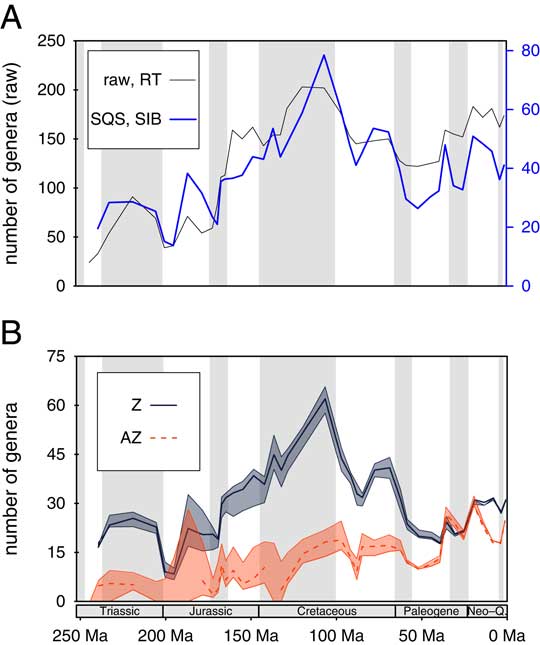
Figure 1 Genus diversity of scleractinian corals. A, Total diversity calculated from raw first and last appearance data (thin black line) and sampling-standardized sampled-in-bin-diversity (SQS, thick blue line). Extant corals were included such that there is a Pull of the Recent (Raup Reference Raup1979). B, Sampling-standardized diversity curve for Z and AZ corals. Gaps in the time series of AZ corals are due to failures in the three-timer correction. Thicker lines indicate the “best guess” of symbiotic mode, and error margins exhibit the results if all doubtful assignments were treated as AZ or Z, respectively. Epochs are shaded. (Online version in color)
Extinction and origination rates are similar for AZ and Z genera (Fig. 2). Although the AZ group has more volatile turnover rates, the average rates are statistically indistinguishable over the entire time series. Turnover rates of AZ and Z corals are cross-correlated with extinctions (ρ=0.60, p<0.001) slightly better than with originations (ρ=0.58, p=0.001). Selective extinctions are not supported by model selection, whereas there are three intervals of elevated AZ originations. Although the Hettangian peak of AZ originations is most striking (Fig. 2B), this is affected by uncertainties in symbiotic assignments and small sample sizes, leaving the Albian as the interval with the strongest support for preferential AZ originations, followed by the Maastrichtian. One observation on extinction rates is important: In the older part of the time series, extinction rates of AZ corals tended to be greater than those of Z corals, whereas after the mid-Cretaceous (Aptian to Cenomanian), Z coral extinction rates were usually higher (Fig. 2A). Differences between the extinction rate values of AZ and Z corals in moving windows (3 and 5 intervals) imply that a major shift happened after the Cenomanian stage. Post-Cenomanian extinction rates are significantly greater for Z than for AZ corals (p=0.011). More importantly, the location shift from pre-Turonian to post-Cenomanian differences in extinction rates is pronounced and highly significant (p<0.001), suggesting reduced extinction rates of AZ corals relative to Z corals after the Early Cretaceous. To make this change more obvious, we plotted the difference of AZ and Z extinction rates through time, showing that post-Cenomanian extinction rates of AZ corals were permanently below those of Z corals until the Pleistocene (Fig. 3).
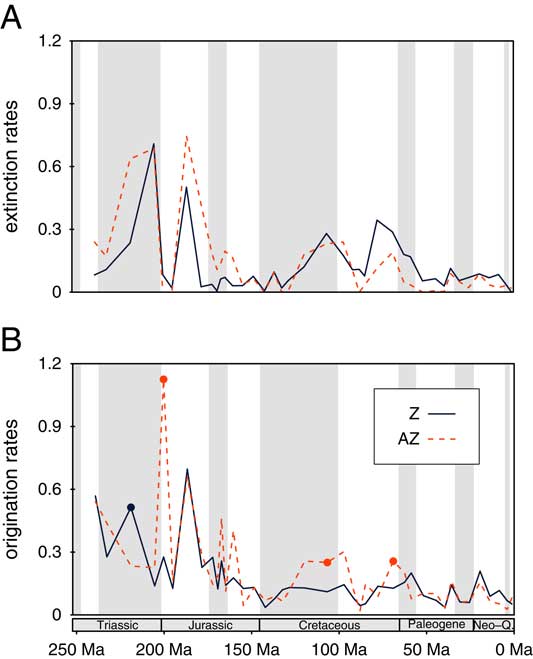
Figure 2 Per capita turnover rates of Z and AZ corals from sampling standardized data. A, Extinction rates. B, Origination rates. Stages in which a two-rate model for the rates is supported are marked by circles. Post-Cenomanian extinction rates combined are significantly lower for AZ corals than for Z corals. (Online version in color)

Figure 3 Time series of AZ minus Z extinction rates. AZ extinction rates are permanently lower than Z extinction rates from the Turonian until the Pleistocene.
Raw durations are significantly shorter for AZ corals than for Z corals (Fig. 4, median genus durations: 32.4 vs. 40.7 Myr, p=0.022). Because the Z coral data set is much larger in terms of both genera and occurrences than the AZ data set, we suspect that the longer durations of Z corals are an artifact of the better sampling leading to an inflation of ranges. In order to test this hypothesis we iteratively rarefied the Z coral data set to be equal to the AZ data set in terms of both the number of genera and of occurrences. We calculated the median genus durations in each trial and then contrasted the median AZ duration with the new resampling distribution. The expected value of the median genus durations of the Z data set decreased to 29.6 Myr, which is lower, but not significantly so, than durations in AZ corals (p=0.84). There were no significant differences in relative longevities before and after the Cenomanian, probably because sample sizes are small and because many of the AZ genera originating after the Cenomanian are still extant.

Figure 4 Histograms of coral durations. A, AZ raw data; B, Z raw data; C, subsampled Z data. The difference in median durations between A and C is not significant. (Online version in color)
Changes in Environmental Occupancy
The environmental occupancy of Z and AZ corals differed significantly across the entire time series. Overall, AZ corals are more likely to preferentially occur in deep-water, siliciclastic, and non-reef environments than Z corals (Table 3, p<0.001 for all comparisons, Wilcoxon test). However, plotted through time, the affinities of both AZ and Z corals exhibit significant trends (Fig. 5). AZ corals became increasingly common in deep, siliciclastic, and non-reef environments, whereas Z corals show the opposite trend. The trends are not strictly linear but appear to be marked by a stable phase until the Early Cretaceous and substantial changes thereafter.

Figure 5 Proportional genus diversity of corals with environmental affinity to deep-water habitats (A, B), siliciclastic substrates (C, D), and non-reefal environments (E, F). The left-hand panels (A, C, E), refer to AZ genera and the right-hand panels to Z genera. The black solid lines indicate proportions of sampled-in-bin diversities and the red dashed lines are locally weighted polynomial regression lines (LOESS) with the span 0.75. (Online version in color)
Table 3 Median proportions of coral genera with environmental affinity. Significant differences between AZ and Z proportions are in bold.
There was a pronounced proportional increase of AZ coral genera with deep-water affinity in the mid-Cretaceous (Fig. 5A) to permanently high values in the Cenozoic. The change point is identified in the Albian stage. Pre-Albian proportions of deep-affinity AZ corals were not distinct from those of Z corals (Table 3) (p=0.10) but post-Aptian proportions were significantly different (p<0.001). The substrate affinity of AZ corals changed more gradually and monotonically toward siliciclastic affinities. Although the LOESS smoothing also suggests a gradual increase from the Early Cretaceous onward (Fig. 5C), the change point of the raw time series is identified in the Maastrichtian. AZ corals had greater affinity for siliciclastic substrates than Z corals before and after this change point. However, affinities did not differ significantly before the Albian (p=0.09), but only subsequently (Table 3). The overall trend for AZ corals with non-reef affinity is less pronounced (Fig. 5E) but also has a significant change point in the Albian. Here a relative non-reef preference of AZ corals was significant before and after the change point. In contrast, the occupancy of Z corals remained more or less stable, apart from a slight increase in shallow-water, carbonate, and reef affinities after the Cenomanian (Fig. 5B,D,F). Change points are also identified but they are all in the Paleogene (Lutetian, Danian, and Thanetian, respectively).
The previous results are limited to the coral data set, so they inform us about relative occupancy among corals but not necessarily about absolute occupancy. To assess when AZ corals started to invade and to become pervasive in deeper environments we have used the entire marine record of invertebrates as a measure of sampling and calculated the ratio of deep AZ coral occurrences to all deep occurrences in the PaleobioDB (Fig. 6). This pattern is striking in that in addition to the late Early Cretaceous increase, we see a dramatic rise in the Danian, that is, after the end-Cretaceous mass extinction. This time also marks the first appearance of deep-water coral reefs (Bernecker and Weidlich Reference Bernecker and Weidlich2005). Therefore, although the bathymetric affinities among corals changed toward deeper water by the end of the Early Cretaceous, the mass invasion of the deep was really a Cenozoic phenomenon.

Figure 6 Proportion of AZ coral occurrences in all fossil occurrences from deeper settings. Note the strong increase in the early Paleogene.
The patterns of latitudinal ranges are equivocal (Fig. 7). Except for the Jurassic, the latitudinal range of AZ corals appears to have always been greater than that of Z corals. AZ coral range-limits expanded significantly over time (ρ=−0.43, p=0.0177), whereas Z corals show no significant trend (ρ=−0.21, p=0.198). These values are based on sampling standardization and refer to the Northern Hemisphere, where data density is greatest. The same basic results are achieved when we use the full latitudinal range.
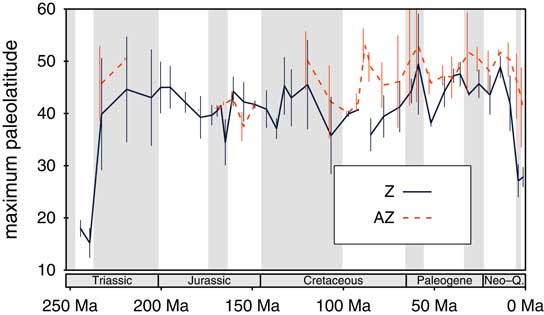
Figure 7 Latitudinal ranges of Z and AZ corals. Sampling-standardized maximum paleolatitudes in the Northern Hemisphere are shown using a quota of ten collections per geological stage and symbiotic mode. (Online version in color)
We also assessed the proportion of AZ coral occurrences in coral collections. The average proportion of AZ occurrences in AZ-bearing collections has peaked in the late Early to early Middle Jurassic and increased from an earliest Cretaceous depression to permanently high levels from the last stage of the Early Cretaceous (Albian) onward (Fig. 8A). AZ coral assemblages became increasingly pure after the Aptian, which is probably an epiphenomenon of the environmental shift recorded above (Fig. 5). The proportion of AZ coral occurrences in Z-coral-bearing collections depicts a different pattern, with a rise from the Early Cretaceous until the Paleocene and a decline thereafter (Fig. 8B). This implies that although the AZ corals’ environmental affinities have changed away from habitats typically occupied by Z corals, AZ were increasingly successful in coexisting with Z corals.
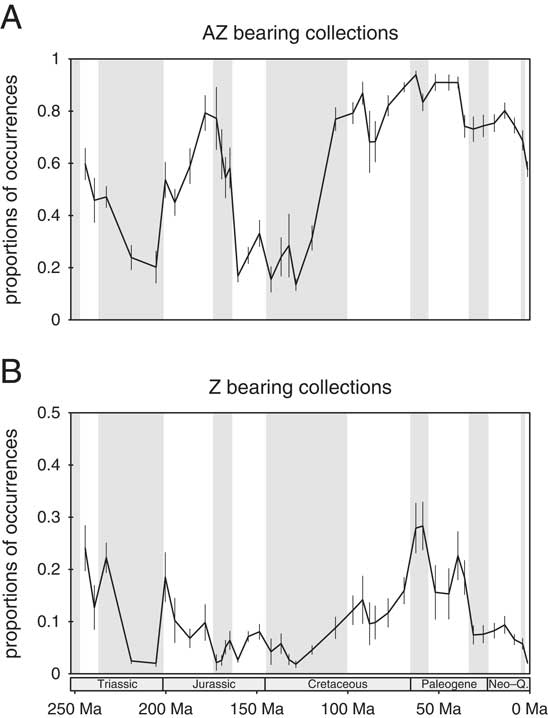
Figure 8 Average proportion of AZ coral occurrences in AZ coral-bearing collections (A) and in Z coral-bearing collections (B). Error bars denote 95% confidence intervals.
Discussion
Biodiversity
Judging from our diversity analyses it appears that the current parity of AZ and Z coral diversity is a geologically recent phenomenon. This would oppose the view of a long-term macroevolutionary equilibrium (Simpson Reference Simpson2013) but instead suggest that the modern world sees the intersection of two trends: an erratic decrease of Z coral diversity since the late Early Cretaceous and a nearly continuous increase of AZ diversity since the Triassic (Fig. 1B). The paucity of AZ corals in ancient rocks has long been known (Stanley and Cairns Reference Stanley and Cairns1988; Gill Reference Gill, Santantonio and Lathuiliere2004) but it was unclear whether this is a sampling bias or has a biological underpinning. Although the fossil record of AZ corals is certainly sparser than that of Z corals, two arguments support the conclusion that AZ corals were genuinely rarer and less diverse than Z corals in the Mesozoic: first, the sampling completeness metrics of the two ecotypes are very similar, falsifying the hypothesis that AZ corals are generally more poorly preserved or sampled; and second, both our diversity-based and occurrence-based approaches take sampling explicitly into account.
Onshore-Offshore Patterns
Scleractinian corals document an onshore-offshore pattern resembling that of many other marine invertebrates (Jablonski et al. Reference Jablonski, Sepkoski, Bottjer and Sheehan1983; Bottjer and Jablonski Reference Bottjer and Jablonski1988; Jablonski and Bottjer Reference Jablonski and Bottjer1990; Smith and Stockley Reference Smith and Stockley2005; Jablonski Reference Jablonski2005). Indeed the offshore expansion of AZ corals appears to be also responsible for their increasing occupation of siliciclastic substrates and non-reef environments. Our analyses of habitat affinities point to the late Early Cretaceous as a critical time, when the environmental occupancy of Z and AZ corals started to diverge. Before the Albian stage, Z and AZ corals occupied the same basic environments, but starting in the Albian AZ corals broadened their habitat occupancy and eventually became rare in their former habitats. The broadening of the AZ niche was initially marked by significantly elevated origination rates in this group (Fig. 2B) and led to permanently reduced extinction rates relative to Z corals later on (Figs. 2A, 3).
Leaving the novelty component of onshore-offshore patterns aside (loss of symbionts can hardly be seen as an evolutionary novelty), we focus on explaining the offshore expansion of corals. Potential mechanisms can be broadly grouped into the categories passive diffusion, push, and pull. Diffusion is the null hypothesis for expansion (Jablonski and Bottjer Reference Jablonski and Bottjer1990; Sepkoski Reference Sepkoski1991), but we reject it based on the temporal trend (Fig. 5A), which is not monotonic (as would be expected from a pure diffusion model) but instead marked by a substantial change in the mid-Cretaceous. Therefore, an environmental trigger appears likely.
Several severe global Oceanic Anoxic Events (OAEs) occurred in the mid-Cretaceous (Jenkyns Reference Jenkyns2010), and hence seeking a causal link to the offshore expansion of corals is tempting. OAEs testify to a substantial expansion of the oxygen minimum zone in the water column and extinctions among benthic and planktonic organisms (Erba et al. Reference Erba, Bottini, Weissert and Keller2010; Caruthers et al. Reference Caruthers, Smith and Grocke2013). A scenario could be envisioned in which anoxia killed off benthic life in the deep and thereby created opportunities for AZ corals to invade. However, deeper-water settings are rarely occupied densely by benthic life (Rex et al. Reference Rex, Etter, Morris, Crouse, McClain, Johnson, Stuart, Deming, Thies and Avery2006), and an empty-habitat pull for AZ corals appears therefore unlikely. More plausible are large-scale oceanographic changes in the aftermath of OAEs, which led to greater nutrient concentrations and more oxygen in deeper waters, thereby providing new opportunities for the “hungry” AZ corals. A similar mechanism has been proposed for onshore-offshore patterns in general, and it is based on the argument that the low oxygen levels of the pre-Turonian oceans would prevent large-scale occupancy (Jacobs and Lindberg Reference Jacobs and Lindberg1998). This idea has been refuted by Jablonski (Reference Jablonski2005), who stated that the dysoxic to oxic change after the mid-Cretaceous was an oversimplification and that offshore in the evolutionary pattern refers to outer shelves rather than deep sea as the place where oxygen concentrations may have been an issue. The offshore migration of AZ corals started before the last and most prominent OAE (OAE II, Bonarelli Event at the Cenomanian/Turonian boundary) and continued through it. Therefore, oxygen limitation does not seem to have prevented offshore migration. Although modern AZ corals can cope with low-oxygen and low-nutrient environments (Roder et al. Reference Roder, Berumen, Bouwmeester, Papathanassiou, Al-Suwailem and Voolstra2013), sufficient food is certainly a prerequisite for their proliferation (Roberts et al. Reference Roberts, Wheeler and Freiwald2006). Unfortunately, little is known about nutrient dynamics in the Cretaceous ocean and the idea of a dramatic increase of nutrient availability is difficult to test. A much lower primary productivity of the mid-Cretaceous ocean compared to today has been inferred (Bralower and Thierstein Reference Bralower and Thierstein1984) but the temporal trajectories of primary production are unknown. Smith and Stockley (Reference Smith and Stockley2005) argued that the deep-sea expansion of detritivorous echinoids was driven by a significant increase in ocean productivity. This migration has occurred around the Cretaceous/Paleogene boundary (75–55 Ma), much later than the initial migration of corals. The dramatic increase of deep-water coral occupancy in the Danian (Fig. 6) would match the scenario of increased productivity but not the increase of deep-water affinity in the mid-Cretaceous.
A push of AZ corals away from Z habitats is also plausible, and this could have been driven by the combined effects of competition and rapid global warming. Two arguments support competition: First, the late Early Cretaceous saw an all-time high of scleractinian biodiversity (Fig. 1), suggesting niche filling; and second, competition for space is dramatic in reef systems (Jackson and Buss Reference Jackson and Buss1975; Benayahu and Loya Reference Benayahu and Loya1981) and therefore a plausible mechanism. Although studies on modern AZ-Z coral interactions report AZ corals as the winners (Wellington and Trench Reference Wellington and Trench1985; Koh and Sweatman Reference Koh and Sweatman2000; Creed Reference Creed2006; de Paula et al. Reference de Paula, Pires and Creed2014), these refer exclusively to Tubastraea, which is a colonial AZ coral well known for its fecundity and for toxins that are harmful to other scleractinian larvae (Koh and Sweatman Reference Koh and Sweatman2000; de Paula et al. Reference de Paula, Pires and Creed2014). However, the observation that AZ corals became more common in Z-bearing assemblages during the Late Cretaceous is disturbing, as this suggests that AZ corals have been successful competitors in Z coral communities from the Late Cretaceous until the Eocene (Fig. 8B).
Finally, rapid warming in the middle Cretaceous, especially during OAEs (Wilson and Norris Reference Wilson and Norris2001; Forster et al. Reference Forster, Schouten, Baas and Damste2007a,Reference Forster, Schouten, Moriya, Wilson and Damsteb; Ando et al. Reference Ando, Kaiho, Kawahata and Kakegawa2008) may have been relevant. Z corals did lose reef-building capacity in the Late Cretaceous, which might have been linked to global warming (Pandolfi and Kiessling Reference Pandolfi and Kiessling2014). Rapid warming pulses are a plausible stress factor for corals (Hoegh-Guldberg et al. Reference Hoegh-Guldberg, Mumby, Hooten, Steneck, Greenfield, Gomez, Harvell, Sale, Edwards, Caldeira, Knowlton, Eakin, Iglesias-Prieto, Muthiga, Bradbury, Dubi and Hatziolos2007); therefore, the loss of symbionts and deep-water shift of AZ corals during the middle Cretaceous might have been a heat-escape strategy. This idea is not refuted by the demonstration that modern AZ corals are apparently less sensitive to temperature variations than Z corals (Caroselli et al. Reference Caroselli, Mattioli, Levy, Falini, Dubinsky and Goffredo2012).
In summary, we envision a scenario of mid-Cretaceous warming pulses, which triggered the initial environmental split of AZ and Z corals and the offshore migration of the former. Enhanced productivity of the late Cretaceous ocean may explain why this split became permanent and ultimately resulted in the environmental occupancy that we see today.
Loss of Symbiosis
We have tacitly assumed that the change in occupancy was associated with the large-scale losses of photosymbiosis as inferred from molecular analyses (Barbeitos et al. Reference Barbeitos, Romano and Lasker2010). The two episodes we identified (mid-Cretaceous and Maastrichtian–Danian) were prominently coupled with origination pulses of AZ corals relative to Z corals rendering this inference plausible. Merging our inferences from fossil data with time-calibrated molecular phylogenies would help verify this conclusion.
Turnover Rates
To finally come back to the question of whether habitat or autecology is more relevant for evolutionary rates, our findings do suggest that habitats are more relevant, at least for corals. Over the entire history of scleractinian corals neither the turnover rates nor the durations of AZ and Z coral genera differed significantly. Only after the offshore shift in the mid-Cretaceous were AZ corals less prone to extinction than Z corals. A fitting autecology is of course necessary for occupying novel habitats. This seems to have been present in corals early in their evolutionary history, but the grand invasion of novel habitats occurred much later and apparently required some extra trigger.
Acknowledgments
This work was supported by Deutsche Forschungsgemeinschaft grant KI 806/7-1. The Balassi Institute provided funding for Á.T.K. This is MTA-MTM-ELTE Paleo contribution number 203 and Paleobiology Database publication number 215.
We thank all members and enterers of the Paleobiology Database who contributed to the data set, especially U. Merkel, C. Krause, A. Hendy, A. Miller, and F. Fürsich. We thank K. Frisch for his work on the data set of taxonomic, ecologic, and morphologic information of coral genera and C. Simpson for discussions. The authors are grateful to J. Pálfy for introducing them to each other.
Supplementary material
Supplemental materials deposited at Dryad: doi:10.5061/dryad.mv32t


