1. INTRODUCTION
Roger Dannenberg has argued that ‘the language and notation we use exerts a large influence on what we think and create’ (Reference Dannenberg1996: 63). Composers continue to explore an increasingly broad range of idiosyncratic approaches to creating music. Many of these approaches – most notably non-score-based practices such as electroacoustic and synthesised music, but also those exploring microtonality, pulseless music, algorithmically generated music, guided improvisation, interactivity and/or mobile structure – are well suited to the plastic representational medium of the digital screen.
Digital innovations provide an opportunity for an expansion of the possibilities of the musical score.Footnote 1 While traditional music notational conventions evolved over a long period, the recent advances in media for the presentation of notation have been rapid and therefore we should consider ourselves ‘still on the “steep part of the curve” from the technology standpoint’ (Dewar Reference Dewar1998: 5). The issues discussed here highlight the potential boundaries and impasses that this expansion might face.
The practice of presenting musical scores on screen has recently gained significant momentum, reflected both in increased academic activityFootnote 2 and the appearance of the documentation of numerous new works appearing on video.Footnote 3 These developments suggest a trend, particularly amongst young composers whose practice has developed exclusively on computer, to take the logical step to present notated materials on screen.
In previous papers by this author (Vickery Reference Vickery2010, Reference Vickery2011, Reference Vickery2012) some of the advantages and potentials of the screen score have been discussed. Perhaps most crucial amongst there are the scrolling, permutative, transformative, generative and networking capabilities of the digital medium. In contrast, this paper examines the limitations of presenting the score on screen and the question of whether any general design principals for presenting notation on screen can be drawn from these understandings.
The most crucial distinction between the traditional paper score and the screen score is motion. In all but the shortest and/or simplest works the density of information required to define a score is too great to represent on a single screen, necessitating the temporally sequential presentation of notation. Rather than the performer visually interrogating the static page freely, the motion of the screen score often implies a specific focal point to be read. Particularly in the case of nonlinear works, the continuous appearance (and disappearance) of notation emphasises the ephemeral aspects of music.
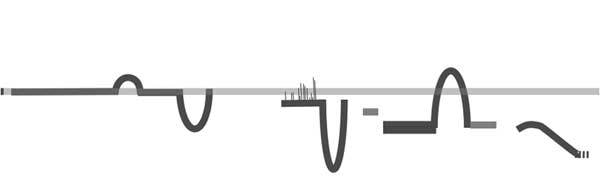
My 2012 article on this subject proposed three paradigms for the screen score: segmented, scrolling and real-time. McClelland and Alcorn differentiate between two forms of segmented score: pages display and scatter display (2008). The term segmented score is intended to encompass all modes of presentation in which portions of a precomposed score (pages, systems or bars) are displayed sequentially. Sudarshan and Wyse employ the term ‘filmic’, which they use to define a score in which ‘visualization changes with time, and the view always represents a notational “now”’ (Reference Sudarshan and Wyse2012: 59). These terms both encompass a number of categories that present the music reader with quite different implications: the rhizomatic score, in which a notational labyrinth allows movement in two dimensions; the 3D score, in which a three-dimensional structure is explored; and animated notation, in which elements of an otherwise static score are in motion. Figure 1 illustrates five of these paradigms.

Figure 1 Screen-score paradigms (from top to bottom): the segmented score, the scrolling score, the rhizomatic score, the 3D score, and animated notation.
Performers trained to read traditional European notation bring learned skills to bear in the reading of any score. In a screen score, however, the temporally sequential presentation of notation generally forces the performer to view only a portion of the score at any moment. The inability to look ahead is potentially disquieting and reminiscent of Cardew’s criticism of the proportional notation methods of Earle Brown: ‘It is a slightly dehumanizing method, because it aims to replace thought (reading) with automatic physical reflex (scanning)’ (Cardew Reference Cardew1981: 244). The possibility of nonlinear presentation of notation may diminish the advantages of learning and practice, creating a circumstance akin to sightreading. Jason Freeman has rather aptly described the task of performing such scores as ‘extreme sightreading’ (Freeman Reference Freeman2008). So what does the literature in regard to sightreading suggest about the limitations of these screen-score paradigms?
2. MUSIC READING, SIGHT-READING AND SCREEN READING
Kinsler and Carpenter proposed a tripartite ‘encoder, processor, executive’ (Kinsler and Carpenter Reference Kinsler and Carpenter1995: 1455) model of music reading (see Figure 2). The pace at which of visual symbols are encoded and processed is a key issue bearing the effectiveness of a screen score. This model proposes that the sightreading process begins with encoding through preliminary transformation of the patterns into neural activity by retinal and central mechanisms, which is processed through the interpretation of musical symbols (traditional or otherwise), and that information about pitch and duration is finally transformed into appropriate patterns of commands to the executant muscles.

Figure 2 Excerpt from Liminum (2012) a nonlinear scrolling score by Cat Hope.
Performers ‘encode’ music with a combination of fixation upon graphical features and rapid repositioning of the eye (saccades). Sightreading studies are in agreement that fixation durations, extracting information from the score, fall within the range of 200–400 ms (Goolsby Reference Goolsby1994a, Reference Goolsby1994b; Truitt, Clifton, Pollatsek and Rayner 1997; Waters, Underwood and Findlay Reference Waters, Underwood and Findlay1997; Waters, Townsend and Underwood Reference Waters, Townsend and Underwood1998; Gilman and Underwood Reference Gilman and Underwood2003) and that experienced music readers fixate less frequently than less proficient readers (see Goolsby Reference Goolsby1994a; Truitt et al. Reference Truitt, Clifton, Pollatsek and abd Rayner1997; Waters et al. Reference Waters, Underwood and Findlay1997; Waters and Underwood 1998). This is explained by the tendency of novice readers to fixate on different parameters such as pitch, duration, dynamic and expression separately, and expert readers’ ability to gather multiple parameters in a single fixation. The durations of saccades between fixations while sightreading fall within in the tens of milliseconds, and there is no significant difference in saccade duration between expert and novice music readers (Gilman and Underwood Reference Gilman and Underwood2003: 221).
Interestingly, a number of studies have shown that ‘musicians spend significant amounts of time fixating upon blank spaces’, averaging 23 per cent of the total time (see Goolsby Reference Goolsby1994a; Truitt et al. Reference Truitt, Clifton, Pollatsek and abd Rayner1997; Gilman and Underwood Reference Gilman and Underwood2003). The reason for this behaviour is not understood, but it has been suggested that these periods allow for perceived material to be processed in working memory, as ‘one of the characteristics of working memory is that the essential information gets lost if there is an overload of information’ (Lee Reference Lee2003: 264). The ‘ability to simultaneously store and process information seems to be a higher prerequisite than the ability to simply store information for sight reading achievement’ (Lee Reference Lee2003: 264).
Each fixation takes in a region termed the gaze frame or perceptual span, which has been demonstrated to extend for ‘approximately 1 measure right of the fixation point’ (Truitt et al. Reference Truitt, Clifton, Pollatsek and abd Rayner1997). Contrary to popular belief, the extent to which performers read ahead of their execution, termed the eye–hand span, is relatively small, being between approximately 2 and 4 beats (Rayner & Pollatsek, 1997). Even in skilled readers visual processing of notation is not very far ahead of the hands and the actual position in the score (Gunter, Schmidt et al. Reference Gunter and Schmidt2003: 742).
Eye–hand span increases with skill, whereas ‘perceptual span’, reflecting the purely visual processing that occurs within a single fixation, does not. This is in contrast to text reading where both eye–hand and perceptual span increase with skill (Truitt et al. Reference Truitt, Clifton, Pollatsek and abd Rayner1997; Gilman and Underwood Reference Gilman and Underwood2003). Eye–hand span is, however, decreased by greater musical complexity (Gilman and Underwood Reference Gilman and Underwood2003: 227). Lochner and Nodine propose this is because ‘more complex patterns will take longer to recognise than simpler patterns, since more features must be examined’ (Reference Locher and Nodine1974: 312).
Gilman and Underwood experimented with an ‘eye-contingent moving-window’ that restricted the number of beats visible to the reader to one, two or four beats. Their findings suggested that restricting the number of beats of notation visible to the reader proportionately increased the duration of fixations, but decreased the length of saccades and the eye–hand span. However, the effect of a four-beat window restriction was indistinguishable from no window restrictions at all (Gilman and Underwood Reference Gilman and Underwood2003: 211).
The applicability of the significant literature exploring the mechanism of sightreading of traditional musical notation is limited in a number of ways. The tasks in sightreading studies generally involve quite simple musical examples (especially in comparison to the works of many composers). Because of the ease of collecting accurate data from MIDI keyboards, sightreading studies have typically focused upon keyboard players, and have therefore not taken into account variation in the performance of instrumentalists who must place musical notation at a significant distance: a keyboard player might typically read from a score at a distance of 50 cm, whereas a percussionist may need to place a score 150 cm away in order to allow for a large instrument or set-up. As screen sizes vary and screen scores may also be projected, there is also the issue of reading notation that is much larger, but read at a greater distance.Footnote 4
Very few studies specifically address the issue of reading music from screens. In 1997 Picking compared a number of presentation styles for musical notation including traditional paper-based medium, as well as its screen-based counterpart and ‘three commonly used animated music tracking techniques’, which he termed tracker (‘a smooth tracking device, which moves along or above the music stave’), stepper (‘a bar marker, usually situated above the music stave at the beginning of the currently playing bar’) and jumper (‘a note marker, often called a “bouncing ball”, which indicates which note is currently being played’) (Picking Reference Picking1997: 73). Participants were given a simple proofreading task and each technique was compared with regard to accuracy of the task and subject preference. The results indicated that in terms of both accuracy and subject preference the ‘jumper’ produced the best results and that the ‘stepper’ was both the least accurate and least preferred, although he noted that the ‘tracker’ was preferred by more able readers. The study used bit-mapped notation presented in hypercard stacks, now many technological generations of out of date, and was undertaken in an era when smart phone and tablet literacy was not yet ubiquitous; however, the findings support the notion that experienced readers prefer the freedom provided by indicating the temporal position of the notation more generally, rather than directing the eye to each note in turn.
Interestingly, Picking also explored a scrolling paradigm for presentation in which ‘a single line stave smoothly moved from the right to left of the display screen in time to its music’ but rejected it after finding that ‘a stave related to anything but slow music moved faster than the fixation threshold of the human eye’ and points out that ‘a semi-quaver at 120 beats per minute would remain still for 125 milliseconds±approximately half the duration of a typical eye fixation’ (1997: 73). While this is true, it is not clear from sightreading studies whether it is necessary for each note to be fixated upon individually or whether (and to what extent) experienced readers can perceive and process larger groups of notes.
Importantly, there are currently no studies of reading of nonstandard notation. This is perhaps due to its degree of specialisation as well as the idiosyncratic nature and variety of graphic notations. However, beyond music-specific studies, a number of disciplines such as design, typography and colour theory focus on issues pertinent to the efficacy of graphical notation. Such studies, for example, suggest that ‘the best polarity in terms of legibility for both computer-displayed slides and projected slides is dark text on a light background, with black and dark blue being the most legible and pleasant text colors’ (Greco, Stucchi, Zavagno and Marino Reference Greco, Stucchi, Zavagno and Marino2008: 831), and that in terms of differentiating features by colour, ‘26 colours be regarded as a provisional limit – the largest number of different colours that can be used before colour coding breaks down’ (Green-Armytage Reference Green-Armytage2010).
The study of instrument design for aircraft also shares many of the time-critical issues of semantic soundness and text legibility relevant to the presentation of notation on screen (if not the safety-critical ones). Due to the illumination of screen scores, they are increasingly used in novel environments that are unusual for the printed page and analogous to those anticipated by aircraft instrument design, such as extreme lighting conditions and unusual or restricted viewing angles. Interestingly, in aircraft instrument design working with text, Vinot and Athènes have found that ‘a display duration of about 50ms allows for reading to proceed normally’ (Reference Vinot and Athènes2012), although they do not specify what could be read in that amount of time.
3. READING AND SCREEN-SCORE PARADIGMS
The segmented screen-score paradigm most closely approximates traditional printed notation in that continuous spans of music are segmented and presented sequentially. In most cases such works present staves of notation that are refreshed with subsequent staves through page turning by a foot pedal or page swipe, a so-called ‘outside in’ solution (Mulder Reference Mulder1994: 3) or via synchronisation through a metronome click, auditory cues or visual cues (an ‘inside out’ solution) to orientate the performer in regard to progressively updating score material.
In both screen and paper segmented scores, the notation exists a priori and may be studied beforehand, alleviating the ‘extreme sightreading’ aspects of a performance. Segmented screen scores vary from traditional notation, however, in their ability to seamlessly present score segments in any ordering, reintroducing some of the time-critical constraints of sightreading even if the material is known.
The studies discussed above suggest that, assuming a segmented screen score to be executed by experienced music readers, 200–400 ms is the minimum duration that a beat of traditional notation must be visible to the performer in order to be ‘seen’; however, in the case of groups of beats of material a rate of between 250 and 500 ms (the sum of fixation duration, saccade duration and processing time) is suggested. Presenting between 2 and 4 beats of material ahead of the execution point of the notation may benefit the rate at which notation is read, but that reading is not improved by the presentation of any more than 2 to 4 beats of material.
In real terms it is indicated that any segment of four beats should be visible at a minimum for between 1 to 2 seconds, suggesting a maximum threshold tempo of 240 to 120 bpm for segmented scores. However, it should be emphasised that the sightreading tasks in these studies were either tonal single-line melodies or chorales comprising only crotchet and quaver rhythmic values. Sightreading studies (and gestalt psychology (Sternberg Reference Sternberg1996: 122)) imply that more complex notation would require a greater degree of processing and consequently require a greater number of fixations, resulting in a significantly reduced reading rate. The effect upon reading music with a synchronising clicktrack has also yet to be examined and may assist in the performance of more complex notation.
Susan George claims that ‘in the most general sense the score is comprised of units. Sometimes these units are primitive elements themselves, and sometimes they are composite so that the primitive elements must be extracted from the units themselves’ (Reference George2004: 157). In website analysis these are referred to as ‘semantically meaningful units’, and used to measure the interaction of a reader with the screened page. Such an approach might usefully be adopted in the study of performers’ interaction with screen scores, as a means of measuring the number of semantically meaningful units that a performer is able to capture in a single fixation and the rate at which they can be captured.
The horizontal, rhizomatic and 3D scrolling score paradigms each employ the technique of moving the score past the performer’s notional fixation point. Of the three, right-to-left horizontal scrolling best approximates reading of traditional music notation. This is because Western readers are habituated to extending their gaze frame to the right of their fixation point both in text and notation. Early ‘side-scrolling’ video games also employed this strategy, with incoming information arriving from the right side of the screen.
Reading from scrolling notation differs from traditional reading, however, in that rather than the eye tracking from left to right along a static page, the eye is forced to fixate in approximately the same position as the score itself moves. Gilman and Underwood’s study recorded saccade lengths of just more than 1.5 cm (57–62 pixels on a 72 dpi screen) and an eye–hand span (the distance between the point of fixation and the point of performance) of between 1.5 and 1.9 cm (Gilman and Underwood Reference Gilman and Underwood2003: 212), suggesting a maximal threshold rate for scrolling of about 3 cm per second. The author’s own experiences with scroll rate confirm these results for a maximal threshold; however, the average scroll rate of the works created by the author in this medium is about half this threshold rate (1.6 cm per second).
The information density of the score is clearly a factor in determining a scroll rate that is comfortable (as opposed to merely possible) to read. One approach to this problem is to improve the efficiency of the notation. Cat Hope’s scrolling scores, for example, are tailored to the requirements of each work and provide the bare minimum of necessary information for its realisation. Her work Liminum (2012) (Figure 2) uses changes in colour (blue or violet) to indicate unspecified timbral variation, lines or curves to indicate the contour (only relative pitch) of their pitched material, red lines to indicate the addition of a distortion pedal and a grey line to indicate the central pitch (chosen by the performer) against which all pitch material is orientated.

Figure 3 Notational conventions promoting metricality in scrolling notation in Lindsay Vickery’s Silent Revolution (2013) (left). Honing’s visualisation of metrical hierarchy (Honing Reference Honing2002).
The difficulty of executing fast rhythmic passages from a scrolling score is significant and intensified in ensemble performance especially when score movements are precisely synchronised. The issue is related to the problem outlined by Picking, which occurs when note onsets occur faster than the fixation threshold of the human eye. The problem is that the eye does not read by continuous scrolling, but through fixations of a finite duration. In addition, readers of traditional notation may be habituated to acquiring information in particular units, for example tuplet groups or beamed groups. Rhythmic precision in traditional music is the complex outcome of mental processing and calculation as well as auditory feedback (which is sensitive to discrepancies of around 20 ms and therefore at least ten times faster than the grain of visual fixation). In a scrolling score, visual input is imposed as the dominant method of synchronisation, and the temporal resolution of visual input is much slower than the resolution possible through traditional processes. As a result, not only is it more difficult to coordinate attacks, but also to engender a sense of metricality, because auditory feedback – which normally plays such an important role in forming a group sense of tempo – is subjugated by the (apparently) precise tempo of the scrolling score.
The author has attempted to address these issues through developing a series of notational conventions. Metrically regular notes are joined together by a thick beam. Tempo changes are indicated by plus (increase) and minus (decrease) markings in boxes attached to thick beams (Figure 3a).

Figure 4 Progressive screenshots (a–d) from the animated score Point Studies No. 1 (2012) by David Kim-Boyle.
This also allows for the representation of simultaneous tempi (Figure 3b). Stems are always placed at the onset of note-heads to lessen visual interference. Metrical hierarchy is visualised in the manner proposed by Henkjan Honing (Reference Honing2002), using sub-beams to represent metrical subdivisions. The metrical pulse in the score is represented by the highest and broadest beam and subdivisions by a thinner secondary beam (illustration to the far right). These measures diminished some of the problems of performing metrical passages from a scrolling score, but it is likely that only auditory synchronisation via a click-track is capable of dispelling them completely.
For similar reasons metrical issues also impact the effectiveness of animated notation. In David Kim-Boyle’s Point Studies No. 1 (2012) these issues are sidestepped by avoiding synchronisation between performers altogether. The screen captures a, b, c and d in Figure 4 show the gradual unfolding of the notation in which circles of different colour represent four different tonal pitches, the distance between them the note duration and their size the dynamic. Performers may cross from inner to outer arcs when notes of the same pitch are adjacent.

Figure 5 Screenshot of Study no. 8 for 15 percussionists (2013) by Ryan Ross Smith.
Ryan Ross Smith’s Study no. 8 for 15 percussionists (2013) (Figure 5) is a ‘tablature’ score depicting the movement of the mallets of 15 individual performers each represented by a figure. The smooth pendulum-like movement of the mallet symbols in this work allows the performers to anticipate the point at which they will strike the small grey circles on each side of the figure representing the instruments. In this sense, Smith’s approach relies on kinaesthetic understandings of motion to elicit synchronisation through visual means.

Figure 6 Progressive screenshots from the animated score Vidatone 139 (2004) by Andre Vida.
The final example, Andre Vida’s Vidatone 139 (2004), raises a further temporal issue: the time of appearance of visual information in relation to desired time of appearance of the sound. In the Vidatone series short passages of stylised notation are animated. The series of screen captures in Figure 6 shows the stem of the final note in the sequence growing longer and eventually arching up above the stave. A question arises in terms of interpretation: when are these changes reflected in what the performer plays? It is perhaps assumed that performer plays the final note in its new configuration (first a lower pitch, then both higher pitch and later) at the end of looped repeats of the figure, but the question of realisation becomes gradually further complicated by new (and less traditional looking) notation that rolls over the initial figure, eventually splits in two and finally turns on its side. In this sense eye–hand span is disregarded in this work, in that new eye-catching features may emerge in regions of the score that do not correspond to the natural eye–hand span of the performer, rather than in advance of the gaze frame. Although the work is interpretable, the interpretation is of a more nonliteral, even satirical nature than the scores discussed previously.

Figure 7 An example of a musical representation continuum.
4. SCREEN-SCORE NOTATION
For many composers utilisation of the screen score is a solution to the notational representation of specific compositional problems: electroacoustic and synthesised music continuous parametrical changes, synchronisation with prerecorded audio or live processing, nonlinear formal organisation and the like. The time-critical issues of presenting notation on the screen considered above point to the necessity for developing notation that is as efficient as possible, and the works discussed exemplify some of the solutions to these issues. One important factor contributing to the efficacy of notation is semantic soundness – the degree to which the graphical representation makes inherent sense to the reader, rather than necessitates learning and memorisation of new symbols.
Medley and Haddad discuss visual representation as a continuum ranging between photographic realism and textual description. They describe the realism continuum as ‘a visual model that presents any image as a series of pictures, iteratively reduced in fidelity from its referent’ (Medley and Haddad Reference Medley and Haddad2011: 145). Scored forms of musical representation occupy a similar continuum, in this case between the spectrogram (a precise frequency/time/amplitude representation of sound) and text scores that verbally describe the required sound (Figure 7).

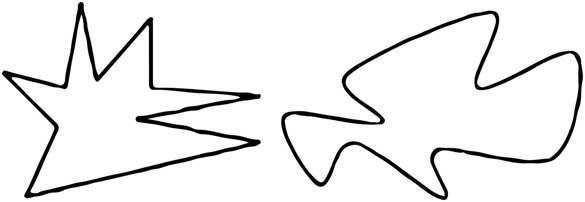
Figure 8 The kiki /bouba effect. ‘Because of the sharp inflection of the visual shape, subjects tend to map the name kiki onto the figure on the left, while the rounded contours of the figure on the right make it more like the rounded auditory inflection of bouba’ (Ramachandran and Hubbard Reference Ramachandran and Hubbard2001: 19).
Unlike visual representation, however, music notation may also function highly specifically as tablature, indicating the actions necessary to obtain a sound, and even, in the case of non-semantic graphical notation, in a non-specific fashion providing only cues indicating an aesthetic to be interpreted by the performer.
Examples of tablature notation include systems commonly used for guitar and gamelan notation, but can also be found more experimental scores such as Berio Sequenza V (1966), Globokar?Corporel (1985), Lachenmann Pression (1969–70) and Aaron Cassidy What then renders these forces visible is a strange smile (or, First Study for Figures at the Base of a Crucifixion) (2007–08). Kojs discusses this approach in his paper on ‘action-based music’ (Kojs Reference Kojs2011).
Non-semantic graphical notations are perhaps best thought of as an exemplar of what Lacan termed a ‘meaning effect’ in that they ‘generate a signified effect or meaning effect that cannot itself be situated within the order of signifiers’ (Pluth Reference Pluth2012: 30). Such notation does not represent the sounds to be performed or indicate the manner in which they should be produced, but may only give an indication of the sense they should arouse – the ‘feel’.
There is interplay between these polarities of notational function in all scores. In traditional notation, layout and typography, such as the straight rather than ‘quill-penned’ flags of Universal Edition, give interpretive cues to the performer. Despite the symbolic graphical qualities of the ‘symbol’ movements in George Crumb’s Makrokosmos I (1972) and II (1973) they also function as traditional notation. Despite the extreme openness of Logothetis’s graphic scores he still states that ‘dynamics and articulation can be seen from the form of the symbol’ (Karkoschka Reference Karkoschka1972: 78). Understanding of the semantic implications of notation is an important key to developing appropriate and efficient notation for screen scores.
Ramachandran and Hubbard have proposed that ‘there may be natural constraints on the ways in which sounds are mapped on to objects’ (2001: 19). Evidence of such constraints emerged through the study of synaesthesia, a rare condition causing individuals to experience sensory input cross-modally, the most common form being the simultaneous activation of the senses colour and sound. Their starting point was the bouba/kiki experiment (Figure 8) conducted by Wolfgang Köhler (Köhler Reference Köhler1929).

Figure 9 Spectrogram (a) and representation of spectrogram (b) (detail) in the inaudible becomes audible (2014).
This experiment suggests that a degree of ‘weak synaesthesia’ (Martino and Marks Reference Martino and Marks2001; Marks and Odgar Reference Marks and Odgar2005) or cross-modal activation is present in the population at large, and that graphical symbols can elicit meaning through inherent semantic qualities.
The score for my work the inaudible becomes audible (2014) exploits these qualities (Figure 9). In this work a spectrogram of an improvisation for bass clarinet and electronics was used as the basis for the score for flute, clarinet, viola, cello, percussion and electronics. (The spectrogram is also re-sonified.) The instrumental parts were drawn directly onto (and from) the spectrogram and prominent sonic features are indicated using: ‘floating’ traditional staff/clef/pitch symbols to specify pitch, thickness of each player’s line to indicate dynamics and transparency, and hue of the line (along with textual indication) to denote specific forms of timbral variation, from regular instrumental sound to diffused tones. The orchestration of individual instrument parts are colour coded: flute – green, clarinet – red, viola – orange, cello – blue and percussion – purple.

Figure 10 Visual principles that convey meaning in graphic symbols (Patel et al. Reference Patel, Schooley and Wilner2007).
The hypothesis that graphical symbols can elicit meaning through inherent semantic qualities intersects and supports the work exploring spectromorphology into the visual domain, as both a descriptive analytical and prescriptive compositional tool in electroacoustic music, by Giannakis (Reference Giannakis2006), Thoresen (Reference Thoreson2007), Blackburn (Reference Blackburn2011), Pasoulas (Reference Pasoulas2011) and Tanzi (Reference Tanzi2011).
Blackburn notes that ‘it is frequently reported that, in concert, acousmatic music has the powerful effect of conjuring imagery, shapes, trajectories and spaces, which we as listeners proceed to describe verbally’ (Reference Blackburn2011: 5). She proceeds to outline ‘a new graphical vocabulary based on spectromorphology’ (2011: 5) allowing for individual ‘sound units’ to be visualised and ‘strung together to form longer phrase lengths’ or ‘morphological strings’ (Blackburn Reference Blackburn2009).
Related studies in non-musical research may provide a basis for the expansion and understanding of this field. In linguistics Wierzbicka’s has investigated ‘semantic primes’, innately understood concepts that cannot be expressed in simpler terms (Reference Wierzbicka1996); Horn has proposed picture communication symbols, a visual language for communicating without words (Reference Horn1998); and Marks has explored the concept of perceptual metaphors demonstrating, for example, that adults rate angular nonsense figures as more aggressive, more tense, stronger, and noisier than rounded shapes (Marks Reference Marks1996).
Patel, Schooley and Wilner have also identified a set of visual features used to convey the meaning of 25 commonly used concepts as depicted in Picture Communication Symbols, ‘a popular augmentative and alternative communication symbol set’ (2007: 65) (Figure 10). Their set of visual principals that convey meaning in graphic symbols are a valuable starting point in the development of semantically sound notation.

Figure 11 One of the crescendo F♭s from the clarinet part of Messiaen’s Abîme des oiseaux represented as a spectrogram and the Lyrebird Environment Player.
Research at the Visual Perception and Aesthetics Lab at the University of California-Berkeley suggests that there is also a high degree of correlation between mappings of colour-to-sound. Griscom and Palmer have proposed that there are systematic relationships between colour and a range of musical phenomena including timbre, pitch, tempo, intervals, triads and musical genres in non-synaesthetes (Griscom and Palmer Reference Griscom and Palmer2012, Reference Griscom and Palmer2013). For example, Grisolm and Palmer have observed that the yellow–blue value of sonic/visual correspondence is correlated with attack time, whereas average red–green value is correlated with spectral brightness (2013).
Their research also suggests that colour-to-sound relationships are mediated by emotional responses and ‘arise because the music and colours share common, underlying, emotional responses (Prado-Leon, Schloss and Palmer Reference Prado-Leon, Schloss and Palmer2011: 19). Similarly, Eitan and Timmers suggest that ‘pitch metaphors, while culturally diverse, may be based upon basic underlying mappings, stemming from bodily-based inter-modal interactions with the physical environment’ (Eitan and Timmers Reference Eitan and Timmers2010: 407). This phenomenon has come to be known as weak synaesthesia (Martino and Marks Reference Martino and Marks2001) or simply crossmodal correspondence (Deroy and Spence Reference Deroy and Spence2013).
While the exploration of crossmodal correspondences is ongoing, an important indicator is the work of Peter Walker which suggests that crossmodal correspondences are ordered in clusters: for example, high/fast/bright/small/sharp and low/slow/dark/big/smooth. Walker claims that ‘the same core correspondences should emerge whichever sensory feature is used to probe them, confirming that the en bloc alignment of the dimensions is context invariant’ (Walker Reference Walker2012:1806).
Some of these crossmodal principals were explored in a Max patch built to visualise sonic features of a field recording for my work the Lyrebird: Environment Player (2014). In this work, the frequency and amplitude of the single strongest detected sinusoidal peak is represented as a rectangle drawn on a scrolling LCD object. Brightness, noisiness and bark scale data derived using Tristan Jehan’s analyzer~ object are used to determine the luminance, hue and saturation of each rectangle. In contrast to a spectrogram, only principal sonic features are depicted, however timbral features are reflected in the changing colour of the rectangles. Figure 11 shows a simple example in which one of the long-crescendo F#s from the clarinet part of Messiaen’s Abîme des oiseaux is shown represented as a spectrogram (using Chris Cannam’s Sonic Visualiser software) and the Lyrebird Environment Player. This example illustrates the representation of continuous timbral and amplitude changes over the duration of the note.
The patch was developed to allow a provide a performer with a visualised score that is scrolled from right to left across the computer screen, depicting the principal features of a field recording. Playback of the source recording is delayed by 12 seconds to allow the performer to see the visualisation of the sounds before they are heard. Lyrebird incorporates an analysis panel that provides controls for the performer to view and scale the representation of data from the field recording. This allows for the performer to ‘zoom’ the visualisation in or out on a particular range of frequency, amplitude, brightness, noisiness or bark scale data.
This approach also has application to the analysis of electroacoustic music. As Grill and Flexer have indicated, traditional spectrogram ‘visualizations are highly abstract, lacking a direct relationship to perceptual attributes of sound’ (Reference Grill and Flexer2012). This approach goes some way toward alleviating the problem of ‘demonstrating coindexation and segmentation due to the difficulty in illustrating differences in timbre’ (Adkins Reference Adkins2008) in a spectrogram and provides an (almost) real-time feature analysis of the recording in which contours and timbral shifts are readily recognisable.
Figure 12 shows a representation of Pierre Schaeffer’s Étude aux chemins de fer, clearly delineating segments of the work created with varied source materials. The scaling in this reading consistently colours sound objects of the same materials. The entire 170 seconds of the work was represented by slowing the scrollrate of the lcd object. The insert shows the whistle that occurs at approximately 112 seconds into the work and illustrates the ‘Doppler’ effect that is heard through a change of both vertical height (pitch) and colour (timbre).

Figure 12 Pierre Schaeffer’s Étude aux chemin de fer represented in the Lyrebird Environment Player, illustrating segmentation by colour (timbre). The insert shows the Doppler effect on a whistle that occurs at approximately 112 seconds in greater detail.
5. CONCLUSION
The screen score is in its infancy as a mode for the presentation of sound and notation. Many issues in regard to the effectiveness of the emerging variety of methodologies for presenting notation on screen remain unexamined, in particular the evaluation of these techniques through eye-movement studies. Sightreading studies suggest that the baseline of 200–400 ms per fixation gives an absolute lower boundary to the visual duration of musical symbols. Although the reader’s ‘gaze frame’ has been shown to take in a region of approximately one bar, the effect of notational complexity upon the amount of information that can be acquired from a single fixation has not been examined to date.
The scrolling score, although highly useful for synchronising musical events in non-metrical music, has particular natural constraints based on the limitations of human visual processing: at scroll rates greater than 3 cm per second the reader struggles to capture information; information-dense musical notation may significantly lower this threshold; reading representations of fine metrical structures in a scrolling medium is problematic. The problem may be caused by a conflict between the continuous movement of the score and the relatively slow (in comparison to the ear) fixation rate of the eye or simply a by-product of unfamiliarity with the medium; however, the cause is currently unexplained.
These problems are amplified in animated screen scores in which transformations occur to the notation in multiple locations or over extended distances. The reader is restrained by gaze frame and the execution of such scores are likewise vulnerable to synchronisation-dependent forms of music, although this may be alleviated by taking advantage of the kinaesthetic qualities of animated motion.
The issue of efficient and semantically sound notation is crucial to the development of effective notation and sonic representation for the screen score. The effectiveness of strategies mapping of shape and colour to sound is critical to the expansion of this approach to sonic representation. The incorporation of studies into concepts such as semantic primes, visual language, perceptual metaphors and weak synaesthesia may greatly contribute to the expansion of such strategies.