

Introduction
The Turkish economy has in recent years become more open to the world, with a present trade volume of 50 percent of its GDP as compared to around 40 percent during the first decade of the 2000s. Nonetheless, the economy is quite vulnerable, with continuous large trade deficits of around 10 percent of its GDP. These have been at least partly financed by hot money—i.e., short-term rent-seeking international funds—thus making the Turkish economy quite fragile when faced with external and internal economic and political shocks. Moreover, the fact that, owing to Turkey’s international commitments, it is not possible to protect domestic industries by imposing tariff and non-tariff barriers makes it necessary for the Turkish economy to become more competitive in world markets. During the 1990s, there were two significant developments that have had important repercussions for this situation and for the Turkish economy as a whole. First, Turkey became a member of the World Trade Organization (WTO) in 1995, agreeing to abide by the rules of the WTO Agreement. Second, beginning on the last day of 1995, Turkey became a member of the European Union (EU) Customs Union. These two events have significantly constrained Turkey’s policy flexibility, especially in the field of foreign trade, by ending protective tariffs and direct export incentives.
In the recent past, Turkey could survive high trade deficits thanks to excess liquidity in world financial markets. However, this may not prove to be the case in the future, which is likely to grow increasingly complex and even problematic in many ways, particularly when the ever increasing technology-driven competition in globalizing world markets are taken into consideration. In fact, Turkey’s persistent large trade deficits, together with its accelerating decline in exports relative to the world, are currently a serious point of concern.
The aim of this paper is to critically analyze the present level of competitiveness of Turkish exports, particularly with respect to technology, and to investigate the economy’s prospects in a technologically more competitive future. First, a short review of developments in the structure of global trade will be provided, focusing on the perspective of developing countries. After setting the scene for the Turkish economy by summarizing the recent course of events, Turkey’s competitiveness from the viewpoints of commodities and trade partners will be examined; then, as a follow-up to this, the degree of diversification of Turkish exports and its significance will be considered. Next, the article will investigate Turkey’s present position vis-à-vis the technology intensiveness of its exports, innovation trends in Turkey and its leading trade partners, and the acquisition of technology through imports, along with a detailed look at Turkish competitiveness in terms of technology. Then, in the fifth section, the question of Turkey’s readiness for the challenge of technology in future trade will be discussed. Finally, the last section will provide an overview along with some concluding remarks.
Trade and development in perspective
Over time, developing countries have come to realize that achieving economic development is not possible solely through the exportation of primary products. Consequently, especially during the period from 1950 to 1970, many of them chose to adopt new trade policies in the form of “import substitution.” Many developing economies that adopted the import substitution policy, such as South Korea and Taiwan, have succeeded in producing competitive goods. However, import substitution policies were not successful everywhere. For example, the so-called “lost decade” of the 1980s in Latin America was arguably caused by failed import substitution policies, although later it was also strongly argued that it was basically a result of excessive borrowing in the 1970s and mismanagement of the resulting debt crisis by both borrowers and creditors, not to mention the oil shock of the late 1970s.Footnote 1
In the meantime, international financial institutions have advocated neoliberal policies and liberal trade policies, with developing countries being encouraged throughout the 1980s and 1990s to rely on market-oriented policies. The so-called “Washington Consensus,” which originally targeted Latin America, has served almost as a manual for neoliberal policies, asserting a relationship between trade liberalization and economic development.Footnote 2 However, a significant number of countries, especially in East Asia, did not follow liberal policies, but instead exhibited significant achievements by switching to export-led growth policies. The economies that adopted this strategy first rapidly developed labor-intensive manufactures to replace traditional primary goods exports, and subsequently capital- and skill-intensive products followed suit. The success of export-led growth strategy became evident as early as the 1970s.Footnote 3 The first great leap was made by South Korea, Hong Kong, Taiwan, and Singapore—the so-called “four Asian tigers.”Footnote 4 According to Rodrik,Footnote 5 all the successful development models of the 20th century were based on managed trade regimes: the import substitution model of the 1960s, the export-led industrialization of East Asian countries, and later the state capitalism of China. It must be emphasized that these policy paradigms were not solely related to trade policies, but were part and parcel of economic policies as a whole.
These rapid developments, starting especially in the East Asian economies, together with revolutionary improvements in information and communication technologies, paved the way for the reorganization of world trade.Footnote 6 The rapidly expanding industrial capabilities of many developing countries, particularly in Asia, have enabled the industrialized world’s transnational companies (TNCs) to outsource some of their standard activities at lower costs, thereby leading to a shift from producer-driven to buyer-driven global commodity chains, which came to be known as global value chains (GVCs).Footnote 7 GVCs have encouraged developing economies to take part in them and thus move to the upper technological echelon. Although GVCs have opened a new and wider path for industrialization and participation in the global manufactures trade, they initially made TNCs more powerful owing to intense competition among suppliers. Over time, the TNCs of the developed world came to concentrate mostly on product development and marketing, leaving the rest to their partners in developing economies. Moreover, after the global crisis of 2008–2009, cost pressures on TNCs led to an increasing outsourcing of business processes, knowledge processes, and information technology to developing countries.Footnote 8 Suppliers have become bigger and more sophisticated and capable; they have become not only key input suppliers, but also suppliers of pre-production and post-production services, leading to a power shift towards manufacturers in emerging economies like China, India, Brazil, and Turkey.Footnote 9 Presently, technology is more intertwined with trade and development than ever, and as a result trade and development policies require greater coherence.
Recent developments in the Turkish economy
Just prior to the new millennium, the world economy witnessed regional crises in East Asia in 1997 and Russia in 1998. The Turkish economy was adversely affected, especially by the Russian crisis. This was then followed by the most severe crisis to date, the 2000–2001 banking crisis. When this crisis crashed the economy, Turkey had already been involved in an International Monetary Fund (IMF) stand-by arrangement since December 1999. The subsequent financial turmoil and sharp depreciation of the Turkish lira led to drastic consequences in the real economy, causing a 5.7 percent decline in GDP in 2001. Although exports declined only very slightly, the rate of decrease in imports was more drastic as a result of the lira’s depreciation and the decline in domestic demand, and the trade deficit still amounted to more than 5 percent of GDP. The following years witnessed certain positive developments in the economy that led to relatively high GDP growth. Throughout the 2000s, Turkey’s trade volume steadily increased, ultimately reaching around 50 percent of its GDP (Figure 1). These developments were, effectively, supported by the increase in global liquidity flowing toward emerging economies.

Figure 1 Turkey: Current account balance (cab), total merchandise trade (x+m) and net trade (x-m) as ratios to GDP (%) Source: Aylık Ekonomik Göstergeler [multiple issues], Ankara: T.C. Başbakanlık Hazine Müsteşarlığı.
The United States’ financial crisis began to erupt in 2007, after which it went global, reaching its climax in 2008–2009. This also affected the Turkish economy very adversely, causing a 4.8 percent decline in 2009’s GDP, yet the trade deficit remained high despite a significant decline in domestic demand (Figures 1 and 2).

Figure 2 GDP growth rate and contributions of domestic and external demands to GDP (%) Source: Aylık Ekonomik Göstergeler [multiple issues], Ankara: T.C. Başbakanlık Hazine Müsteşarlığı.
The overvalued Turkish lira and high domestic interest rates attracted foreign funds, which beginning in 2010 had begun to increase again on a global scale. This created high domestic demand-led growth rates, as had also been the case prior to 2008–2009. Consequently, both the trade and current account deficits surged considerably, which was further aggravated by increasing oil prices during 2010–2011 (Figure 2).
Beginning in 2012, GDP growth became modest, with the source of growth alternating between domestic and external demand. Additionally, oil prices started to decrease toward the end of 2014, but trade and current account deficits continued at considerably high levels.
The share of Turkish exports had been increasing before plummeting in 2009, together with world exports as a whole, as shown in Figure 3. Despite a strong bounceback in subsequent years, the path of Turkish exports exhibited an erratic but overall downward-sloping trend, one that converged with the global trend. Yet the slope of Turkish exports was steeper, dropping more rapidly than world exports (Figure 3).

Figure 3 Growth of Turkish and world exports (%) Sources: World Trade Organization (WTO), International Trade Statistics [multiple issues] Geneva: WTO and World Trade Organization (WTO), World Trade Statistical Review 2016 (Geneva: WTO, 2016).
Turkey’s competitiveness in terms of commodities and with respect to partners
Turkey’s top export commodities are presented in Table 1 from the viewpoint of certain performance criteria as well as in terms of technology intensiveness. Their share in the total exports of the country in 2015 was 76 percent. However, the net trade in these commodities reflected a deficit of 38,763 million US dollars, which comprised 61.1 percent of Turkey’s total trade deficit for the year.
Table 1 Top 20 sections of commodity exports of Turkey (2015, HS)

Source: Compiled and calculated from Turkstat, ITC and UNCTADSTAT.
(*) The product-specific net trade values given in this column should be examined with caution, taking into consideration that these are not value of exports net of imported inputs. Please see Figure 1 for the definition of net trade within the context of this paper.
(**) UNCTAD. Trade and Development Report. New York and Geneva: United Nations, 2002.
(***) Star: a product that is growing faster than world trade in real terms; traditional product: its market share is high but its world demand is declining or growing at below the world average rate; snail: the world demand for this product has been stagnating or declining and its market share is also low; emerging product: its market share is low in a high-growth sector (ITC).
Sources: Türkiye İstatistik Kurumu (TÜİK), www.tuik.gov.tr; International Trade Centre (ITC), “Trade Competitiveness Map,” http://tradecompetitivenessmap.intracen.org/; and United Nations Conference on Trade and Development (UNCTADSTAT), “Reports,” http://unctadstat.unctad.org/wds/ReportFolders/reportFolders.aspx?sCS_ChosenLang=en.
From the point of view of technology intensiveness, twelve commodity sectors out of twenty can be classified as primary commodities, labor-intensive and resource-based manufactures, or both. Three of those that are labor-intensive and resource-based manufactures—namely, “pearls, precious stones, precious metals and articles thereof” (HS71Footnote 10 ); “articles of apparel and clothing accessories, knitted or crocheted” (HS61); and “articles of apparel and clothing accessories, not knitted or crocheted” (HS62)—are identified by the Balassa and Lafay indicesFootnote 11 as being the most specialized and most competitive industries among the twenty total sectors. They rank third, fourth, and seventh respectively in terms of their share in total exports, and each of them also has much higher trade surpluses as compared to the other sectors. Two of them, HS71 and HS62, have recently been increasing their share in world markets, whereas HS61 suffers from a demand problem despite having a high market share (4 percent). The six commodity sectors that are either primary commodities or labor-intensive and resource-based manufactures—namely, “edible fruits and nuts; peel of citrus fruit or melons” (HS08); “furniture” (HS94); “salt; sulphur; earths and stone; plastering materials, lime and cement” (HS25); “preparations of vegetables, fruit or other parts of plants” (HS20); “carpets and other textile floor coverings” (HS57); and “other made up textile articles; sets; worn clothing and textile articles; rags” (HS63)—have a degree of specialization and are competitive in world markets, as indicated by the Balassa and Lafay indices. All of these sectors have trade surpluses. The performance of HS57 is particularly remarkable: it has a very large share in world exports (13.7 percent) and quite a high rate of annual growth (11.7 percent). The remaining three commodity sectors are “mineral fuels, minerals, oils and products of their distillation” (HS27); “cotton, cotton yarn and cotton textiles” (HS52); and “man-made filaments” (HS54). HS27 has no competitive power: it basically encompasses the fuels for which Turkey is a major net importer in large amounts. Although both HS52 and HS54 have some degree of specialization, they lack competitive power, as is suggested by their Lafay index values.
According to the Balassa and Lafay index values, Turkey is neither specialized nor competitive in “nuclear reactors, boilers, machinery and mechanical appliances; parts thereof” (HS84) and “electrical machinery and equipment and parts thereof” (HS85), and it is not competitive in “plastics and articles thereof” (HS39). There are large trade deficits in all three areas. However, the market prospects for HS84 and HS39, both of which are medium-skill and technology-intensive products, are quite promising. In HS85, which is a medium- and high-skill and technology-intensive product, Turkey’s world market share is a mere 0.3 percent.
Turkey’s best performance in a comparatively more technology-intensive product sector is “vehicles other than railway or tramway rolling-stock, and parts thereof” (HS87), which covers primarily road vehicles and their parts. These are medium- and low-skill and technology-intensive manufactures, and they rank first among the top twenty, with a share of 12.1 percent of total exports from Turkey in 2015. Although HS87’s net trade in 2015 is just below par, its contribution to export growth was 6.5 percent for the period of 2006–2015 as a whole.Footnote 12 Among the remaining four items out of twenty, only “articles of iron or steel” (HS73) shows any significant stance, with its considerable trade surplus and relative competitive power.
It is apparent that the net positive contributions to Turkey’s trade balance originate primarily from labor-intensive and resource-based manufactures and primary commodities. This aspect of Turkish exports points to the relative technological weakness of the Turkish economy.
Turkey’s competitive position among its trade partners also deserves analysis. The country’s top twenty partners in terms both of total merchandise trade as well as of certain critical comparative indicators are presented in Table 2. This table covers almost 69 percent of Turkey’s total trade, and it reflects 87 percent of Turkey’s total trade deficit. Nearly one-fourth of Turkey’s total merchandise trade is conducted with the top three economies in Table 2; i.e., Germany, China, and Russia. Turkey also has the largest trade deficits with the very same countries.Footnote 13
Table 2 Top 20 merchandise trade partners of Turkey (2015)

Source: Compiled and calculated from Turkstat; competitiveness data compiled from UNIDO statistics data portal; market type data from ITC. # calculated from ITC.
Note: (*) A negative sign represents a surplus.
(**) Dynamic market: Partner country’s annual import growth>annual growth of world market; Declining market: Partner country’s annual import
growth < annual growth of world market; (+) Turkey’s annual export growth to partner country>partner country’s annual import growth from the world.
Sources: TÜİK; competitiveness data from United Nations Industrial Development Organization (UNIDO), “UNIDO Statistics Data Portal,” https://stat.unido.org/; market type data is from International Trade Centre (ITC), “Trade Competitiveness Map.”
Turkey’s biggest trade partner is Germany, which ranks first in the United Nations Industrial Development Organization (UNIDO) competitiveness list (see Table 2); Germany’s share represents almost one-tenth of Turkey’s total trade. The annual growth of Germany’s imports from Turkey was higher than its annual import growth from the world during the period of 2011–2015; i.e., Turkey’s penetration into the German market was more successful than the rest of the world’s penetration into the same market. However, Turkey’s trade deficit with Germany increased by 5.1 percent annually over the very same period. Moreover, Turkey’s deficit with Germany was accumulated primarily in high- and medium-skill and technology-intensive manufactures. Turkey’s largest trade deficit is with China, which ranks second in Turkey’s total trade. While China is a dynamic market, Turkey has been gaining no advantage from this. High- and medium-skill and technology-intensive manufactures are major contributors to the deficit with China. Turkey’s trade deficit with Russia, on the other hand, is mostly in the fuel trade.
Turkey ranks higher than seven of twenty countries in terms of UNIDO competitiveness ranking; four of these are declining markets. Turkey’s deficits with these four countries are essentially in either primary commodities and labor-intensive and resource-based manufactures such as fuels (HS27), or in low-skill and technology-intensive manufactures such as iron and steel (HS72). Eight economies out of twenty are listed in Table 2; these are dynamic, and Turkey was able to benefit from their dynamism in only half of the eight—namely, the United States of America, Switzerland, Romania, and Poland. Turkey has not been successful enough to penetrate the remaining four dynamic markets—namely, China, Iraq, the United Arab Emirates, and Saudi Arabia.
Degree of diversification of Turkish merchandise exports: what they indicate and their significance
Product diversification is important for several reasons. First and foremost, it is a well-known fact that a more diverse structure of exports reduces vulnerability to external economic and political risks. Neto and Romeu, for instance, found that product diversification attenuated the trade collapse in Latin American countries during the 2008–2009 crisis.Footnote 14
Many studies have indicated a link between growth and diversification.Footnote 15 Export diversification is linked to economic growth via the growth of exports. Hence, diversification of exports, and particularly diversification in manufactured goods, is considered to be an indicator of climbing the ladder of development.
A seminal paper by Imbs and WacziargFootnote 16 showed that, along the development path, sectoral diversification initially increases—probably as a result of the dynamic evolution of relative productivity and a fall in transport costs—but, beyond a certain level of per capita income, it begins to concentrate again; i.e., the sectoral distribution of economic activity has an inverted u-shaped pattern with regard to per capita income. It was Imbs and Wacziarg themselves who first sought an answer to the question of the level of income beyond which concentration begins again, and they found that it was at around 9000 in 1985 PPP US dollars.Footnote 17 At the same time, their empirical work indicates that it is the interaction between income per capita and openness that determines the stages of diversification. According to Cadot et al., the level is 25,000 in constant 2005 US dollars.Footnote 18 It seems that Turkey still has quite a distance to cover to begin to concentrate again, and thus it should continue to move in a way of development that goes together with better diversification opportunities and a more productive use of funds, as has been shown by Acemoglu and Zilibotti.Footnote 19 Figure 4 below shows the export diversification index valuesFootnote 20 for Turkey and certain countryFootnote 21 groupings. The index values for Turkey indicate that the structure of Turkish exports has clearly improved in converging with the world structure and to the selected groups, although a significant distance remains to be covered. Over a period of 14 years, Turkey’s index value dropped by 27.4 percent, from 0.583 to 0.423.

Figure 4 Diversification of Turkish merchandise exports vis-a-vis selected groups of economies Source: (UNCTADSTAT), “Reports.”
Researchers have also been attracted by the decomposition of diversification into extensive and intensive margin growth, i.e., broadly speaking, the increase in product lines and the increase in the amount exported through existing product lines. It has been widely observed that intensive margin growth dominates the overall growth of exports. Cadot et al. stated that 14–40 percent of trade growth is usually attributable to the extensive margin,Footnote 22 as other studies have shown as well. Among recent studies, Brenton and Newfarmer found that 80.4 percent of export growth in the period of 1995–2004 was due to intensive margin growth; this was 65.2 percent for low-income countries and 85.9 percent for high-income countries.Footnote 23 A recent World Bank report on Turkish trade reported that 65 percent of export growth in the period of 2002–2011 was from intensive margin growth.Footnote 24
In contrast to this matter, geographical diversification has attracted little attention in the economic literature.Footnote 25 The aforementioned World Bank report on Turkish foreign trade found that only 15 percent of the export growth of the firms in the period of 2002–2011 was due to entrance into new markets.Footnote 26
Where does Turkey stand?
Levels of technology intensiveness and the Turkish merchandise trade
As shown in Figure 5, which represents Turkey’s 2000–2012 merchandise trade specialization indexFootnote 27 for different levels of skill and technology, Turkey’s significant negative trade balance is the consequence of high- and medium-skill and technology-intensive trade. There are some positive developments in the trends of all categories, excluding high-skill and technology-intensive manufactures and excepting a slight upward move toward the end of the period. While Turkey’s dependence on labor-intensive and resource-intensive manufactures shows a significant decline through the period under investigation, there were positive developments in the performances of both low- and medium-skill and technology-intensive manufactures; the latter, however, remains in the negative zone. The overall picture indicates that Turkey is far from being a high-skill and technology-intensive economy, but it has covered some distance toward becoming a medium-skill and technology-intensive economy. Nevertheless, Turkey remains an economy the majority of whose exports are essentially confined to labor- and resource-intensive, low-skill, and technology-intensive manufactures.
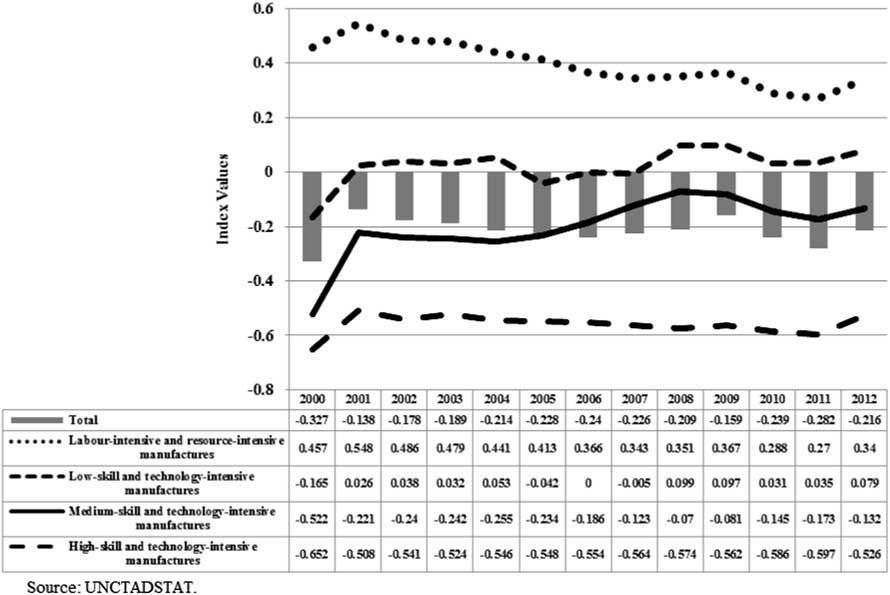
Figure 5 Turkey's Merchandise Trade Specialization Index (2000-2012) Source: (UNCTADSTAT), “Reports.”
Innovation trends in Turkey and its leading trade partners
Table 3 below provides Innovation Index values for Turkey and its major trade partners, based on data from the European Innovation Scoreboard (EIS).Footnote 28 Turkey’s progress in this regard was quite outstanding: its performance in terms of the annual growth rate of the innovation index is second only to Serbia among all listed European countries. Turkey certainly made a great leap in 2015, moving up from the group of “modest innovators” to that of “moderate innovators.” The 2016 report states that, although there were improvements in nearly all dimensions, the sharp increase in Turkey’s 2015 performance is due primarily to the relatively strong performance in firms’ non-R&D innovation expenditures (43 percent)Footnote 29 and sales share of new product innovation (24 percent).Footnote 30
Table 3 Innovation Index
Source: Calculated from the European Innovation Scoreboard 2016.
Source: European Commision, European Innovation Scoreboard 2016 (Belgium: European Commision, 2016).
However, the gap between Turkey and the leading figures—such as Switzerland, Germany, the United States, and South Korea—remains very large. Moreover, the annual innovation growth rates of China and South Korea are quite outstanding as well.
Acquiring technology through imports: diversification of Turkish merchandise imports
In a seminal paper, Krugman showed that even countries with identical tastes, technologies, and factor endowments benefit from trade owing to an increased choice of goods.Footnote 31 However, when an economy imports new products, domestic producers of close substitutes have to improve their performance in order to compete, and in this situation less productive firms are eventually forced to exit the market.Footnote 32 As a consequence, average productivity increases. This may also happen after a tariff reduction. In 1984, Turkey implemented a broad and drastic import liberalization program in order to significantly reduce both tariff and non-tariff barriers, and when Levinsohn investigated the impact of this development on Turkish industry, he found strong support for his imports-as-market-discipline hypothesis; i.e., forcing firms to behave more competitively leads them to become more productive through competitive imports.Footnote 33 In a more recent study by Yılmaz and Özler examining the effects of declining protection rates on the productivity of Turkish manufacturing industry for the period of 1983–1996, it was found that the productivity gains were statistically significant, especially in import-competing sectors.Footnote 34
The productivity growth caused by increased varieties of imported inputs is mostly realized through declining input prices and access to higher-quality inputs and new technologies, with imports of capital equipment forming another channel through which technology may transfer.Footnote 35 Keller, however, has argued that a certain type of skill is required to be capable of successfully adopting imported technology,Footnote 36 and Acharya and Keller found that, although imports are often a major channel in technology transfer, some countries benefit more from foreign technology than others, indicating that there are important differences in absorptive capacity, which could be related to domestic R&D investments or levels of education.Footnote 37
Figure 6 gives the import diversification index values for Turkey and certain country groupings.Footnote 38 Starting in 2005, the structure of Turkish imports shows a trend diverging from the world pattern, then making another upward move in 2011, with 2013 being a year of downturn toward the world average. The 2014 level was still 15.5 percent higher than the 2000 level. Turkish imports are less diversified than those of BRICS, which is also distant from the converging patterns of the EU, EI (Emerging Industrial) economies, and UMI (Upper Middle Income) economies. This pattern of Turkish imports can be interpreted as indicating that the Turkish economy is less open to technology transfers through imported goods relative to most of its peers and trade partners.

Figure 6 Diversification pattern of Turkish imports vis-a-vis selected economic groups Source: (UNCTADSTAT), “Reports.”
A closer look at Turkish competitiveness in terms of technology
In terms of technology intensity, there have been some recent setbacks in both trade and production (see Figure 7). Despite the significant increase in per capita manufactured exports in current US dollars, as represented by the bubble size,Footnote 39 the share of manufactured exports among total exports began to drop from 2005, while the share of medium- and high-tech products among total manufactured exports has stagnated during the same span of time.

Figure 7 Trade and production structures in Turkey Source: UNIDO, “UNIDO Statistics Data Portal” and T.C. Başbakanlık Hazine Müsteşarlığı, Aylık Ekonomik Göstergeler.
In terms of production structure, the picture is somewhat gloomier.Footnote 40 The per capita manufactured value added in 2005 US dollars increased from 1,063 US dollars in 1995 to 1,799 US dollars in 2014—an increase of only about 1.7 times over approximately two decades. Moreover, the share of manufacturing value added in GDP dropped from 22 percent in 1995 to 16 percent in 2014, and in an almost continuous way. The share of medium- and high-tech value added in total manufacturing value added has recently shown some signs of weakness as well: although it increased almost continuously between 1995 and 2010, from 28 percent to 32 percent, in 2014 there was a decline of two percentage points relative to 2010.
Table 4 displays, from a technology perspective, the exports of Turkey and those major trade partners with whom it has a considerable trade deficit. In terms of both medium- and high-tech manufacturing value added and exports, Turkey’s rank does not lie at a point of outstanding importance. With its share of 1.05 percent of world manufactures exports, Turkey ranks above only Ukraine and Iran; however, both of these countries’ medium- and high-tech manufacturing value added shares in their total manufacturing value added are higher than Turkey’s. Turkey is in a much better situation in the area of medium-tech manufactures relative to high-tech ones; in terms of its high-tech manufactured exports’ share of world exports, it is as weak as Ukraine and Iran. In fact, Turkey’s trade deficits against Iran, Ukraine, and Russia lie essentially in primary commodities and labor-intensive and resource-based manufactures; namely, fuels or low-skill and technology-intensive manufactures, such as iron and steel products.
Table 4 Technology-intensive exports of Turkey and its major negative net trade partners (2013)
Note: MVA: manufacturing value added; MT: medium technology; HT: high technology.
Source: Compiled and calculated from UNIDO, Industrial Development Report 2016 (2015) and ITC.
Sources: United Nations Industrial Development Organization (UNIDO), Industrial Development Report 2016: The Role of Technology and Innovation in Inclusive and Sustainable Industrial Development (Vienna: UNIDO, 2015) and ITC, “Trade Competitiveness Map.”
Turkey’s share of medium- and high-tech manufactured exports among world exports was a mere 0.28 percent in 2013, but this was still higher relative to Russia, Ukraine, and Iran. In contrast, the performances of countries that have a major trade surplus with Turkey are superior to Turkey in terms of the same indicator. These countries are, for the most part, the leading exporters of medium- and high-tech products, and they have much larger shares in world manufactured exports as compared to Turkey (see Table 4).
Turkey’s top two merchandise trade partners are China and Germany (see Table 2). Their trade structures are depicted in Figure 8, vis-à-vis Turkey’s trade structure for the period of 1995–2014. In terms of medium and high-tech exports, Germany is far ahead of both China and Turkey, with its medium- and high-tech exports accounting for over 70 percent of its total manufactured exports, as well as being quite stable during most of the period under investigation. China’s performance has also been quite outstanding: its medium- and high-tech exports share in its total manufactured exports has been around 60 percent over the last decade, as against Turkey’s 40 percent. Although Turkey showed a significant performance during the period 1995–2005, by pushing the share of medium- and high-tech exports up from 23 percent to 41 percent, it lay stagnant around the latter magnitude in the period of 2005–2014. Furthermore, in 2013, Turkey’s medium- and high-tech manufactured exports consisted almost entirely of medium-tech products, whereas the share of high-tech products in total medium- and high-tech manufactured exports was almost 20 percent for Germany and a notable 44 percent for China.

Figure 8 Trade structure in Turkey, China and Germany, selected years, 1995-2014 Sources: UNIDO, “UNIDO Statistics Data Portal” and T.C. Başbakanlık Hazine Müsteşarlığı, Aylık Ekonomik Göstergeler.
In 2015, 70.8 percent of Turkey’s trade deficit accumulated in five commodity sectors and 10 countries (see Table 5). For the countries listed in Table 5, the deficit commodities are as follows: fuels and others (HS27), with 30.85 percent; boilers and others (HS84), with 15.57 percent; electrical and electronic equipment (HS85), with 13.26 percent; iron and steel (HS72), with 8.88 percent; and aircraft and others (HS88), with 2.24 percent. These observations suggest that serious efforts are needed in terms of both policymaking and implementation so as to narrow such trade deficits. While technological upgrading of the Turkish manufacturing industry is required to increase its competitiveness, it is also necessary to increase the efficiency of resource utilization, as well as seriously considering replacing imported inputs, particularly energy inputs, with domestic ones.
Table 5 First 12 industry-partner country combinations in Turkey’s trade deficit (2015, HS)

Where does Turkey stand in regards to the future?
There is a significant gap between Turkey and the majority of its trade partners in terms of technology advancement capacities (see Table 6). In terms of capacity for innovation, in 2012–2013 Turkey ranked twelfth among the thirteen countries listed in Table 6, with a grade of 3.7, indicating that the weighted average of Turkish companies’ capacity to innovate is just over halfway between zero and the maximum grade in terms of innovative capacity. Turkey’s grade is just above Iran’s and slightly below the joint grade of Russia and Spain; however, it is much lower than the grades of such leading countries as the United States, Switzerland, Germany, and the United Kingdom.
Table 6 Some indicators of technology advancement capacity of Turkey vis-à-vis its major trade partners

Source: (1) World Economic Forum and INSEAD, (2) Cornell University, INSEAD, and WIPO, (3) UNDP Human Development Report 2015, (4) Eurostat.
Notes: (*) 2013-2014 weighted average of the capacity of companies to innovate; graded from 1 (not at all) to 7 (to a great extent).
(**) Figures have been rounded off.
na: not available.
Sources: World Economic Forum and Institut Européen d’Administration des Affaires (INSEAD), The Global Information Technology Report (Geneva: World Economic Forum and INSEAD, 2015); Cornell University, INSEAD, and World Intellectual Property Organization (WIPO); The Global Innovation Index 2016: Winning with Global Innovation (Ithaca, Fontainebleau, and Geneva: WIPO, 2016; andUnited Nations Development Program (UNDP), Human Development Report 2015 (New York: UNDP, 2015).
As Fagerberg has quite succinctly expressed, the most efficient way to improve competitiveness, especially in the longer term, is to support innovation in and diffusion of technology.Footnote 41 R&D expenditures are the most cited indicators relating to innovation and technological advancement. Several R&D indicators are given in Table 6, where the Turkish ratio of total R&D expenditures to GDP is higher than that of both India and Iran and quite close to the figures seen for Russia, Spain, and Italy. However, sectoral disaggregation on an institutional basis reveals a somewhat different picture, indicating that Turkey has the lowest ratio for the business enterprise sector. This last point has serious implications, since it is precisely the business sector that is expected to transform technological knowledge into the production line. The same table also contains figures for the number of researchers per million people; in this respect, Turkey’s performance is, again, better than those of India, Iran, and even China.
Figure 9 provides the medium- and high-technology content of merchandise exports against the ratio of R&D expenditures to GDP for Turkey and those countries that have significant trade surpluses with Turkey. The three countries in question—Russia, India, and Iran, which are below the regression line and close to the origin—are Turkey’s basic fuel (HS27) providers. The others are mainly providers of medium- and high-technology products.

Figure 9 Medium and high technology content of merchandise exports and R&D expenditures/GDP in Turkey and its major negative net trade partners (2013) Source: Tables 4 and 6 and European Commission, Eurostat, http://ec.europa.eu/eurostat/.
Although ratios are of course important in making international comparisons, the situation turns out to be more concrete and striking when the figures are given in absolute terms, as in Figure 10. In terms of total funds made available for R&D and the number of researchers, India shows quite a different picture, while Turkey is left in a position better than only Iran. Also striking is the fact that there is a huge gap between Turkey and the majority of its trade partners in terms of both absolute magnitudes of R&D funds and the number of researchers.Footnote 42

Figure 10 R&D expenditures and number of researchers in Turkey and its major trade partners (2014) (*) Sources: Table 6 and World Bank, “World Development Indicators,” http://wdi.worldbank.org/table/2.1.
What is more, increasing the volume of R&D expenditures is not enough on its own: it requires a sufficient number of qualified researchers to either absorb or innovate technology and convert it into industrial production. Hence, in meeting the global technology challenge, both quality and quantity are of the utmost importance in terms of human capital. It is quite widely accepted that the contribution of (qualified) human capital to a country’s technological capacity is crucially important. For instance, Murphy and Schleifer have shown that it is in countries of high human quality that high-quality production is realized.Footnote 43 Similarly, Aiginger has pointed out that economies with higher shares of skilled labor, advanced production technology, knowledge-intensive activities, and modern communication technologies will produce products of higher quality.Footnote 44 In a more recent study, covering 178 countries for the period of 1962–2010, Henn et al. showed that human capital, institutional quality, and resource allocations are critical, especially for increasing quality in the manufacturing sector.Footnote 45 The existence of a contemporary education system compatible with the requirements and challenges not only of the present but also the future is much more than just a necessity for Turkey, especially when we take into consideration the poor PISA (Program for International Student Assessment) performances of young Turkish students.Footnote 46
Overview and concluding remarks
Persistent large trade deficits, together with the recently accelerating decline in exports relative to the world, are a serious point of concern for the Turkish economy. This study has approached the matter from the perspective of trade deficits, focusing on export performance with a special emphasis on the technology dimension, and it has shown that the large Turkish trade deficits are mostly structural in nature and essentially the result of trade in sectors where Turkey is technologically weak.
Almost one-fourth of Turkey’s total merchandise trade is with Germany, China, and Russia. Turkey’s largest trade deficits are also with the very same countries, accumulating primarily in high- and medium-skill and technology-intensive manufactures, apart from fuel in the case of Russia.
Net positive contributions to Turkey’s trade balance originate largely from labor-intensive and resource-based manufactures. Turkey’s dependence on these products showed a significant decline in the 2000s, and while there have also been positive developments in the performances of both low- and medium-skill and technology-intensive manufactures, this latter remains in the negative zone. The overall picture indicates that Turkey is far from being a high-skill and technology-intensive economy, but it has nonetheless covered some distance toward becoming a medium-skill and technology-intensive economy.
The diversification index values for Turkey also indicate that the structure of Turkish exports has clearly improved in terms of converging with the world structure, although in this regard, too, it still has significant distance to cover.
The pattern of Turkish imports can be interpreted as indicating that the Turkish economy, relative to most of its peers and trade partners, is less open to technology transfers through imported goods, as is suggested by the import diversification index values. Even so, recent empirical studies have found that there have been some productivity gains, especially in the case of import-competing industries.
Neither the present levels of R&D expenditures nor the number of researchers will move the Turkish economy to a technological standard sufficient for successful competition in future world markets. It is also critical that Turkey increase the R&D expenditures ratio for the business enterprise sector, as it is precisely the business sector that will transform technological knowledge into the production line.
It must be emphasized, however, that it is not enough simply to increase the volume of R&D expenditures; it also requires a sufficient number of qualified researchers to either absorb or innovate technology and, further, to convert technology into industrial production. As such, in order to meet the global technology challenge, both quality and quantity are of supreme importance in terms of human capital. It is also imperative that a contemporary education system compatible with the requirements and challenges of both the present and the future be developed.
Overall, a new paradigm is essential for the restructuring of the Turkish manufacturing sector in line, especially, with the requirements of the future world. Industrial policy needs to be redesigned and coordinated together with trade policy: both should be part and parcel of each other. The basic policy package must aim at transforming the economic structure, particularly the structure of and the quality of production in Turkish industry, with special emphasis on improving efficiency in resource utilization in general and in energy in particular, something that will also call for technological upgrading.


