


Introduction
The Conservative Government, led by Theresa May from summer 2016, has stated its intention to remove the existing ban on opening new grammar schools in England, paving the way for the expansion of existing selective provision and new grammar schools in parts of England where they have not been seen for up to 50 years. The stated purpose of this new policy is to make “this country a true meritocracy – a country that works for everyone” (Prime Minister's Office, 2016). The Secretary of State for Education has stated that “lifting the ban that stops communities choosing new selective school places” is essential if “we are to shift up a gear in social mobility in our country” (Department for Education and The Rt Hon Justine Greening MP, 2017). Politicians' difficulty is that, in the 163 grammar schools that currently exist, pupils who are not eligible for free school meals are around six times more likely to attend than those who are (Reference Cribb, Jesson, Sibieta, Skipp and VignolesCribb et al., 2013).
Attendance at one of the 163 remaining grammar schools requires the parent, the child, and often their primary school to make a number of decisions, each of which might contribute to social inequalities in attendance rates. We provide new evidence on how this process works in Kent, a very large local authority in South-East England with 32 selective and 67 non-selective schools. The data allow us to present new, up-to-date evidence on how social disadvantage affects performance in different elements of the test and what types of pupils are successful in the headteacher appeal.
Background literature on academic selection
Most countries across the world track students into different types of educational institutions at some stage, but the age at which this takes place varies considerably. Economists make clear the trade-offs between the gains to student specialisation and the costs of tracking, with the optimal timing of tracking depending on the skills mix required in the economy (Reference Ariga and BrunelloAriga and Brunello, 2007). The implication of this is that as economies shift towards needing a larger proportion of the workforce with a general, academic education, early (i.e. younger than 15) academic selection of pupils is no longer optimal and can damage GDP through misallocation to tracks (Reference Brunello, Rocco, Ariga and IwahasiBrunello et al., 2012). Early tracking, such as that seen in Germany and Austria, does not generally raise mean educational attainment in the country and there is some cross-country evidence that it may even reduce it (Reference Hanushek and WossmannHanushek and Wossmann, 2006). But equally, tracking too late may lower average academic performance (Reference Ariga and BrunelloAriga and Brunello, 2007).
There are a number of studies that explore the impact of academic selection at age 11 for those areas where it remains in England. All these studies face the same major identification difficulties. Firstly, the local authorities who chose to retain academic selection in the 1960s and 1970s are more affluent than those who did not. Secondly, academic selection itself triggers huge cross local authority movements; one-in-five grammar school students currently cross a local authority border on their journey to school (Reference AllenAllen, 2016a). This in itself is likely to overstate the benefits of selective schooling systems. Finally, selection affects the kind of students who attend private schools in both the primary and secondary sectors, and we lack full demographic and attainment information on private school attendees. As many as 13 per cent of those recently completing their education at grammar schools appear to have attended a private primary school (Reference NyeNye, 2016). Aside from these identification hurdles, interpretation of estimates is difficult where selective and non-selective systems are highly heterogeneous.
Bearing in mind these identification difficulties and the different methods that studies use to address them, the academic studies that do exist generally agree that the remaining selection at age 11 creates both winners and losers. Pupils attending grammar schools make gains in the order of one-third to two-thirds of a grade per subject, compared to attending a comprehensive school. Pupils attending secondary moderns (i.e. schools where students go who do not pass the eleven-plus exam) achieve lower grades, though perhaps just one tenth of a grade less per subject (Reference Atkinson, Gregg and McConnellAtkinson et al., 2006; Reference Coe, Jones, Searle, Kokotsaki, Kosnin and SkinnerCoe et al., 2008; Reference Levačić and MarshLevačić and Marsh, 2007). It is often said that, since there are three times as many pupils in secondary moderns as there are in grammar schools, the overall impact could be zero. However, this would be an incorrect inference that treats grades as falling on a ratio rather than ordinal scale. This estimated loss of attending a secondary modern school is sometimes statistically insignificant though; given how porous county borders make it difficult to classify a secondary modern, it would not be surprising if it were seriously attenuated (Reference AllenAllen, 2016b). No study has found that lower attaining students make academic gains in selective schooling areas.
Academic selection necessarily exposes different sets of pupils to quite different peer groups and thus classroom behaviours, which in themselves alter their educational experiences. But Reference AllenAllen (2016c) explains that there are likely to be other reasons why disparities in the quality of schooling are greater in selective school areas. Selective systems have far more pronounced inequalities in access to suitably qualified teachers than do non-selective systems. Compared to secondary moderns, grammar schools have fewer unqualified or inexperienced teachers, more teachers with an academic degree in the subject they teach and lower teacher turnover overall.
It is still valuable to look to studies that estimate the impact of academic selection for those who were born in 1958 and 1970. The birth cohort studies are incredibly rich, compared to the modern-day studies that rely on administrative data. That said, they do explore the impact of attending a comprehensive school at a time when they were very new; in fact, many cohort members spent time in both selective and comprehensive systems. Furthermore, the secondary moderns were quite different to those operating today because teachers did not necessarily have degrees and students did not sit the same academic qualifications. Reference Galindo-Rueda and VignolesGalindo-Rueda and Vignoles (2004) do find that the most able pupils in the selective school system did better than those of similar ability in the mixed ability school system, with no negative effects of tracking for low ability students. Reference Dearden, Ferri and MeghirDearden et al. (2002) show that, as a consequence, the men (not women) go on to achieve higher wages at age 33. But care with interpretation of findings is needed since those in selective systems also make faster academic progress during primary school, perhaps due to tutoring or because models are poorly specified (Reference Pischke and ManningPischke and Manning, 2006).
While the literature is quite equivocal about what timing of academic selection produces the distribution of academic attainment that society desires, it is unambiguous about its impact on children who come from more disadvantaged families. Grammar schools, at least as currently set up in parts of England, cannot benefit the vast majority of children from poorer families because they do not attend them. Just 2.5 per cent of pupils in grammar schools are eligible for free school meals, compared to 8.9 per cent of pupils in the surrounding neighbourhoods and 13.2 per cent of pupils nationally (Reference Andrews, Hutchinson and JohnesAndrews et al., 2016).
Reference Skipp, Vignoles, Jesson, Sadro, Cribb and SibietaSkipp et al. (2013) shows that these inequalities remain even where we compare pupils who achieve identical Key Stage 2 (KS2) marks at the end of primary schools. The magnitudes of these differences are quite large: they estimate that a free school meals (FSM) pupil achieving a high mark (a level 5) is one third less likely to get in than a similarly high-attaining non-FSM pupil. Reference Burgess, Crawford and MacmillanBurgess et al. (2017) create a socio-economic status index using rich neighbourhood measures based on the pupil's postcode and from it show that it is really only the very affluent who make it to grammar schools in significant numbers. Those at the very top of their SES index (the 99th to 100th percentile) have an 80 per cent chance of attending a grammar; towards the bottom of the SES index (the 20th to 40th percentile) the chances of attending are just 12 per cent. This makes it clear that there are some high attaining pupils from more disadvantaged households who do not make it to a grammar school.
Across the world, higher levels of social segregation are associated with the prevalence of academic selection (Reference Jenkins, Micklewright and SchnepfJenkins et al., 2008). The consequence of this is that countries with earlier academic selection tend to have greater educational inequality (Reference Hanushek and WossmannHanushek and Wossmann, 2006). In Switzerland, Reference Bauer and RiphahnBauer and Riphahn (2006) show that delaying the timing of academic selection improves educational mobility and reduces the educational advantage of the children of better educated parents. This finding is replicated in a state in Germany where academic selection is delayed for two years compared to the rest of the country, with clear positive effects for pupils with a less favourable family background and for those towards the lower end of the attainment distribution (Reference MühlenwegMühlenweg, 2008).
In England, Chris Reference CookCook (2016) showed that pupils living in disadvantaged wards in selective areas have far lower educational outcomes than similar pupils in comprehensive areas. Reference Burgess, Dickson and MacmillanBurgess et al. (2014) also compare selective and non-selective schooling areas in England to show how these inequalities in access to selective schools affect adult earnings inequality. They claim the wage distribution for individuals who grew up in selective schooling areas is quantitatively and statistically significantly more unequal. Similarly, Finnish comprehensive school reform of 1972–7 has been shown to reduce the intergenerational income correlation by 7 percentage points (Reference Pekkarinen, Pekkala and UusitaloPekkarinen et al., 2009). In a cross-country study, Reference Brunello and ChecchiBrunello and Checchi (2007) agree that parental background effects on early labour market wages are stronger in countries where tracking starts earlier. These trade-offs are clearly shown in the Swedish comprehensive reforms of the 1950s, with the children of those with little education benefiting and those of highly educated parents earning somewhat less (Reference Meghir and PalmeMeghir and Palme, 2005).
The Government's case that grammar schools can help social mobility hinges on a single observation that can be found across multiple datasets: FSM pupils who attend grammar schools appear to benefit more from the experience than non-FSM pupils who attend grammar schools. But there are currently only 500 of such pupils in a typical cohort and we can observe that they are less likely to have spent an extended period of time eligible for FSM (18 per cent are long-term FSM, compared to 35 per cent in comprehensives). In any case, even if highly able FSM pupils were capable of benefiting from selective education, it would still damage social mobility if the majority of their FSM peers failed an eleven-plus exam.
The eleven-plus in Kent
The analysis in this paper utilises data obtained by Freedom of Information Act from the county of Kent (excluding Medway) in the south-east of England. Kent comprises both rural and urban communities, from the wealthy commuter-belt towns in the west to the more disadvantaged communities in the east. 9.5 per cent of secondary aged pupils are eligible for free school meals (FSM), compared to 13.2 per cent nationally. 82 per cent of these pupils are white British, with the next largest group (4 per cent) comprising those of White other nationalities who typically speak English as an additional language (DfE, 2016).
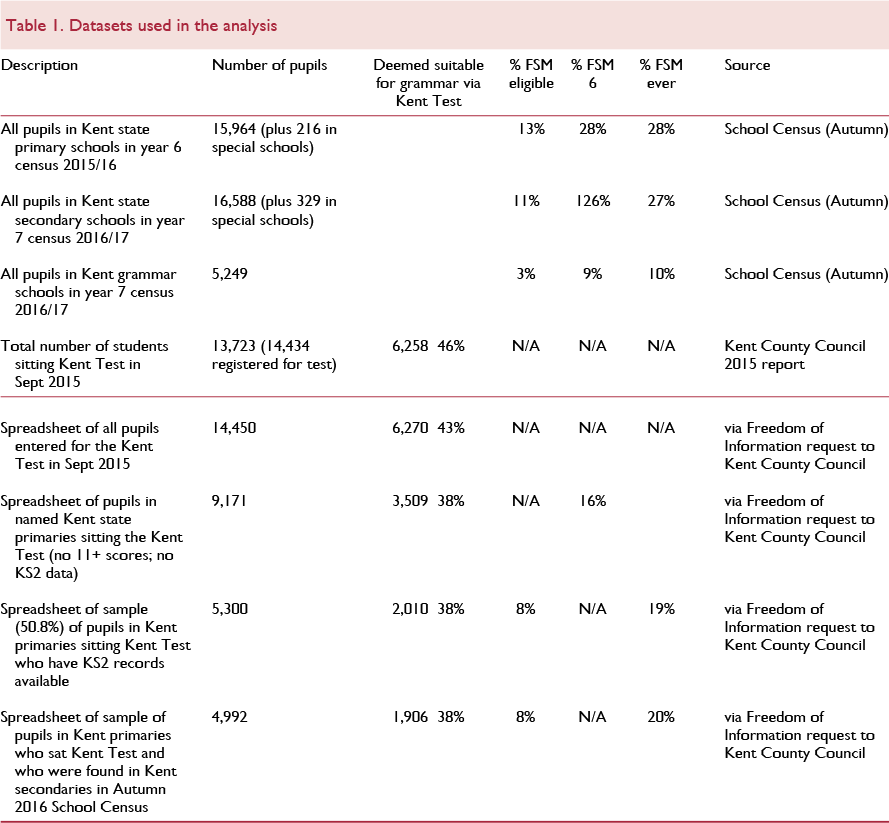
Kent has 67 non-selective secondary schools and 32 grammar schools, with 28 per cent of a cohort typically attending a grammar (Kent County Council, 2016). For the most part, our analysis utilises four spreadsheets of data relating to pupils who sat the eleven-plus in September 2015 for entry to grammar school in September 2016 (see table 1). One spreadsheet includes data on the population of test-takers, a second is the population of test-takers in Kent state primaries. The final two are circa 50 per cent random samples of test-takers who are in Kent state primary schools. All these spreadsheets tell us whether the student was entered for and/or passed the headteacher panel. Data availability means we switch our definition of disadvantage between those eligible for free school meals at age 10 (FSM), those who have been eligible in the past six years (FSM6) and those who have ever been eligible (FSM ever). All these metrics are less than ideal measures of income deprivation (Reference Hobbs and VignolesHobbs and Vignoles, 2010). Nevertheless, taken together they are capable of providing insight into some critical aspects of gaining a place at a grammar school.
In order to gain access to a grammar school, the parent, child and their primary school must go through the following process:
1. The parent must register the child for the eleven-plus test in the July before the exam. Kent does not currently run an automatic enrolment process for those living in the county – this is typical of almost all parts of England (except Buckinghamshire). It seems likely that there are social inequalities in entry rates to sit the eleven-plus and we cannot investigate them in this study.
2. The child may be prepared for the test, either by a school, tutor, parent, or otherwise. It is important to note that Kent specifically proscribes eleven-plus test preparation to be carried out in state primaries, and we review this decision later in our article (Reference ReadRead, 2015).
3. The child sits the eleven-plus test and their score alone may give them access to a grammar school. We provide a detailed analysis of this test in the next section.
4. Where a child does not automatically pass the eleven-plus test then their primary headteacher can choose to put them forward for consideration to a headteacher panel. We explore social inequalities in this process later in this paper.
5. Finally, the parent of a child not deemed suitable for a grammar can apply for a grammar school place and appeal after secondary school places are allocated. This is a risky and long drawn-out process, but typically results in 700 extra pupils being allocated a grammar school place each year (this figure includes those who passed but are appealing to an oversubscribed grammar). Parental appeals tend to be successful where a primary headteacher attends or at least provides academic evidence of grammar school ability. The May SATs results can make an important contribution to this (Reference ReadRead, 2015).
Passing the eleven-plus alone is not enough to gain entry to any grammar school of choice. Whilst most Kent grammar schools simply require an eleven-plus test pass, using catchment areas to deal with oversubscription, there are 11 ‘super-selective’ grammar schools which make use of the test scores to prioritise applicants for admission, either ranking all applicants by score, or prioritising those who have scored above a given level. To complicate matters further there are five (only four in 2015 when our pupils took the test) grammar schools who operate their own eleven-plus test, with children able to qualify for these schools under the council-operated Kent Test, or through the school's own test.
Figure 1 shows the significant variation in routes to gaining a grammar school place by school. Each bar represents a grammar school. At the top are the super-selective grammar schools where nearly all students achieved high enough eleven-plus paper marks to avoid the need to go through the headteacher panel. Also in the upper half are those in the west of the county where numbers passing the eleven-plus outstrip places available. This explains why primary and secondary heads are reluctant to allow too many students to be successful via the headteacher panel. Those schools in the bottom half are in parts of the county where headteacher panels are more generous in passing students. Finally, at the bottom are the Kent grammars who run their own additional test. (Note that this chart does not include the pupils who only take the school test and not the Kent test, but it does reveal huge numbers who fail the Kent Test and yet are likely passing the school's own test.)

Figure 1. Routes to attending each of 31 Kent grammars for a representative sample who attended Kent primaries and sat the Kent Test in September 2015
The Kent Test: social inequalities in marks achieved
The eleven-plus test, known locally as the Kent Test, is created by GL Assessment and administered by Kent County Council. Kent children take this test in their primary schools during September, with out-of-county children taking it the following weekend. Since 2014, it has comprised both reasoning and curriculum-aligned elements, the latter of which are designed to reduce the effect of coaching. Children are assessed in four different elements, from which three paper marks are awarded:
1. A 25-minute multiple-choice paper in English, testing comprehension, spelling, grammar and punctuation.
2. A 25-minute multiple choice paper in maths, with National Curriculum topics that should have been covered by able children by the start of year 6.
3. A reasoning test with about 20 minutes of test time on verbal reasoning, and 4–5 minutes of test time on each of non-verbal and spatial reasoning.
4. An unmarked writing exercise of 40 minutes, with 10 minutes for planning and 30 minutes for writing. This exercise is not part of the test but a headteacher panel may consider it as part of the process described in the next section of this paper.
Each of the first three test papers are marked and scores are age standardised. In 2015, the standardised scores had a lower cut-off at 69 for each paper with a maximum score of 141 (138 in English). The three scores are combined to decide whether a student should automatically be considered suitable for a grammar school according to the following rules:
• The student's aggregated standardised score across the three papers must be 320 or above;
• The student must score at least 106 in each of the three papers.
The second criterion is critical: although 7,804 students in 2015 achieved an aggregated score of 320 or above, 2,616 of these failed to achieve at least 106 on each of the three papers.
Figure 2 shows the total standardised score achieved for our sample of pupils who sat the test in Autumn 2015. It reveals the difficulty in helping FSM pupils achieve access to grammar schools: those few FSM pupils who take the Kent Test (8 per cent are FSM versus 13 per cent in county) are heavily weighted towards quite low scores and even those that pass the 320 mark often only just do so.

Figure 2. Total standardised score in three Kent Test papers, by FSM status
Comparing reasoning scores to English and maths
Table 2 shows how the FSM gap in scores varies across the three papers sat. It is largest in reasoning and smallest in English, consistent with the suggestion that reasoning is more susceptible to training since it is not explicitly taught in primary schools. This confirms that the decision to reduce the weighting of reasoning from two-thirds to one-third in 2014 is likely to have reduced social inequalities in test scores (and indeed the non-FSM/FSM ratio in mean aggregated scores has shrunk marginally from 1.10 in 2013 to 1.07 in 2015).

There are likely to be institutional differences in how students are prepared for the Kent Test within their primary school settings. Kent County Council does not allow state primary schools to prepare students for the test, which can place them at a disadvantage to those who attend private schools. That said, many state primary schools offer early booster lessons to ‘prepare for higher levels in the SATs’, which in turn will effectively prepare for the maths and English elements of the test. However, provisions such as these vary considerably across the state sector, with claims that it rather depends on whether the leadership of the school is supportive or opposed to grammar schools (Reference ReadRead, 2015).
We do have data on primary school attended, but these do not reveal the FSM status of the child. That said, we can look at whether this ‘reasoning premium’ over and above English and maths scores is present in particular types of primary schools. We would assert that a ‘reasoning premium’ suggests direct preparation for this paper has taken place, over and above general preparation to improve a student's performance across the curriculum.
In table 3 we show the results from three linear regressions that model a student's reasoning test score, conditional on their English and maths scores and the type of primary school they attended. The first columns of results show a reasoning premium of 3.7 points for those who attended a private school in Kent, relative to those in a Kent state primary with the same maths and English eleven-plus scores. Those sitting the test from outside Kent also achieve high reasoning scores in the order of 0.8 and 1.7 for state and private schools, respectively.

The second regression tests whether there is any difference in the reasoning premium across the Kent state primaries by religious designation. There is not. Finally, for those sitting the eleven-plus in a Kent state primary we explore whether there is an association between the size of the student's reasoning premium and the school's overall percentage FSM. Here we find that students from more advantaged schools have a greater reasoning premium. This may be because the school is discretely preparing them for the reasoning element of the eleven-plus or, more likely, that the school's % FSM acts as a proxy for the child's social background and therefore probability of preparation via private tuition or at home. The magnitude of this particular social gradient is not immaterial: a 10 percentage point fall in the school % FSM is associated with a 1.1 point increase in the reasoning premium a student achieves.
An obvious fix to this social inequality in reasoning scores is automatically to award all FSM students a small premium of, say, 3 extra standardised points on their reasoning test to compensate. But, aside from any obvious inequities for those from low-income households who are not FSM-eligible, it would not actually lead to a much greater proportion of FSM test-takers automatically passing the Kent Test. In the 2015 data we have it would have increased FSM test-takers' pass rate from 12 to 14 per cent, compared to a 32 per cent pass rate for non-FSM pupils. This acts as a reminder that many FSM test-takers are not achieving marks that are anywhere close to the pass boundary.
Comparing Kent Test scores to Key Stage 2 scores
We can compare Kent Test scores to subsequent Key Stage two (KS2) test scores, taken eight months later. Our inference from this type of comparison is necessarily limited, since much preparation for the eleven-plus will also directly raise KS2 attainment. However, it may reveal short-term eleven-plus test preparation that does not translate into higher performance eight months later. In our sample of test-takers from Kent state primaries, the correlations between Kent Test scores and KS2 marks for those sitting both are reasonably high: the English element of Kent Test shows a correlation of 0.62 with reading and 0.60 with grammar, punctuation and spelling (GPS) at KS2; both the maths and the reasoning elements of the Kent Test are correlated at 0.68 with the maths KS2.
If we simply rank this sample of pupils from the lowest to the highest overall KS2 score (across reading, maths and grammar), whilst holding constant the number deemed suitable for a grammar, then the rate of FSM pupils' access to grammar schools would increase from 12 to 16 per cent amongst test-takers. Interestingly, just 7 per cent of FSM pupils would get into grammar schools under both of these alternative allocations, a reminder of how many of those FSM pupils who pass the eleven-plus sit relatively close to the pass boundary.
Table 4 models eleven-plus paper outcomes, conditional on KS2 scores in reading, grammar and maths for test-takers in Kent state primaries. These are simply correlations without any suggestion of causation between the variables. It shows that FSM pupils achieve an overall eleven-plus standardised score that is 8.7 points lower than a non-FSM pupil who subsequently goes on to get the same KS2 achievement. It shows that FSM gaps are greatest in reasoning and smallest in English.

If we used this information routinely to add one standardised mark for English, three for maths and four for reasoning for FSM pupils, their entry rates to grammar schools are only likely to rise from 12 to 17 per cent. This serves as a reminder that FSM pupils in Kent perform almost as poorly on the KS2 SATs as they do on the eleven-plus test. The inequalities in academic attainment at age 11 might arise from a number of sources: private tutoring, primary school quality, home inputs into education and any differences in genetic endowments. If we want to improve access to grammar schools for FSM pupils and we want grammar schools to educate only those who are higher attaining, then developing a better understanding of how inequalities in academic capabilities arise in the first decade of a child's life would seem to be crucial.
The Kent Test: social inequalities in the headteacher panel
Passing the Kent Test via the reasoning, English and maths paper is not the only way to be deemed suitable for a grammar school place. Each year 4–6 per cent of the cohort are deemed suitable via a headteacher panel. Before parents are told the outcome of the eleven-plus test, the child's primary school headteacher has the opportunity to refer any assessment decisions they disagree with to a panel of local primary and secondary school headteachers. They consider additional evidence – test scores, the ungraded writing task, and any recent work and assessments their headteacher provides – to decide whether the child would be well placed in a grammar school (Kent County Council, 2016). The headteacher panel reviews around 2,000 pupils each year, with approximately half the reviews leading to an assessment that the child is suitable for grammar school. There are currently four headteacher panels covering four geographical areas, and it is generally the case that those in the east are more generous in their decisions than those in the west. This simply reflects the pressure on grammar school places in each part of the county (Reference ReadRead, 2016).
In figure 3 we show the aggregated standardised score of those entered for the headteacher panel from all schools. Many of those entered for appeal achieved an aggregated score of over 320, but failed to reach the minimum mark in one or more individual papers. Additional analysis (not reported here) shows that the chances of being entered to the headteacher panel are not particularly influenced by how individual subject papers contribute to the overall score.

Figure 3. Numbers entered for headteacher appeal, by overall Kent Test score
Table 5 shows the proportion of pupils put forward for the headteacher appeal and being successful in this appeal (in both cases the denominator is all pupils who sat but did not automatically pass the Kent Test). It shows that FSM pupils are no more or less likely to be put forward for or be successful at appeal than any other pupil with the same overall Kent Test score. We confirm this with formal logistic regression analysis (available from the authors).

Table 6 shows the odds ratio estimates from four logistic regressions. The first two model the chances of being entered for the headteacher panel, conditional on individual paper scores and on type of primary school attended. The last two model the chances of being successful at the headteacher panel. Those who attend a Kent private school are equally likely to be entered for the panel but are less likely to be successful, compared to a Kent state school pupil with the same test scores. Perhaps not surprisingly, those at school outside Kent are much less likely to be entered for the panel. Within the state sector in Kent we see some evidence that Catholic primaries make less use of, and are less successful at the panel. The reverse is true for other (non-RC or CofE) religious primaries. Overall, primary schools serving more disadvantaged communities are not more likely to enter students to the panel and are only marginally more likely to be successful.

So, on the one hand this analysis of the headteacher panel reveals that FSM pupils are not disadvantaged by the process compared to others achieving similar scores. But it could be argued that we should expect them to achieve considerably greater success, for two reasons. First, given that we know their eleven-plus scores are lower than their KS2 attainment, it could be argued that the headteacher panel should be correctly identifying this greater academic potential for any given eleven-plus score achieved. Second, FSM-pupils more frequently live in the east of the country where the headteacher panel is more generous simply because more places are available. It is therefore of some surprise that they are not being passed through this process in greater numbers.
Implications for improving access to grammar schools
Kent parents, pupils and schools must go through a series of five stages to gain access to a grammar school. This process is different in each of the remaining selective local authorities across England, but all share the similarities of using a test followed by an opportunity to appeal the result of the test.
In our analysis we have focused on whether social inequalities are apparent in two parts of this process: marks achieved by those sitting the test and the headteacher panel. Our analysis of the eleven-plus test paper scores makes it clear that FSM pupils do not frequently achieve scores that are over or even close to the pass boundary, that they have specific difficulties in achieving a good mark in the reasoning element of the test, and that their eleven-plus scores are generally not quite as high as SATs tests suggest they should be. This suggests that there are a number of policies that could ensure marginal improvement in access for demonstrably able FSM pupils, but none would substantially equalise rates of access to grammar schools.
Our analysis of the headteacher panel shows that FSM pupils are neither more likely to be put forward to the panel nor are they more likely to be deemed by the panel to be grammar school material, compared to a non-FSM pupil with the same eleven-plus score. So this process does not help identify those FSM pupils who do not score highly on the eleven-plus and yet will achieve high KS2 scores the following May.
In 2016, Kent County Council's Select Committee made a series of recommendations aimed at ensuring “that young people who would thrive within a grammar school setting, irrespective of class or background, get the necessary support to access a grammar school place” (Kent County Council, 2016, page 8). As a statement, it leaves open the question of whether they want to see FSM pupils with significantly lower academic attainment at age 11 attending grammar school, or whether they seek a very marginal rebalance to secure access for those FSM students who we observe do well in their KS2 SATs tests. If it is simply the latter, then our analysis suggests two clear choices to raise the eleven-plus test scores of FSM pupils (ignoring the issue of categorising a complex and continuous notion such as social disadvantage into a binary indicator) to levels that better reflect their academic capabilities at age 11.
First, the eleven-plus score could be adjusted for a child's poverty status in exactly the same manner as they are for age of child, with the adjustment factor determined by data on the relationship between eleven-plus and KS2 scores from a prior year. Our analysis suggests the reasoning mark should be awarded the greatest adjustment, followed by maths and then English.
Second, the fact that the FSM gap in eleven-plus performance is greatest in the reasoning paper is almost certainly attributable to lack of test preparation. There is little doubt that practice and coaching can improve a student's performance in a test, but the extent to which it does so depends on the test and the background of the student. For example, Reference JensenJensen (1980) states coaching effects are slightly greater for non-verbal than for verbal tests, that more able pupils could gain more from the coaching than others, that practice effects are more important for tests with a time-limit and that there are generally diminishing returns to increased practice and coaching.
Reference Bunting and MooneyBunting and Mooney (2001) find that coaching for the eleven-plus in Northern Ireland improves test scores, but does not significantly change the rank order of students, provided they have equal access to coaching. They do find positive and substantial effects of sustained coaching over a period of nine months. Similar results are found in US SATs preparation (Reference MessickMessick, 1980; Reference ZwickZwick, 2004). Overall, this coaching literature suggests test preparation is likely to be material in determining who from amongst those with mid-range academic capabilities is passing the eleven-plus in Kent, but that those with lower academic capabilities are highly unlikely to pass, even with significant coaching. This very clear presence of a coaching effect suggests that Kent's barring of test practice in state primary schools is well-meaning, but likely to exacerbate inequalities since those with better educated parents will practise outside school.
That said, the very fact that there are large practice and coaching effects raises obvious concerns regarding the psychological interpretation of ability and learning assessment (Reference Snow, Yalow and SternbergSnow and Yalow, 1982). New psychological research shows how responsive older adolescent brains are to training in the type of cognitive skills used in the eleven-plus, which further undermines our confidence that generalised intelligence is impervious to coaching or that it is even well-determined by age 11 (Reference Knoll, Fuhrman, Sakhardande, Stamp, Speekenbrink and BlakemoreKnoll et al., 2016).
If Kent wishes to improve its access mechanism for those FSM pupils who might be academically able, though not high achieving at 11, then manipulation of the headteacher panel would seem to be a good means of doing so. At a minimum, the council could require primary headteachers to put forward all FSM pupils with an aggregated test score over 305 to the panel. They could even invite headteachers to put forward FSM pupils with strong classroom work who were not entered for the eleven-plus at all. But to favour those FSM pupils whose standard of classroom work is weaker than expected is highly controversial. We can only observe academic attainment so far, and not academic potential or capabilities. Since no lower attaining FSM pupils currently attend grammar schools, we have no idea what sort of quality of work should be deemed suitably strong to believe that they are likely to benefit from the experience.
In general, care should be taken in monitoring how headteacher panels make these highly subjective judgements on pupils. The international evidence on academic selection makes it clear that the process of selection is generally more inequitable where greater discretion is left with parents and their schools to decide which track a pupil is best suited to. Strict use of pupil performance data typically lowers social inequities in the selection process (Reference Korthals and DronkersKorthals and Dronkers, 2016).
The alternative to subjective judgements that compare FSM and non-FSM pupils with different standards of attainment so far is simply to make a fixed number of places available for children of lower income families at grammar schools. Kent County Council has asked the more selective grammar schools to consider doing this. By 2018 there will be 18 Kent grammars with FSM or pupil premium mentions in their oversubscription criteria; none have explicitly reduced the required test score (TES, 2017). This type of policy has been successful in Birmingham in raising the FSM rates at their grammar schools, though not in other areas (Reference AllenAllen, 2016d). This is most likely because Birmingham is a densely populated city with a large proportion of high attaining FSM-eligible (frequently ethnic minority) pupils to draw on. Kent simply isn't in this position. In considering all of these policies it is important to remember that many low income families will never find themselves eligible to claim free school meals and may be adversely affected by policies to improve access for the FSM group.
Overall, it would seem that there is much that Kent can do to ensure that children from disadvantaged backgrounds who are demonstrably academically capable are able to access grammar schools. Yet our analysis shows this does relatively little to close the overall gap in entry rates. More crucially, FSM pupils in the county are simply lower attaining, whether measured on the eleven-plus exam or in subsequent Key Stage two tests. It will be far more challenging to address that.


