


1. Introduction
In the past ten years, researchers have detected a robust link between the diversity and sophistication of productive capabilities in nations and their wealth in terms of GDP per capita and other important economic outcomes such as lower inequality (Reference Hidalgo, Klinger, Barabasi and HausmannHidalgo et al., 2007; Reference Hidalgo and HausmannHidalgo and Hausmann, 2009; Reference Hartmann, Guevara, Jara-Figueroa, Aristaran and HidalgoHartmann et al., 2017).
If a location displays a comparative advantage in the supply of complex products, this suggests the presence of various hard to imitate capabilities enabling it to capture more market share (Reference Balland and RigbyBalland and Rigby, 2017). Economic complexity also shapes a location's future specialisation trajectory through the Principle of Relatedness. According to this principle, nations tend to enter activities for which they already have relevant knowledge and capabilities (Reference Albeaik, Kaltenberg, Alsaleh and HidalgoHidalgo et al., 2017; Reference Frenken, Van Oort and VerburgFrenken et al., 2007). Economically complex locations have more ‘options’ to diversify their economy in response to new opportunities and shocks.
We would also expect complex economies to be able to generate ‘emergent’ phenomena in the form of new technologies and industries that recombine local capabilities, knowledge and skills in novel ways (Reference Rotolo, Hicks and MartinRotolo, Hicks and Martin, 2015). However, this link remains understudied. This is in part due to limitations in the data: it is not possible to identify novel phenomena with structured data sources based on pre-existing product, industry and technological categories offering a lagging view of the economy. For example, new sectors such as the Internet of Things or Virtual Reality are not present in the Standard Industrial Classification (SIC) taxonomy used to structure economic data in the UK, dating back to 2007.
But how can we determine if more economically complex areas have a stronger propensity to nurture emergent activities?
The increasing availability of digital data, computational power, and advances in machine learning and natural language processing are opening up new opportunities to expand our understanding of structural change in the economy, including through the analysis of unstructured (text) data in patents and research papers, and the study of new data sources such as business websites (Reference Bakhshi and Mateos-GarciaBakhshi and Mateos-Garcia, 2016; Reference Klinger, Mateos-Garcia and StathoulopoulosKlinger, Mateos-Garcia and Stathoulopoulos, 2018; Reference Einav and LevinEinav and Levin, 2014; Reference Gentzkow, Kelly and TaddyGentzkow, Kelly and Taddy, 2017).
In this paper, we combine a novel dataset with information about 1.5 million business websites in the UK obtained from Glass, a big data startup, and CrunchBase, a global directory of technology companies ideal for the analysis of innovation and entrepreneurial ecosystems (Reference Dalle, den Besten and MenonDalle, den Besten and Menon, 2017). We integrate these novel data sources with official economic data on employment, business activity and productivity in order to study the link between various measures of economic complexity, the emergence of new ideas and economic outcomes in local economies in the UK.
2. Definitions and data
2.1 Complexity
The seminal approach for estimating economic complexity, the Economic Complexity Index (ECI) is based on the method of reflections, a recursive algorithm that produces a sum of the number of products where a country has a revealed comparative advantage (or of industries where it specialises) ‘weighted’ by their ubiquity (their propensity to appear in many other countries) (Reference Hidalgo, Klinger, Barabasi and HausmannHidalgo et al., 2007). We will transfer it to our empirical context of UK local economies at the Travel to Work Area (TTWA) level by using industrial specialisation profiles (instead of exports) to proxy local capabilities. A non-linear modification to ECI called Fitness is also commonly used to correct some shortcomings of ECI, like its tendency to over-estimate the complexity of regions with low complexity industries that are present in high complexity regions (see the online appendix for more information on the formal definitions of the indices we use, and their strengths and weaknesses) (Reference Caldarelli, Cristelli, Gabrielli, Pietronero, Cala and TacchellaCaldarelli et al., 2012; Reference Tacchella, Cristelli, Caldarelli, Gabrielli and PietroneroTachella et al., 2012; Reference Pugliese, Zaccaria and PietroneroPugliese, Zaccaria and Pietronello, 2016; Reference Albeaik, Kaltenberg, Alsaleh and HidalgoAlbeaik et al., 2017).
We will estimate our economic complexity indices using employment data from BRES (The Business Register and Employment Survey) and IDBR (Interdepartmental Business Register) accessed from NOMIS, an online portal with labour market data for the UK.
BRES is an annual survey of 80,000 businesses in Great Britain providing official employee and employment estimates by detailed geography and industry. The Interdepartmental Business Register is a register of 2.6 million VAT (Value-added tax) and PAYE (Pay as you earn) registered businesses in the UK derived from administrative sources. It is used as the sampling frame for official business surveys in the UK.
We study 218 Travel to Work Areas (TTWAs) capturing commuting areas in Great Britain. By focusing on functional economies instead of administrative regions (as in Reference Mealy, Farmer and TeytelboymMealy, Farmer and Teytelboym, 2017, and Reference Mealy and CoyleMealy and Coyle, 2019) we hope to capture the span of industrial collaboration and knowledge spillovers that drives (and is enabled by) economic complexity. Unfortunately, we are not able to include Northern Ireland in our analysis because BRES data is not available for this country.
We classify BRES and IDBR data into industries using 4-digit SIC codes. We have clustered these codes into industrial segments of related industries with the algorithm developed in Reference Delgado, Porter and SternDelgado, Porter and Stern (2015), which measures this relatedness based on employment and business co-location, occupational composition of the workforce and business to business trade based on input-output tables. This gives us a list of 72 unique industries that we use to calculate our measures of economic complexity.
2.2 Emergence
We define emerging economic activities as those which rely on emerging technologies characterised by radical novelty, fast growth, coherence, prominent impact, and uncertainty and ambiguity (Reference Rotolo, Hicks and MartinRotolo, Martin and Hicks, 2015). Researchers and policymakers are interested in these technologies because of their potential to transform production processes or business models and enhance productivity. In this paper, we seek to operationalise this definition by identifying businesses in the UK that develop or have adopted those emerging technologies. However, as we mentioned in Section 1, it is not possible to capture this information in official data sources organised around lagging taxonomies such as those we use to measure economic complexity. For this reason, we have to rely on other, less structured sources.
We identify emerging technologies using the evolution of businesses descriptions in CrunchBase, a directory of technology companies increasingly popular in the analysis of start-up ecosystems (Reference Dalle, den Besten and MenonDalle, den Besten and Menon, 2017; Reference Breschi, Lassebie and MenonBreschi, Lassébie and Menon, 2018; Reference Nathan, Kemeny and AlmeerNathan, Kemeny and Baden Almeer, 2017). More specifically, we construct a dataset of 238,629 companies in the CrunchBase directory consisting of their descriptions and the year when they were founded. We pre-process company descriptions and concatenate them based on the year when they were founded, and identify salient terms that year based on their Term-Frequency Inverse-Document Frequency (TFIDF) score, which normalises the occurrence of words in an observation (in this case a year) by their occurrence in the corpus.
As the results in table 1 show, this analysis captures different ‘eras’ in the digital technology landscape, starting with social networks and smartphones in 2008, moving into Artificial Intelligence since 2013, and then into Blockchain, crypto-currencies and virtual reality (VR) in the last three years. We believe that this approach reflects key aspects of the above definition of technological emergence such as novelty, fast growth and prominent impact.

In principle, we could use CrunchBase to identify and map companies mentioning emergent terms, and in this way calculate indicators of emergence at the TTWA level; however, this could skew our measurement towards clusters of companies developing emerging technologies and neglect companies that adopt and deploy those technologies, an economically important behaviour which might be facilitated by a locations's economic complexity.
To avoid this bias, we will attempt to identify companies developing or adopting emerging technologies in a more comprehensive dataset capturing the universe of UK businesses with a website.
Glass is a UK big data startup that has developed technology that can “understand text at scale”. The company has built a web crawler that reads and interprets public websites automatically. To identify UK businesses, the crawler is set to read websites representing public and private organisations that target a UK audience, or have adopted the .uk domain address. Websites are considered if they are written in English, mention a UK address in their page, and have some depth of representation for the organisation.
Starting with over 204 million web pages, 894,277 business websites with a qualified depth of data are found. Then, the content of each website is read and relevant text entities (e.g. business descriptions) are detected with state of the art precision (>95%). Business descriptions are identified with a machine learning model that considers multiple features such as location on the web-page, use of specific keywords and phrases, sentence structure etc.
Based on descriptions and other attributes, each business is classified into one or more sectors and assigned a weight showing its proximity to the sector.Footnote 1 Specialised businesses tend to have a single sector with high weight, while those with a diversified activity have multiple sector predictions with lower weight values.
We geocode the business websites in the Glass data with their main postcode via NSPL (National Statistics Postcode Lookup), a lookup between postcodes and official geographies in the UK.Footnote 2 At the end of this process, we end up with ca. 400,000 unique geocoded business websites.
As mentioned, the Glass data are labelled with multiple sector tags through a predictive analysis of their website content. The LinkedIn taxonomy used for this contains 108 industries. We classify each website into its top sector based on the weight generated by Glass, and then into its official industrial segment through a look-up table.
One potential concern with the Glass data is that it could suffer from biases if, say, companies in some sectors or locations are more likely to have a website. We explore this potential issue by matching the Glass data with official data and comparing its sectoral distribution and geographical distribution. Our results suggest that the Glass data is broadly representative of industrial activity in the UK (see the online appendix for additional details).
In order to identify companies involved in emerging activities in the Glass data, we look for company descriptions with salient terms from the past three years in the CrunchBase data in table 1. In order to avoid low recall due to small differences in spelling or variation in terminology to refer to the same industries or technologies, we have expanded the initial vocabulary of emergent technology trends extracted from CrunchBase with similar terms based on a word2vec model trained on the Glass data.Footnote 3
In general, the terms in the resulting list capture emerging technologies or related ideas and concepts (see list of results in the online appendix).
In addition to using the Glass dataset to detect emergence, we also analyse the structure of the language in business websites and compare it between locations with different levels of economic complexity. This way, we seek to improve our understanding of the meaning of our economic complexity indices. In order to do this, we have extracted themes (clusters of terms) from business websites using a topic modelling algorithm. Essentially by considering our documents (business descriptions) as a mixture of topics, with each topic itself being a mixture of words, we can learn topics in an unsupervised manner from the likelihood of word co-occurrences within our documents. This approach allows us to analyse both the extent to which sectors and topics co-relate, and identify topics (and thus words) which correspond to high/low economic complexity.
Recent work (Reference Gerlach, Peixoto and AltmannGerlach, Peixoto and Altmann, 2018) has exploited a mathematical connection between topic models and finding community structure in networks, namely the mathematical equivalence between the Stochastic Block Model (SBM) and probabilistic Latent Semantic Indexing (pLSI), to develop an approach to topic modelling by deriving a non-parametric Bayesian parametrisation (topSBM) of pLSI adapted from a hierarchical SBM (Reference PeixotoPeixoto, 2017).
2.3 Additional Secondary Data
Previous studies have shown a robust relationship between economic complexity and other important economic variables (Reference Hidalgo, Klinger, Barabasi and HausmannHidalgo et al., 2007; Reference Hartmann, Guevara, Jara-Figueroa, Aristaran and HidalgoHartmann et al., 2017; Reference Mealy and CoyleMealy and Coyle, 2019). Here, we use salary data, from ASHE (Annual Survey of Hours and Earnings) and local economy estimates of GVA per capita generated by the Office for National Statistics (ONS) as economic benchmarks for our economic complexity metrics.Footnote 4 Because these benchmarking datasets are only available at the Local Authority District level, we use the NSPL (National Statistics Postcode Lookup) to construct a weighted mapping between the two in order to convert median salaries and GVA per capita to the TTWA level (see the on-line appendix for a validation of this mapping.)
3. Findings
The data collection and processing we have undertaken results in three sets of variables: (1) Measures of economic complexity based on the ECI and Fitness definitions using employment (BRES) and establishment (IDBR) data, averaged over the period for which we have data (2015–17); (2) Indices of emergence based on the presence of emerging technology terms (from CrunchBase) in Glass’ business website descriptions, and a model capturing topics of terms in business website descriptions, and economic outcomes related to productivity (median earnings and GVA per capita based on secondary data averaged between 2013 and 2018 (for earnings data) and between 2013 and 2015 (for GVA per capita data)).
Table 2 presents descriptive statistics for these variables, and figure 1 displays the bivariate (Spearman) correlations between them. The first thing worth noting is that our measures of complexity (ECI and Fitness) are strongly correlated with one another, suggesting that they are capturing similar features of local economies. All our economic complexity variables are also strongly associated with emergence, measured in terms of business counts and as a share of all businesses in a TTWA. This is consistent with the idea that locations that are more economically complex are also better able to develop and deploy emerging technologies. Complexity measures also display a positive correlation with economic outcomes, in line with recent findings in Reference Mealy and CoyleMealy and Coyle (2019) as well as studies using measures of economic complexity based on export data at the country level.

Figure 1. Pairwise correlations between economic complexity indices(a)

In the rest of the section we focus further on each of the set of variables that we have calculated and their relation with each other. First, we map the geography of complexity in Great Britain and seek to interpret complexity indices by looking at their composition, and also analysing salient topics in the website descriptions of businesses based on locations with different levels of complexity.
Having done this, we will focus on the geography of emergence in Britain, and its link with economic complexity. We will conclude by integrating our three data sources in a simple correlation analysis between economic complexity, emergence of new activities, and economic outcomes.
3.1 The geography of complexity in Great Britain
The maps in figure 2 present the geography of economic complexity in Great Britain based on the two algorithms we are focusing on (ECI in the first row, and Fitness in the second row) and data sources (employment in the first column, and number of establishments in the second). Meanwhile, table 3 shows the ten top and bottom TTWAs according to each complexity index and measure of activity.

Figure 2. Geography of complexity in Great Britain

Starting with the maps, we see strong similarities between measures and data sources: all of them show ‘hubs’ of economic complexity around London and the South East of England stretching into the South West along the M4 corridor to reach Bristol and Cardiff, and in the North with Manchester, Leeds and Newcastle, and Edinburgh and Glasgow. The South West, North of Wales, the North West and the Scottish Highlands are zones of low complexity.
These similarities are also present in table 3, where there is a strong overlap in the top and bottom TTWAs according to our complexity measures. Perhaps unsurprisingly, measures of complexity based on employment data tend to favour larger cities such as London, Manchester, Leeds, Cardiff and Glasgow by comparison to those based on business establishments, which tend to be dominated by smaller cities in South England.
What are the sectoral drivers of economic complexity? Table 4 presents the sectors with the highest and lowest levels of complexity according to ECI and Fitness. High complexity sectors (those where high complexity TTWAs tend to specialise) mostly include digital, creative and knowledge intensive industries (here it is worth noting that the Fitness indices – and in particular those based on establishment data – also highlight a few manufacturing sectors such as armaments, casting and pesticides). Low complexity sectors include untraded and commoditised services industries and primary sectors which are more important in rural TTWAs, such as forestry.

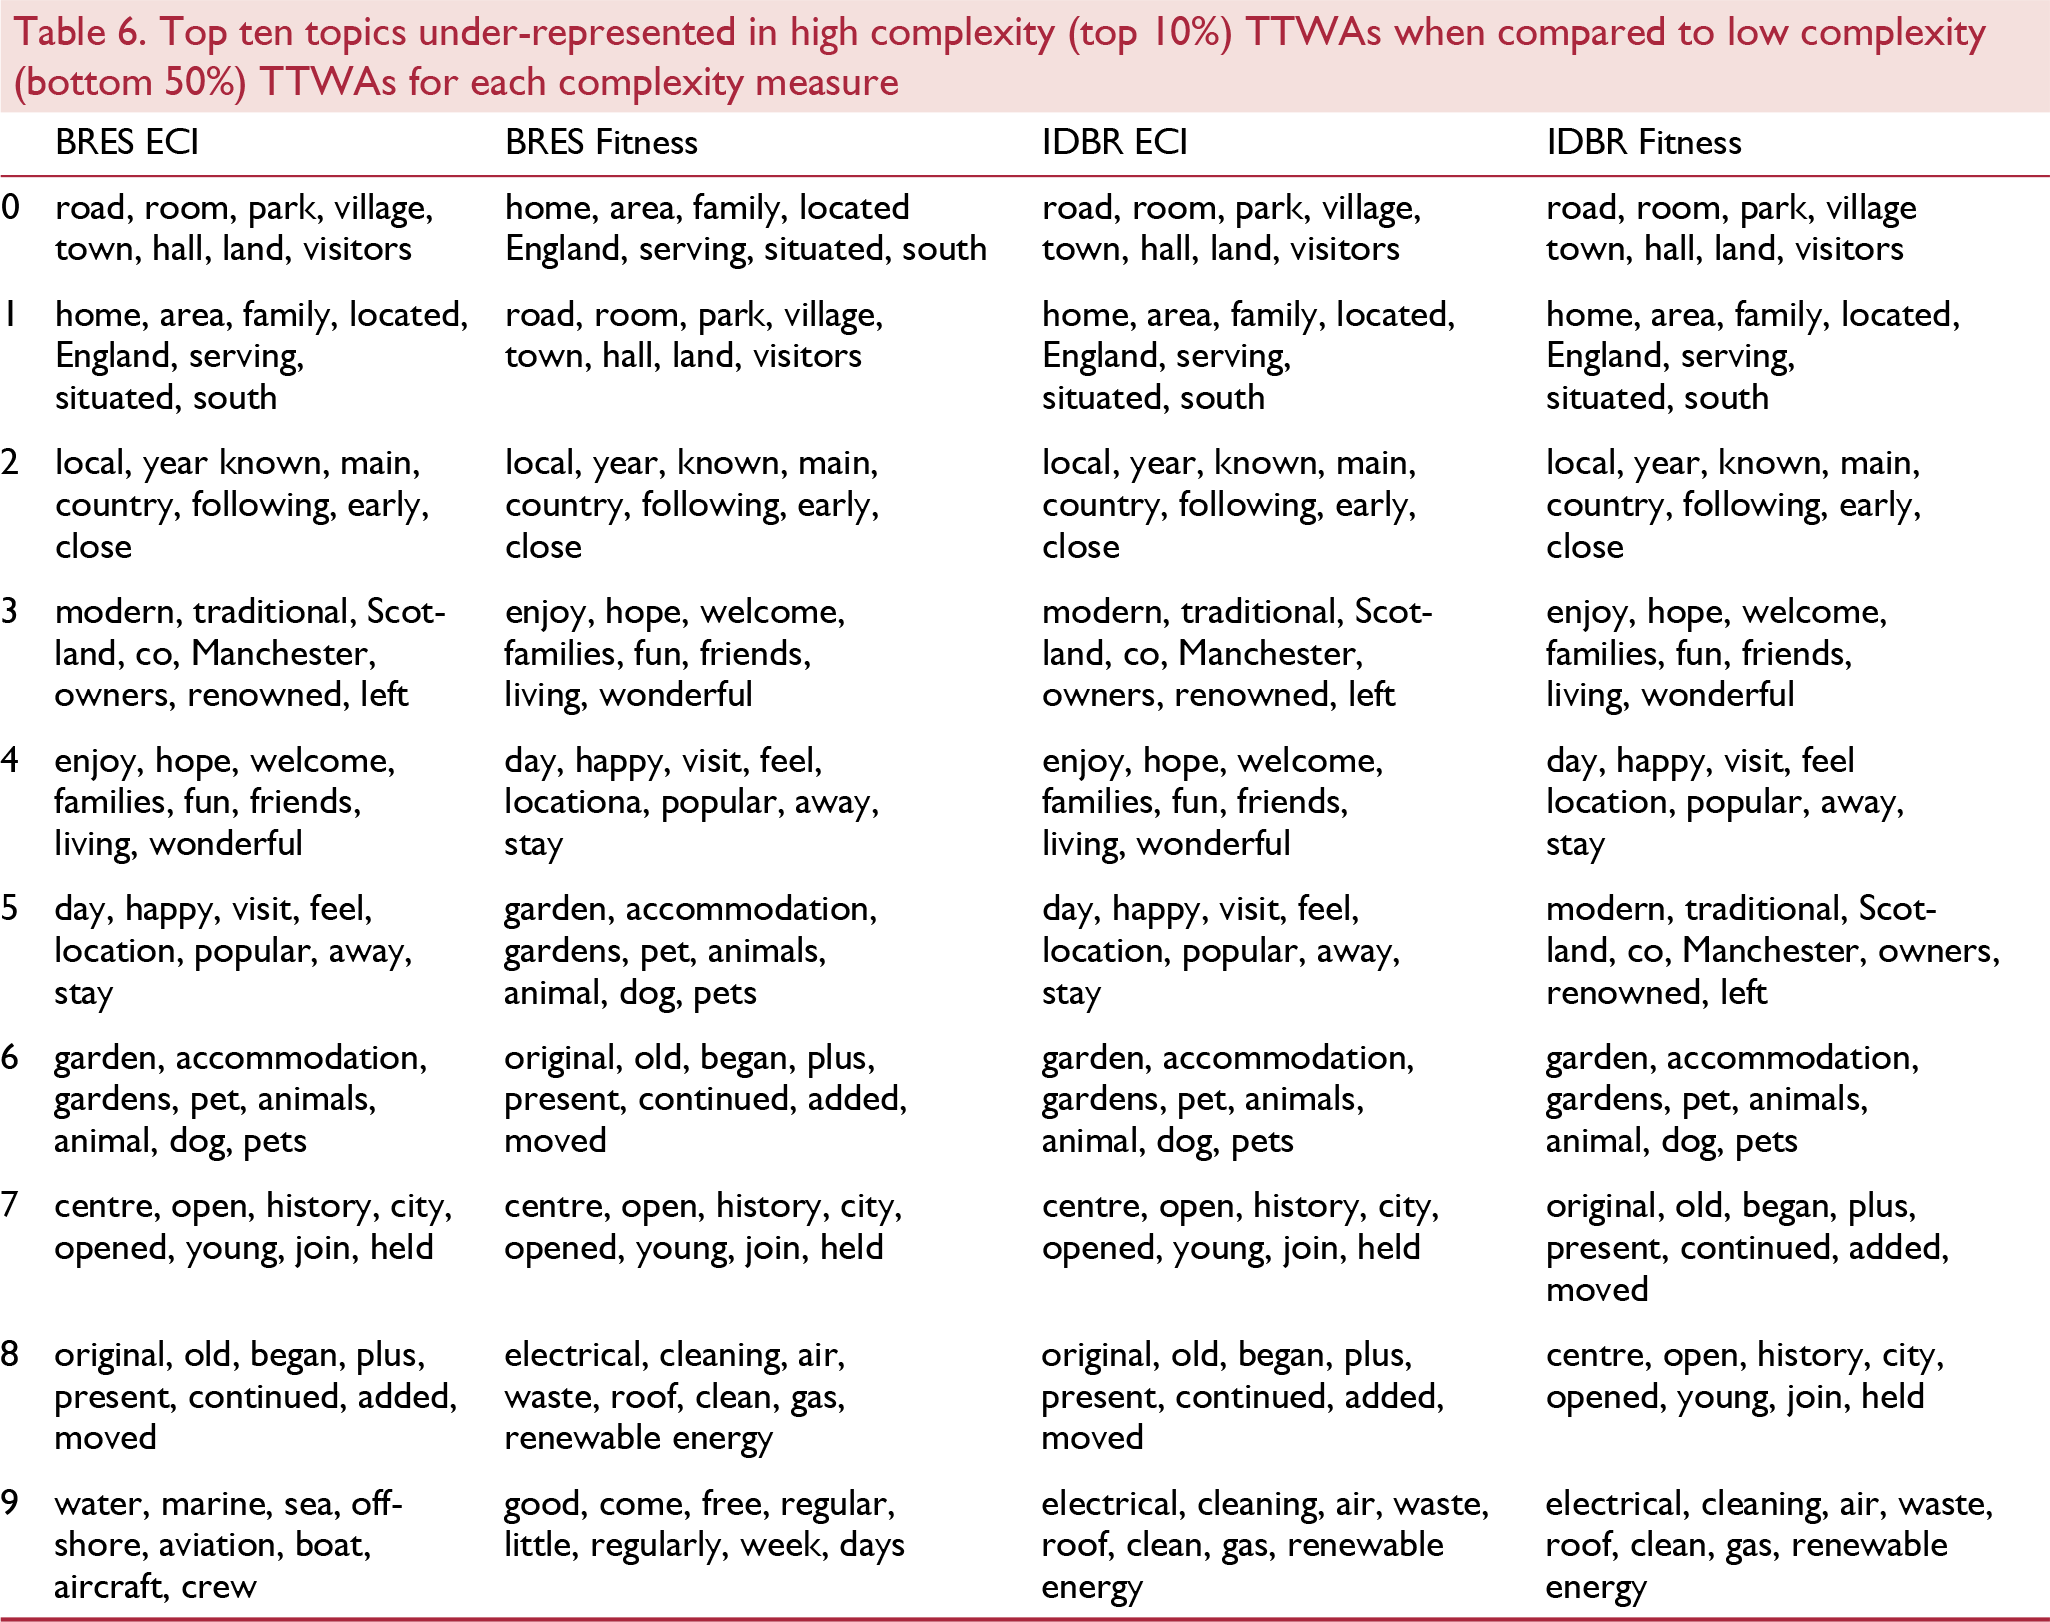
The picture is quite similar when we study the language in business websites for locations with different levels of complexity. Table 5 presents the words included in topics that are more important in high complexity TTWAs. We see that this includes topics covering creative, digital, data and knowledge intensive activities. We also note with interest the presence of topics related to new and unique ideas and networking (topics 9 and 6 in the BRES ECI column) and internationalisation (topic 7 in the BRES Fitness column). By contrast, table 6 shows that the dominant topics in low complexity TTWAs refer to activities related to tourism, leisure and heritage. Terms such as ‘old’, ‘historical’ and ‘traditional’ recur in the business websites for these TTWAs.

Consistent with previous observations, the dominant topics in TTWAs with high or low levels of complexity are largely independent of whether we use the ECI or Fitness index.
3.2 The geography of emergence in Great Britain
Having explored various indices and dimensions of economic complexity, we now turn to the analysis of emergence based on business website data.
We have identified 5,652 companies mentioning at least one of the emergent terms we highlighted in section 2.2. We map them in figure 3. Even after normalising by total business counts using IDBR data, this analysis shows that most of the TTWA's with a strong presence of emergent companies are in London and the South East of England. Creative and digital technology clusters such as Cambridge, Oxford, Guildford, Bristol and Brighton also rank highly in their ‘emergence shares’ (figure 3).

Figure 3. Geography of emergent activity in Great Britain
3.3 Economic complexity and emergence
Figure 4 reveals an association between economic complexity and the levels of emergence in a location even after normalising our measure of emergence to control for differences in the economic composition of locations (that is, the fact that high complexity locations tend to specialise in digital and creative sectors that often involve emerging technologies). Our tentative conclusion is that the association between economic complexity and emergence is not fully explained by the industrial composition of high complexity TTWAs.

Figure 4. Correlation between complexity indices, specialisation in sectors with strong presence of emergent companies, and new normalised measure of emergence accounting for the presence of high-emergence activity sectors in a location
3.4 Synthesis
We conclude by considering our three key sets of variables (economic complexity, emergence and economic outcomes) together. Our goal is to explore the plausibility of emergence as a mechanism underpinning the relationship between economic complexity and economic outcomes. If this was the case, we would expect to find a positive association between the three variables. For now, we simply calculate the Pearson correlation between the interaction of complexity and emergence, and economic outcomes. The results, which we present in figure 5, suggest the presence of this link: locations with high economic complexity and a strong presence of emergent companies also tend to have higher median earnings and GVA per capita.

Figure 5. Correlation coefficient between interactions of economic complexity and emergence indices, and economic outcomes
However, and as noted before, this relationship is far from simple. In table 7 we show, for the top 50 British TTWAs by number of businesses in IDBR, whether they are above or below the median of all TTWAs in the interaction between economic complexity and emergence, and whether they are above or below the median in economic outcomes (in terms of median annual earnings). We see a significant number of TTWAs (particularly in the North) where high levels of economic complexity together with emergent economic activities are not (yet?) linked to improved economic outcomes. We also see some TTWAs where above median economic outcomes do not seem to be linked to high economic complexity/emergence. These include some rural areas, and perhaps notably, Aberdeen, a TTWA strongly reliant on economic activities linked to the oil industry.

4. Conclusion
We have mapped the economic complexity of UK TTWAs using two indices, ECI and Fitness, calculated using both employment data from BRES and establishment data from IDBR. Our results are broadly similar across complexity indices and activity measures: economic complexity appears in urban TTWAs, generally although not always in the South East of England, and involves knowledge-intensive, creative and digital sectors. High complexity areas show a stronger propensity to develop economic activities involving emergent technologies, a link that does not appear to be wholly driven by their tendency to specialise in ‘complex’ digital industries. We also show that areas with strong economic complexity and emergent activity also tend to experience better (higher productivity related) economic outcomes, consistent with (although of course not demonstrative of) the hypothesis that the generation of technological and industrial emergence is a mechanism through which economic complexity is transformed into local economic development.
We also identify some TTWAs outside of the South East of England where high levels of complexity and emergence do not correspond to superior economic outcomes. We hypothesise that these TTWAs could be missing other key resources required to generate impacts from their emergent activities, such as access to finance or markets – this is an area of high policy relevance deserving of further analysis.
Another preliminary policy implication from our analysis is that the development of economic complexity seems to rely on gaining specialisation in a set of knowledge intensive, digital ‘vanguard’ sectors that tend to cluster in a few locations as a consequence of agglomeration economies and other knowledge spillovers (Reference Klinger, Mateos-Garcia and StathoulopoulosMateos-Garcia et al., 2018). Policymakers seeking to develop their local economies should recognise that a policy of specialisation in such industries is risky and unlikely to generate benefits in the short term. It could also be detrimental for economic resilience against shocks concentrated on those sectors – economic complexity as measured here is, after all, not the same as diversity (Mealy et al., 2018). The linking of novel data sources such as the Glass web data and official data make it possible to develop tools to aid policymakers in understanding the developing specialisation profiles of a local economy in a timely manner.
Our analysis is not without limitations. First, and most obviously, at this point we have simply described patterns of association between key variables. These need to be explored further within a multivariate modelling framework where we control for potential confounders such as population size, and workforce education & skills, also taking into account spatial autocorrelation between different locations. Second, there is the concern that our definition of emergence through CrunchBase data could skew our results towards creative and digital activities which are, as we mentioned, also over-represented in the Glass data. Generating measures of emergence which do not rely on ostensibly tech-oriented databases and sources, such as for example research publications and patents, is one potential avenue to address this limitation. Third, although our analysis suggests that technological emergence could be an important factor underpinning the link between economic complexity and local economic development, the relation could go in the other direction – if wealthier areas are able to invest in novel technologies that make their economies more complex. Teasing causality within the network of interdependencies that drive local economic development will be another important if challenging avenue for further research. Unpicking the mechanisms that link economic complexity and emergence, such as knowledge spillovers, business networking and collaboration, labour flows and boundary-spanning entrepreneurship is one potential strategy to achieve this goal, and one where novel, highly detailed and timely, complex data sources such as those we have used in this paper have an important role to play.


