


Introduction
Any imported good is destined either for domestic use or for re-export. Characterising the split of imports between re-exports and imports for domestic use is vital for understanding any country's dependence on its trade partners, the impact of trade policies, as well as policies intended to promote economic development. Current debates regarding the impact of a trade war between the US and China, the trade balance of the US with other countries and the consequences of Brexit make such issues particularly relevant. If a country is importing goods from the US subsequently to re-export them to another country, then it is not the first importing country, but the last destination that contributes to the American economy. Thus, the inclusion or exclusion of re-exports changes the reference points in the debate about trade deficits. This insight can only be obtained through good estimates of the actual use of American imports. As far as trade policy after Brexit is concerned, current statistics might over- or underestimate trade between the EU and the UK due to transshipment via the Netherlands. More precise measures are critical for well-informed trade negotiations. Furthermore, suppose that re-exported goods travelling from the Netherlands to the UK or vice versa had to cross a customs border. The proper measurement of these flows and their origin (EU vs non-EU) supports policymakers in their decisions to adapt the customs infrastructure on both the EU and the UK side.
To facilitate global value chain analysis, IMF and OECD (2018) recommend breaking down transactions involving re-exports by partner country. This would improve the alignment of merchandise trade statistics with national accounts and facilitate the creation of international accounting frameworks (OECD, 2019) and multi-region input-output tables (MRIOs). MRIOs are used in global value chain analysis to connect the location of economic activity and consumption. Since re-exports are not related to the domestic production and consumption processes, these trade flows are removed from MRIOs (Reference Fortanier and MiaoFortanier and Miao, 2017). However, it is of crucial importance that those frameworks rely on accurate estimates of re-export flows.
Re-export flows can be large and they are generally growing. They account for more than 40 per cent of the total exports of commodities of Hong Kong, Singapore, the Netherlands and Cyprus (UNCTAD, Singapore Department of Statistics and Statistics Netherlands). In the United States this figure is about 15 per cent, amounting to $224 billion and other countries (notably Germany) have sizable and growing re-exports rates as well (Reference Duprez and DresseDuprez and Dresse, 2013; Reference NottenNotten, 2015).
Despite the growing importance of re-exports, a great deal of uncertainty still surrounds estimates of their patterns and origins. The share of imports destined for domestic use or re-exports is not measured by country of origin. Therefore, researchers rely on proportionality assumptions at the product level. For example: suppose that the Netherlands imports 100 apples from Germany and 100 apples from France, and that it re-exports 100 apples in total. Using a simple proportionality assumption, 50 apples from Germany and 50 from France are used for re-exports. However, this masks the underlying heterogeneity that is present at the trader level. It is possible that one trader imports all his apples from Germany for re-export, and that another trader imports all his fruit from France for domestic supply. In this scenario, the domestic economy does not depend on Germany for apples, whereas the simple proportionality method that is typically used suggests it does.
Heterogeneity at the trader level is substantial. Reference LemmersLemmers (2013) (see also Reference Jansen, Loranger, Da Pont, Kroese, Lemmers and HoekstraJansen et al., 2014), using micro data on Dutch traders, shows that simple proportionality assumptions can lead to biased estimates of trade dependence. More specifically, imports for Dutch domestic use from countries far away are typically overstated, whilst Dutch produced exports to these countries are typically understated. For other European countries it is typically the opposite. Later in this paper we note that for some countries relative biases can exceed 50 per cent.
Another problem with current estimates is that it is unclear how many imports are actually required for 1 euro of re-exports. Both Reference RoosRoos (2007) and Reference LemmersLemmers (2013) use a fixed amount of imports for one euro of re-export, irrespective of the product. However, there is heterogeneity at the product level. For example, the trade and transport margins that are added to imports to calculate the value of re-exports are much lower for crude oil than for food. Product specific margins also have significant consequences at the macro-level. For example, assume that country A imports 100 currency units of crude oil from country B and 100 currency units of fruits from country C and that there are 50 re-exports of crude oil and 50 re-exports of fruits. If the margin on each product is the same, then country B and country C supply the same amount to the domestic economy of country A. However, if the margin is 1 per cent and 10 per cent respectively, country B supplies 49.5 and country C supplies 45.5.
The method described in this paper takes heterogeneity between traders into account by using microdata at the trader level. This data was also used to link origin and destination countries of a given re-exported product at the level of traders, i.e. at a much more granular level than the current product level. The method is also the first to take into account that products may differ in the value of imports needed for one euro of re-exports.
The Netherlands has been a trading country for a long time, selling its own products as well as serving as a hub for other traders. In 2015 re-exports accounted for 54 per cent of the total exports of goods, which contributed to some 4 per cent of Dutch GDP (Statistics Netherlands, 2016). CPB (2001) and Reference Kuypers, Lejour, Lemmers and RamaekersKuypers et al. (2013) give several explanations for the importance of re-exports to the Netherlands. They include geography, infrastructure and skills. Against this backdrop we refer to the so-called Rotterdam effect: goods from other countries (especially from outside the European Union) are imported by Dutch traders who re-export to, for instance, other European countries. This inflates Dutch trade while obscuring the direct trade link between producing and consuming economies.
Statistics Netherlands has undertaken several studies to gain new insights into the phenomenon of re-exports. Reference RoosRoos (2006a, Reference Roos2006b) developed a method to estimate re-exports at the product and destination country level. Reference LemmersLemmers (2013) derived estimates for the origin of re-exports, which were then used to re-evaluate trade balances (Reference Florquin and LemmersFlorquin and Lemmers, 2014). Several projects connected transport and trade flows to estimate transit trade, imports for re-exports, imports for domestic use, domestic exports and re-exports (for example Reference Boonstra, De Blois and LindersBoonstra et al., 2011; Statistics Netherlands, 2019a).
The method developed in this paper allows us to compile and analyse time series where total Dutch imports from any foreign country are split into imports for domestic use and imports for re-exports.
Data
The main aim of our method is to provide a more precise picture of Dutch trade interdependencies by constructing estimates of imports for re-exports and imports for domestic use that rely on trader level data. Re-exports are defined as goods that were imported before being exported and that were subject to minor adaptations only. Importantly, between import and subsequent export, goods must have been possessed by Dutch residents, thereby excluding transit trade and quasi transit trade.Footnote 1
We classify products using the commodity codes from the Combined Nomenclature (CN, see e.g. European Commission, 2018). This is a classification of goods that is used in European Union (EU) trade statistics, building on the World Customs Organization's Harmonized System nomenclature, the systematic list of commodities applied by most trading nations. The Combined Nomenclature assigns 8-digit codesFootnote 2 to goods.
In our study we use data on imports and re-exports at commodity, country and trader level from trade statistics, and data on imports and re-exports at commodity level from national accounts.Footnote 3 To derive product-specific import intensities of re-exports we use estimates from national accounts based on structural business statistics that contain information about trade margins of wholesalers who re-export. In order to match VAT numbers to enterprises, and enterprises with their enterprise groups, we use key tables provided in the Dutch general business register. Note that we do not use data from Balance of Payments statistics because of insufficient product detail.
Several countries already have similar data available. As explained in the methods section, data on imports and re-exports at commodity, country and trader level from trade statistics and data on imports and re-exports at commodity level from national accounts (together with the key crosswalk table) constitute the minimum necessary information for applying our method.Footnote 4 Re-exports can be derived using the method of Reference RoosRoos (2006a, Reference Roos2006b), as explained in Reference Lemmers and WongLemmers and Wong (2019). Import for re-export intensities can also be obtained by using the corresponding estimates from other countries. Alternatively, they can be derived using wholesale margins on exports (at the product level). Reference WongWong (2019) describes how to estimate those margins by combining export data from national accounts and trade statistics, both at the product and industry level.
Note that it does not matter whether the value of imports and re-exports from trade statistics is measured at the level of VAT numbers or not; crucially, it should be at the trader level. At Statistics Netherlands there are several levels of traders available: the VAT number, the enterprise and the enterprise group. The use of the information captured at all of these three levels, first at the most detailed level and gradually at a more aggregated level, ensures optimal use of the available micro data.
Our time series starts in 2002 as re-exports are captured in trade statistics only since 2002. The end year (2016) is dictated by the availability of time series from national accounts. The link between VAT numbers and enterprises is consistent as of 2009. We use the link in 2009 and the link between enterprises and enterprise groups in 2009 for all years in the time period 2002–9.
Our analysis relies on information from both national accounts and trade statistics as national accounts data record imports for re-exports, whereas trade statistics provide country-level detail for imports. Because there are many conceptual differences between these two data sources, we had to adapt the data. All those refinements are discussed in further detail in the Appendix.
Method
In a first step, we remove some trade flows from the trade statistics in order to assure the comparability with national accounts data as described in detail in the Appendix. Subsequently, product-level imports and re-exports from trade statistics are weighted to national accounts totals. Then, we use information from the input-output tablesFootnote 5 to estimate, at the product level, how many imports are actually needed for €1 of re-exports. These estimates are linked to trade statistics data, which contain import values at the trader level, including product and country detail, and are already weighted to national accounts product totals. Using the estimate of imports needed for €1 of re-export, we estimate import requirements based on the total re-export value of this product by this trader. For example, suppose that a commodity A requires 80 cents of imports for €1 of re-exports and the total re-export value of a trader is €100. This means that an import value of €80 is necessary to account for the recorded re-exports. The subsequent steps involve matching imports to re-exports. Ideally, we find these imports at the re-exporting trader level. We start by assigning the necessary imports at the most detailed level, i.e. re-exports at the VAT levelFootnote 6 and 8-digit commodity code. When these are not available, we turn to more aggregated data until all of the necessary imports have been assigned. We describe our algorithm in more detail below. Reference Lemmers and WongLemmers and Wong (2019) provide a numerical example for steps 1 and 2.
Step 1. VAT number by 8-digit commodity
We start at the most detailed level of traders and products, i.e. the VAT number and 8-digit commodity level, respectively. We assign imports proportionally across countries where the trader imported from. For example, suppose we observe €100 of imports for re-exports, and there are €200 of imports from China and €50 of imports from Germany, then we assign 100 ∗ 200/(200+50) = 80 to China and 100 ∗ 50/(200+50) = 20 to Germany. The surplus or deficit of remaining imports is carried over to the next step.
Step 2. VAT number by 6-digit commodity
The trader might have few imports of the commodity ‘apple juice with added sugar’ (20097120), many re-exports of this product, but large imports of ‘apple juice without added sugar’ (20097129). Imports that are only slightly adapted before they are exported are still considered to be imports for re-exports. Therefore, we add all remaining imports and re-exports of the VAT number at the 6-digit commodity level and try, just as before, to account for re-exports with these imports. The surplus or deficit of remaining imports is carried over to the next step.
Step 3. Enterprise-level by 6-digit commodity, enterprise group-level
An enterprise might have more than one VAT number, one of them declaring imports and another one declaring exports. As a result, no relation can be mapped out at the VAT number level, but there is one at the enterprise level. We proceed as in the previous step, but now at the enterprise by 6-digit commodity level. Similarly, an enterprise group might have more than one enterprise, one of them declaring imports and another one declaring exports and there is a relation at the enterprise group level. We proceed as before, at the enterprise group by 6-digit commodity level and at the enterprise group by commodities of national accounts level when necessary.
Step 4. Product level
Consider, at 6-digit commodity level, all remaining imports and re-exports. This is an aggregate for the whole country. We proceed as in the previous steps, but now at the 6-digit commodity level, 4-digit commodity level and at national accounts commodity level respectively.
Then all re-exports are being accounted for. This is by construction; we weighted imports and re-exports at the commodity level of the national accounts to the totals of the national accounts. In addition, we used the estimates of imports needed for re-exports from national accounts. We calculate imports for domestic use as the difference between total imports and imports for re-exports for each combination of year, country and commodity code.
A quality indicator
In figure 1 we show how much of the data is matched at a given step of the algorithm outlined above.Footnote 7 The quality of estimates that are derived at the trader level is thought to be higher than that derived at a more aggregate level. Over 70 per cent of the total value of imports for re-exports is assigned at VAT level and more than 85 per cent is assigned at trader level. The drop in the share assigned at trader level between 2014 and 2015 is due to methodological changes in intra-EU trade statistics by Statistics Netherlands. For extra-EU countries the share of imports for re-exports assigned at trader level remains high and stable through time. This is to be expected; due to the data collection process extra-EU trade can almost always be mapped to a trader.

Figure 1. Source information to determine imports for total re-exports
About 10–15 per cent of imports for re-exports are assigned using information at the firm level. The aggregate results are similar whether one does or does not use the link between traders and firms. This is good news for countries that wish to mimic the method of this paper but have no access to a link between traders and firms.
Results
In this section we compare our novel estimates with the results of alternative methods and alternative data sources. We also discuss the implications of our novel estimates for trade with the United Kingdom and the United States.
Comparison with proportional method approach
The standard proportional macro method for estimating re-exports uses more aggregated (macro) data and a proportionality assumption. Specifically, it projects the split between re-exports and imports for domestic use from the product level to all origin countries of imports. For example, if 20 per cent of carrot imports are destined for domestic use, then the proportional method would assume that this holds for German carrots, Belgian carrots as well as American carrots.
We find that in 2002 imports for domestic use from the United States are estimated to be €7.9 billion according to the results from the proportional method, whereas our estimates relying on micro data suggest a value of €6.9 billion. The difference between these estimates as a ratio of the estimate using micro data (the higher precision estimate) is 15 per cent. This relative difference is depicted in figure 2 for several countries. The relative difference between the two estimates for the United States and the United Kingdom declines from 15 and 18 per cent in 2002 to 2 and 4 per cent in 2016, respectively. However, the relative difference for the two major trading partners of the Netherlands, Germany and Belgium, is both negative and of increasing magnitude. For Belgium the relative difference was −9 per cent in 2002 and −13 per cent in 2016. This suggests that for both Germany and Belgium the proportional method underestimates the magnitudes of imports for domestic use and, in consequence, their importance for the Dutch economy.

Figure 2. Relative difference between estimates for value of imports for domestic use in total Dutch imports using macro data and micro data
We also examined this relative difference for the top 50 trading partners of the Netherlands in 2016. The absolute relative difference between the outcomes of both methods is smaller than 10 per cent in almost half of all cases. However, in eight cases it was more than 25 per cent, and in four of those cases it was more than 50 per cent, suggesting significantly heterogeneous behaviour of re-exporting traders that is masked by the standard proportional approach.
Imports for re-exports: country and time patterns
In figure 3 we plot the shares of Dutch imports for re-exports by country of import origin. First, imports are increasingly destined for re-exports. The share of imports for re-exports in total imports grew from 41 per cent in 2002 to 55 per cent in 2016. This share increased for Germany and Belgium, the two main trading partners of the Netherlands. For the United Kingdom and China this share remained stable during the time period 2002–16, whereas it increased for the United States until 2014 and declined thereafter. Second, there is substantial heterogeneity between origin countries. In 2016 about 69 per cent of Dutch imports from China went to other countries, but for imports from Belgium and Germany this share was 43 per cent and 46 per cent, respectively.

Figure 3. Share of Dutch imports destined for re-exports, by country of origin
Imports from the United Kingdom
In 2016, the Netherlands imported goods worth €20.2 billion from the United Kingdom, which was evenly distributed between imports for the domestic economy and re-exports amounting to €9.5 billion and €10.6 billion, respectively. In figure 4 we plot imports by the Netherlands from the UK at the aggregated product level. The relatively even distribution between imports for domestic use and for re-export is also evident at this level, with the notable exceptions of machinery and transport equipment and crude materials and fuels. The majority of imported machinery and transport equipment is destined for foreign markets, whereas crude materials and mineral fuels are more often destined for the Dutch economy.
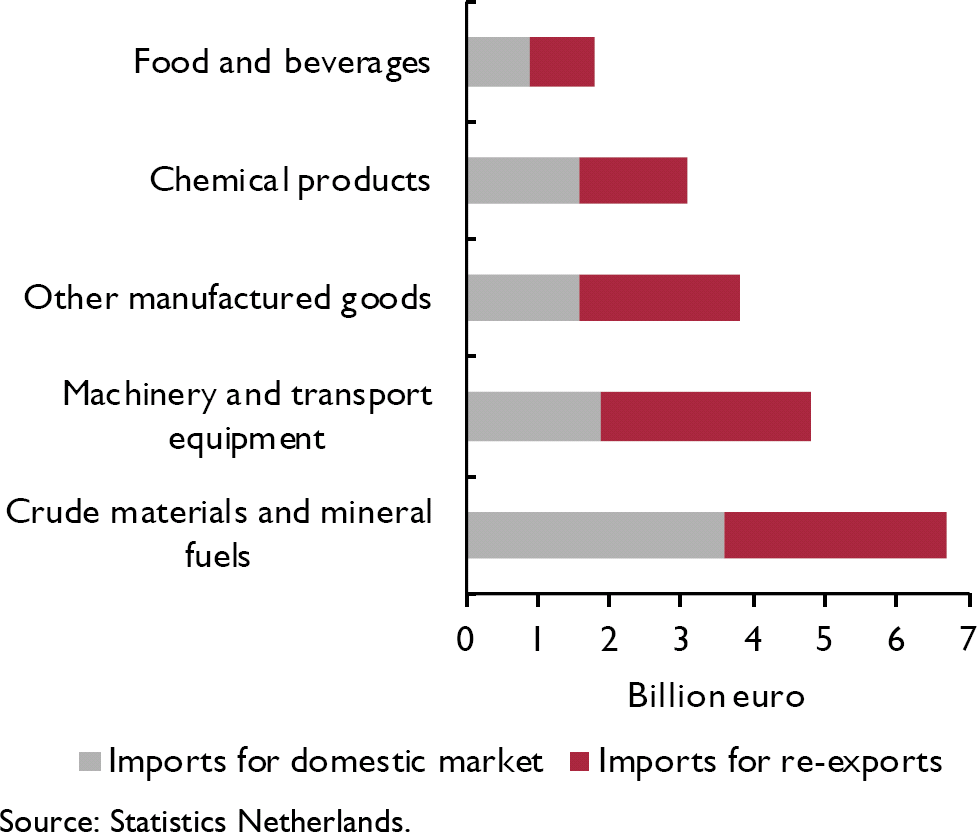
Figure 4. Dutch imports from the United Kingdom, by product and destination, 2016
Imports destined for re-exports to the United Kingdom
The United Kingdom is one of the most important trading partners of the Netherlands and several studies have already analysed the trade interdependence between these two economies in the light of Brexit (e.g. Reference Jaarsma and WongJaarsma and Wong, 2017; Reference Wong, Boutorat, Prenen, Lammertsma and RamaekersWong et al., 2018 and Statistics Netherlands, 2019b). In 2018, Dutch re-exports to the United Kingdom amounted to €23.1 billion, and €3.3 billion of Dutch value added and 25 thousand full time jobs were embodied in these re-exports. It is relevant to know whether the origin of these re-exports is within or outside the European Union. This has implications for Dutch preparations for Brexit, such as hiring new customs officers to process these trade flows.
Reference Wong, Boutorat, Prenen, Lammertsma and RamaekersWong et al. (2018) estimatedFootnote 8 that in 2016 €9 billion of €19 billion of imports for Dutch re-exports to the UK originated from the European Union, 10 billion were imports from non-member countriesFootnote 9 of the European Union. In figure 5 we plot the contributions of EU countries towards the Dutch re-exports to the UK. Germany is the main source of these imports, followed by Belgium and France.

Figure 5. Dutch imports from EU countries destined for re-exports to the UK, 2016
From the viewpoint of the United Kingdom, these estimates are relevant for the development of trade policy, since it is possible that the ‘Rotterdam effect’ distorts the official trade statistics on trade with the European Union. The Rotterdam Effect mainly occurs as a result of trade intermediated through major world transportation hubs (e.g. Rotterdam in the Netherlands or Antwerp in Belgium). Due to transshipment and complex customs procedures some trade flows are incorrectly attributed to intermediate destinations as opposed to their true destinations or origins. Our new data indicate how many UK imports from the Netherlands actually originate from the European Union and how many originate from elsewhere. Conversely, it is still unknown what proportion of UK exports to the Netherlands is destined for consumption or use in the Netherlands, and which part is re-exported to countries inside and outside the European Union. An extension of our methodology offers a possibility to address this issue.
Another view at the trade balance with the United States
Trade balances play an important role in the development of the trade policies of the current US administration. Reference Ramaekers and WongRamaekers and Wong (2018) consider the Dutch trade balance with the United States after the removal of re-export flows. In 2016 the total bilateral trade deficit in goods of the Netherlands with respect to the US was €12 billion; however it can be almost entirely attributed to large re-export flows. The bilateral deficit is reduced to €0.6 billion when taking into account only the Dutch importsFootnote 10 for domestic use and US imports of Dutch-manufactured goods. In other words, in 2016 the Netherlands spent just slightly more on goods imported from the US for use in the Netherlands than the US spent on Dutch-produced goods.
Comparing results to trade in value added data (TiVA)
In December 2018 OECD and WTO published an update of the Trade in Value Added (TiVA) database. TiVA is a rich source of information about global value chains and it contains estimates of imports for domestic use. We compared the estimates of imports for domestic use obtained by the new method described in this paper to corresponding estimates in TiVA.Footnote 11 The comparison is made for ten countries that, according to TiVA, are the largest exporters of commodities to the Netherlands. The method of this paper yields much higher estimates for the imports for domestic use from Germany and Belgium, two neighbouring countries that are the main trading partners of the Netherlands. On the other hand, novel estimates for imports from Singapore, the United States and the remainder category ‘other countries’ are lower. This is in line with the results in figure 2 and those of Reference LemmersLemmers (2013), who compared estimates based on Dutch micro data to MRIOs.
Discussion of the methodology
The main goal of this study was to develop a reliable method for dividing imports from a given country into two components: imports for domestic use and imports for re-exports. This method yields results that are substantially different from the estimates obtained using the alternative method relying on the aggregate data combined with a simple proportionality assumption. For example, our new method suggests that Dutch imports for domestic use originating from Belgium and Germany are 10 per cent higher than those estimated by the proportionality method. Further, for eight of the fifty major trading partners of the Netherlands, the magnitude of the difference in results obtained using these methods exceeds 25 per cent. At a more detailed industry level, differences in results may be even greater.
Our novel method provides more robust estimates of trading patterns than standard methods employed as it relies on trader level data (see figure 1). As for the extension of the approach to other countries, it is noteworthy that the data relying on the link between traders and firms account for a relatively small part of the results (10–15 per cent). Hence, if such a link is not available it should not significantly impact the estimates.
There are a number of ways in which our approach can be refined in order to deliver even more precise estimates of imports for re-exports.
First, we rely on a proportionality assumption at the trader level, i.e. that for any re-exporter the share of imports of a given product used for re-exports is the same for each source country. When a firm imports from country A and country B, and also re-exports, we cannot distinguish in the data whether imports from country A are being re-exported in total, partly or not at all. To account for those differences we would have to rely on data on routes and destinations of containers and container ships. Although promising, it should be noted that this could be a highly demanding data collection exercise.
Second, the import data we used from trade statistics and national accounts are CIF (Cost Insurance Freight), thus including the costs of transport and insurance on top of the price of the goods themselves. It would be preferable to use data valued FOB (Free On Board), without these costs. We expect that using a CIF-FOB correction, for example using the OECD data by Reference Miao and FortanierMiao and Fortanier (2017), would not change results significantly. First, in 2016 the CIF-FOB correction amounted to 1.6 per cent of total Dutch imports of goods. Second, the trade data were used to create shares of countries in the imports of a given product, and these shares will not differ very much after applying a CIF-FOB correction. However, for some applications it is advisable to apply such a correction.
Third, additional information at the trader level may yield further insights. Reference LemmersLemmers (2013) used the knowledge of experts about traders, gathered using telephone interviews and visits. For example, expert knowledge might reveal that enterprise A is the logistic supplier for enterprise B, and that A takes care of all the imports of B but B reports its re-exports itself. This kind of information is very valuable, but it is very time consuming to collect and may change through time.
Finally, the use of more granular data could improve the estimates. This could relate to the weighting of the trade data to the national accounts totals at a more detailed product level or to the linking of imports and re-exports at quarters or months instead of years as a product that is re-exported in a given month was probably also recently imported.
Extension of the time series to 2017 and beyond is complicated by discontinuities in the aggregate time series available in the national accounts with base year 2010, used in this study, and base year 2015.
Conclusion
In the same way that advancements in the measurement of trade in value added have uncovered several previously unknown indirect relationships between countries, better measures of re-exports challenge our understanding of current trading relationships. Proper estimates are critical for well-informed trade negotiations. The estimates of imports for re-exports, as obtained by the method that we propose in this paper, are highly heterogeneous among countries and for some countries they differ substantially (more than 50 per cent) from existing estimates.
Over the past decade the share of Dutch imports destined for domestic use declined, whereas the share of Dutch imports destined for re-exports grew. In 2002 the latter amounted to 41 per cent, rising to 55 per cent in 2016.
The new estimates shed light on several policy relevant subjects. First, Reference Wong, Boutorat, Prenen, Lammertsma and RamaekersWong et al. (2018) show that the Netherlands imports €9 billion from other European member states for re-export to the United Kingdom. Depending on how Brexit develops, new customs officers might have to be appointed to accommodate these European trade flows channelled through the Netherlands. Second, once re-export flows are accounted for, the Dutch trade in goods deficit with respect to the United States reduces from €12 billion to €0.6 billion. Third, our newly constructed data suggest that the share of imports for domestic use originating in Belgium and Germany is significantly larger than previously thought. Thus, the reliance of the Netherlands on other economies might be different than commonly assumed.
In 2016 69 per cent of Dutch imports from China were destined for the European hinterland. This yields value added and employment in the Netherlands, but also leads to the use of scarce land, CO2 emissions connected to transport, and more traffic congestion. The Belt and Road Initiative, an alternative connection from China to Europe, might deflect part of these trade flows and the corresponding benefits and drawbacks.
There are a number of topics for future research. First, the newly derived data can be used to improve the Dutch part in multi-region input-output tables (MRIOs) such as Eora (Reference Lenzen, Moran, Kanemoto and GeschkeLenzen et al., 2013), Exiobase (Reference Wood, Stadler, Bulavskaya, Lutter, Giljum, de Koning, Kuenen, Schütz, Acosta-Fernández, Usubiaga, Simas, Ivanova, Weinzettel, Schmidt, Merciai and TukkerWood et al., 2015), FIGARO (Reference Remond-Tiedrez and Rueda-CantucheRemond-Tiedrez and Rueda-Cantuche (ed.), 2019), TiVA (OECD and WTO, 2012) or WIOD (Reference Timmer, Dietzenbacher, Los, Stehrer and De VriesTimmer et al., 2015). Second, one could study the destination of Dutch imports from developing countries. It can now be shown whether this is for use in the Netherlands or somewhere else. This is relevant for Dutch policy makers who aim for inclusive globalisation (Ministry of Foreign Affairs, 2013 and 2018). Third, it can be shown where in the national value chain imports from a given country are being used and which industry has the strongest ties to that country (Reference WongWong et al., 2018). Fourth, an extension of our method is to add the destination of imports for re-exports, thus enabling the full quantification of the Rotterdam effect. For example, how many Dutch imports from the United Kingdom are re-exported to EU-countries and non-EU countries, respectively.
Appendix
We make a number of adjustments to align our estimates with the national accounts. From the trade in goods data we remove flows of processing trade and returned goods, neither of which are considered to be trade in goods in the national accounts. We also remove five traders from the trade data, whose transactions do not align with concepts of international trade in the national accounts. For eight commodity codes we follow the international trade data instead of the national accounts data. In the national accounts these products either have large production abroad, a large share of illegal trade (such as drugs) or cannot be matched to the international trade data.


