Introduction
One of the main objectives of both orbital and landed Mars missions is the mineralogical characterisation of the igneous and sedimentary rocks in order to constrain past geological processes such as the early volcanism and aqueous alteration. So far, many types of igneous rocks have been detected at the surface of Mars with basaltic rocks being the most abundant (e.g. Bandfield et al., Reference Bandfield, Hamilton and Christensen2000; McSween et al., Reference McSween, Taylor and Wyatt2009; Taylor and McLennan, Reference Taylor and McLennan2009; Ody, Reference Ody2012; Baratoux et al., Reference Baratoux, Toplis, Monnereau and Sautter2013; Sautter et al., Reference Sautter, Toplis, Beck, Mangold, Wiens, Pinet, Cousin and Maurice2016; Cousin et al., Reference Cousin, Sautter, Payré, Forni, Mangold, Gasnault, Le Deit, Johnson, Maurice, Salvatore, Wiens, Gasda and Rapin2017), though recently the Curiosity rover and the orbital spectrometer CRISM have discovered rocks that are more felsic and alkali-rich including trachyte, andesite, diorite and putative granitoids (Wray et al., Reference Wray, Hansen, Dufek, Swayze, Murchie, Seelos, Skok, Irwin III and Ghiorso2013; Stolper et al., Reference Stolper, Baker, Newcombe, Schmidt, Treiman, Cousin and Dyar2013; Sautter et al., Reference Sautter, Toplis, Wiens, Cousin, Fabre, Gasnault and Maurice2015; Mangold et al., Reference Mangold, Baratoux, Witasse, Encrenaz and Sotin2016). These magmatic rocks have been altered into diverse minerals such as clays (various smectites, kaolinite and chlorite-group minerals) and sulfates (Ca-, Fe-, Mg-sulfates), which are commonly detected in sediment layers overlying the igneous bedrock or in crustal outcrops exhumed by impact craters (e.g. Arvidson et al., Reference Arvidson, Poulet, Bibring, Wolff, Gendrin, Morris, Freeman, Langevin, Mangold and Bellucci2005; Squyres and Knoll, Reference Squyres and Knoll2005; Poulet et al., Reference Poulet, Bibring, Mustard, Gendrin, Mangold, Langevin, Arvidson, Gondet and Gomez2005; Gendrin et al., Reference Gendrin, Mangold, Bibring, Langevin, Gondet, Poulet, Bonello, Quantin, Mustard, Arvidson and LeMouélic2005; Elhmann et al., Reference Ehlmann, Berger, Mangold, Michalski, Catling, Ruff, Chassefière, Niles, Chevrier and Poulet2013, Carter et al., Reference Carter, Poulet, Bibring, Mangold and Murchie2013).
The Curiosity rover currently analyses rocks and soils on Mars using Laser Induced Breakdown Spectroscopy (LIBS) (Maurice et al., Reference Maurice, Wiens, Saccoccio, Barraclough and Gasnault2012; Wiens et al., Reference Wiens, Maurice, Barraclough, Saccoccio, Barkley and Bell III2012; Meslin et al., Reference Meslin, Gasnault, Forni, Schröder and Cousin2013; Maurice et al., Reference Maurice, Clegg, Wiens, Gasnault, Rapin, Forni and Cousin2016; Cousin et al., Reference Cousin, Sautter, Payré, Forni, Mangold, Gasnault, Le Deit, Johnson, Maurice, Salvatore, Wiens, Gasda and Rapin2017; Mangold et al., Reference Mangold, Schmidt, Fisk, Forni, McLennan, Ming, Sautter, Sumner, Williams, Clegg, Cousin, Gasnault, Gellert, Grotzinger and Wiens2017). The LIBS equipment enables the detection and quantification of all major elements (e.g. Si and Al) and the detection of volatiles and halogens (C-H-O-N-P-S-F-Cl). However, the detection of these latter elements is difficult with this method because of the high excitation energies, their peak positions near the instrument limit, and the coupling of different major-element rays (e.g. Sallé et al., Reference Sallé, Lacour, Vors, Fichet, Maurice, Cremers and Wiens2004; Clegg et al., Reference Clegg, Wiens, Dyar, Vaniman, Thompson and Sklute2007). This results for some in varying detection levels and lack of quantification. In particular, the detection limit for S is 5 to 10 wt.% S (Wiens et al., Reference Wiens, Maurice, Barraclough, Saccoccio, Barkley and Bell III2012). The quantitative determination of S is of prime interest, as this element is known to be fundamental for Mars evolution (King and McLennan Reference King and McLennan2010).
In the Mars 2020 mission, the SuperCam analytical equipment will include Raman and infrared spectrometers in addition to the LIBS instrument similar to the ChemCam instrument on-board Curiosity (Fouchet et al., Reference Fouchet, Wiens, Maurice, Johnson and Clegg2016; Wiens et al., Reference Wiens, Maurice and Rull2016; Ollila et al., Reference Ollila, Wiens, Perez, Nelson, Bodine, Maurice and Sharma2017). Relevant interpretations of Raman spectra in this study will require the acquisition of laboratory data under similar analytical conditions of the on-board Raman spectrometer. Although Raman spectroscopy is nominally non-quantitative with relevant calibration, it can be used for quantifying S at low concentrations (thousands of ppm) owing to the high Raman activity of S-bearing molecular groups (Morizet et al., Reference Morizet, Gennaro, Jego, Zajacz, Iacono-Marziano, Pichavant, Di Carlo, Ferraina and Lesne2017).
Previous studies have focused on the quantification of volatile species (H2O, CO2 and SO42−) in silicate glasses with application to Earth volcanism (Zajacz et al., Reference Zajacz, Halter, Malfait, Bachmann, Bodnar, Hirschmann, Mandeville, Morizet, Müntener, Ulmer and Webster2005; Mercier et al., Reference Mercier, Di Muro, Giordano, Métrich, Lesne, Pichavant, Scaillet, Clocchiatti and Montagnac2009; Le Losq et al., Reference Le Losq, Neuville, Moretti and Roux2012; Morizet et al., Reference Morizet, Brooker, Iacono-Marziano and Kjarsgaard2013a,Reference Morizet, Paris, Di Carlo and Scailletb, Reference Morizet, Gennaro, Jego, Zajacz, Iacono-Marziano, Pichavant, Di Carlo, Ferraina and Lesne2017). However, up to now, only the quantification of individual mineral species in polymineralic mechanical mixtures have been addressed using Raman spectroscopy (Kontoyannis et al., Reference Kontoyannis, Orkoula and Koutsoukos1997; Jehlicka et al., Reference Jehlicka, Vitek, Edwards, Heagraves and Capoun2009; Noguchi et al., Reference Noguchi, Shinoda and Masuda2009; Kriskova et al., Reference Kristova, Hopkinson, Rutt, Hunter and Cressey2013; Culka et al., Reference Culka, Košek, Drahota and Jehlička2014). Jehlicka et al. (Reference Jehlicka, Vitek, Edwards, Heagraves and Capoun2009) have shown the possibility of quantifying multi-component mixtures with a portable micro-Raman spectrometer, while in Kriskova et al. (Reference Kristova, Hopkinson, Rutt, Hunter and Cressey2013) and Noguchi et al. (Reference Noguchi, Shinoda and Masuda2009) only polymineralic mixtures with carbonates have been studied. Kontoyannis et al. (Reference Kontoyannis, Orkoula and Koutsoukos1997) have established a calibration for carbonates mixed with gypsum using Raman spectroscopy, but have not applied this to mineralogical mixtures representative of Martian mineralogy.
In the present work, we propose a calibration for quantifying the sulfate content (thereby also the elemental sulfur content) in polymineralic mixtures. This calibration will be used for quantifying S as sulfates on the surface of Mars with the Raman spectrometer of SuperCam. Several mixtures of sulfates (Ca-sulfate, Mg-sulfate) with silicate minerals (i.e. pyroxenes, olivine and plagioclase) were prepared in order to reproduce sulfate-bearing Martian-like sedimentary rocks. These mixtures were analysed by Raman spectroscopy. The equations derived from the calibration curves are then used to quantify sulfates in these mixtures. Finally, we discuss the potential of this method to quantify S carried by sulfates in the Martian soil and rocks.
Methods
Polymineralic mixtures preparation
Polymineralic mixtures were prepared from Ca-sulfate (CaSO42H2O) and Mg-sulfate (MgSO4·nH2O) synthetic powders and silicate minerals selected from natural rocks. Pyroxenes and olivine were extracted from a xenolith collected at the Maar du Borée, Massif Central, France, and plagioclase from Stillwater norite (Montana, USA). The compositions of the minerals selected for this study are reported in Table 1. Olivine is Mg-rich (forsterite, Si1.00Fe0.18Mg1.78Na0.01O4). The two pyroxenes have compositions close to enstatite (Si1.85Al0.16Fe0.16Mg1.62Ca0.02Na0.02O6) and augite end-members (Si1.78Al0.23Fe0.09Mg0.95Ca0.57Na0.11O6). The plagioclase is Ca-rich and has a composition close to the anorthite end-member (Si2.21Al1.76Fe0.01Mg0.01Ca0.85Na0.1O8). Natural silicate minerals were crushed in a steel mortar with a pestle and crushed again in an agate mortar. Ethanol was added during crushing to clean the samples.
Table 1. Origins and compositions of basaltic minerals (olivine, pyroxenes and plagioclase, determined by scanning electron microscopy analysis) and sulfates used in this investigation.
Mixtures of different silicate minerals and sulfates were prepared and mixed together. The resulting powder was not sieved because the grain size does not exceed 50 µm using this grinding procedure (see Fig. 1a). Several samples at various sulfate proportions were prepared: WFgypsum = 0.20, 0.10, 0.05, 0.03, 0.01 and WFMg-sulfate=0.20, 0.10, 0.05 and 0.03; where WF represents the Weight Fraction of sulfates. Ternary mixtures were prepared with Ca-sulfate, clinopyroxene and olivine. Gypsum, clinopyroxene and olivine concentrations in mixtures were, respectively: WFgypsum = 0.20, 0.10 and 0.05, WFclinopyroxene = 0.40, 0.40 and 0.45, WFolivine = 0.40, 0.50 and 0.50. The sulfate concentrations investigated are consistent with the abundances of these minerals estimated locally in evaporites at Meridiani Planum (McLennan et al., Reference McLennan, Bell, Calvin, Christensen, Clark, de Souza and Farmer2005) or in fluvio-lacustrine sedimentary rocks at Gale crater (Vaniman et al., Reference Vaniman, Martínez, Rampe, Bristow and Blake2017) on Mars.
Fig. 1. (a) Pellet of a 90/10 mixture of olivine (weight fraction WFolivine = 0.90) and gypsum (WFgypsum = 0.10) named GOLI90; (b) 5 mm mapping of spectrum intensities acquired by Raman spectroscopy showing the homogeneity of GOLI90; and (c) the average spectrum issued from the 5 mm mapping of GOLI90 with ν1 peaks (symmetric stretching mode of SiO4 and SO4 molecules) of olivine and gypsum reported.
We also prepared ternary mixtures in order to reproduce the suggested Martian surface mineralogy in a more realistic system: sulfates mixed with silicate minerals resulting from basalt alteration (Carter et al., Reference Carter, Poulet, Bibring, Mangold and Murchie2013; Forni et al., Reference Forni, Gaft, Toplis, Clegg, Maurice and Wiens2015; Cousin et al., Reference Cousin, Sautter, Payré, Forni, Mangold, Gasnault, Le Deit, Johnson, Maurice, Salvatore, Wiens, Gasda and Rapin2017; Mangold et al., Reference Mangold, Schmidt, Fisk, Forni, McLennan, Ming, Sautter, Sumner, Williams, Clegg, Cousin, Gasnault, Gellert, Grotzinger and Wiens2017). The resulting powders were then pressed into pellets (Fig. 1a). Pressures used were between 5000 and 9000 kg/cm2 to create pellets 7 and 10 mm diameter, respectively.
No mixtures with basaltic glasses were made due to the difficulty of establishing a Raman calibration for a glass component mixed with a crystal because of the large difference on the Raman spectrum intensity. Further work could be undertaken on this kind of mixture to constrain better the S abundance of Mars.
Raman spectroscopy
The non-destructive nature of the Raman analyses permits mineralogical characterisation (e.g. Reynard et al., Reference Reynard, Montagnac, Cardon, Dubessy, Caumon and Rull2012) of the Martian rocks without any sample preparation. The Raman spectroscopy uses a laser with a specific wavelength that excites the molecules (Brawer and White, Reference Brawer and White1975; Mysen and Virgo, Reference Mysen and Virgo1980a,Reference Mysen and Virgob; McMillan, Reference McMillan1984; Rossano and Mysen Reference Rossano, Mysen, Dubessy, Caumon and Rull2012; Rull, Reference Rull, Dubessy, Caumon and Rull2012). This excitation produces a Raman shift (i.e. the wavenumber difference between the signal from the laser and the response of excited molecules; Delhaye and Dhamelincourt Reference Delhaye and Dhamelincourt1975; Hoehse et al., Reference Hoehse, Mory, Florek, Weritz, Gornushkin and Panne2009; Dubessy et al., Reference Dubessy, Caumon, Rull, Sharma, Dubessy, Caumon and Rull2012). The strongest signatures received and detected by the Raman spectrometer are called ν1 signatures and correspond to the symmetric stretching of the molecules excited by the laser (Rossano and Mysen Reference Rossano, Mysen, Dubessy, Caumon and Rull2012; Rull Reference Rull, Dubessy, Caumon and Rull2012).
Raman spectra for each pellet were acquired using a Jobin-Yvon Labram HR800 spectrometer equipped with a solid-state laser diode operating at 532 nm. A 20× Olympus objective was used. A 785 nm solid-state laser has also been used for one sample (GPG80, plagioclase-gypsum mixture with WFgypsum = 0.20) to circumvent fluorescence. Spectra are acquired with a 300 grooves/mm grating with a 3 cm−1 spectral resolution. The output power of the laser was set to 74 mW for Ca-sulfate mixtures and 50 mW for Mg-sulfate. For binary mixtures, we did not use the confocal mode (with a hole calibrated around 50 µm) and the hole was fixed at 200 µm, however, ternary mixtures were analysed in a confocal mode due to fluorescence problems (Panzcer et al., Reference Panczer, De Ligny, Mendoza, Gaft, Seydoux-Guillaume, Wang, Dubessy, Caumon and Rull2012) in the non-confocal configuration.
The acquisition time varied from 3 to 10 s and 3 repetitive scans were made on each point. Background subtraction for each spectrum has been applied following the procedure of Tarcea and Popp (Reference Tarcea, Popp, Dubessy, Caumon and Rull2012): a fit of polylines (i.e. multiple lines added to create a baseline under the spectrum) was made for each spectrum to establish a baseline correction in order to measure areas and intensities for each peak. Peak intensity and area were determined on normalised spectra to the same acquisition time length (10 or 15 s). Details of the analytical conditions are reported in the Supplementary Material (Table S1).
Mapping of a large 5 mm by 5 mm area (Fig. 1b) was conducted on each pellet with a spot size of ~1.6 µm. Each analysis was performed every 150 µm. This mapping results in 1024 spectra representing the mixture analysed. As the grain size did not exceed 50 µm, possible coupling of the same crystal analysis is expected; this phenomenon would have occurred for every crystal as we have presumed that the mixture has a homogeneous grain size (Fig. 1a). Then, an average of these spectra, that considers the previous artefact, is computed to obtain a single Raman spectrum representative of the analysed mixture (Fig. 1c).
The effect of polarisation was also investigated on Raman spectra of pure minerals. We have observed that the spectrum intensity is modified when the acquisition angle on the crystal is changed, which is consistent with the results of Bremard et al. (Reference Bremard, Dhamelincourt, Laureyns and Turrell1986) and Rull (Reference Rull, Dubessy, Caumon and Rull2012), where polarisation effects have been observed and measured when changing crystal orientation. Nevertheless, we assumed that the polarisation effect is averaged out by the large mapping procedure adopted and considering that crystals in the pellet have all possible crystallographic orientations from a statistical point of view.
Mineral Raman spectra
The Raman spectra of individual minerals used in this study are in Fig. 2. The pure gypsum Raman spectrum (Fig. 2a) exhibits several peaks with low intensities in the 400–700 cm−1 region corresponding to the symmetric (400–500 cm−1) and antisymmetric (600–700 cm−1) bending vibrations of SO4 molecules (ν2 and ν4). The strong peak at 1006 cm−1 corresponds to the symmetric stretching vibration (or ν1) of S–O bonds in SO4 molecular groups (Knittle et al., Reference Knittle, Phillips and Williams2001; Buzgar et al., Reference Buzgar, Buzatu and Sanislav2009; Bishop et al., Reference Bishop, Lane, Dyar, King, Brown and Swayze2014). Peaks observed in the highest frequency region (>1100 cm−1) are attributed to antisymmetric stretch vibrations (ν3) of SO4 and have a weak Raman activity.
Fig. 2. Polymineralic Raman spectra of pure samples with acquisition time for (a) olivine; (b) Mg-sulfate; (c) gypsum; (d) plagioclase; (e) clinopyroxene; and (f) orthopyroxene. Significant peaks for each mineral are shown. For peak assignments see Table 2.
Table 2. Specific peak assignments for each mineral used in this study*.
*Principal peaks observed in spectra are described according to: [1] Huang et al. (Reference Huang, Chen, Huang, Lin and XU2000); [2] Prencipe et al. (Reference Prencipe, Mantovani, Tribaudino, Bersani and Lottici2011); [3] Sharma et al. (Reference Sharma, Simons and Yoder1983); [4] Wang et al. (Reference Wang, Jolliff, Haskin, Kuebler and Viskupic2001); [5] Chopelas (Reference Chopelas1991); [6] Kolesov and Tanskaya (Reference Kolesov and Tanskaya1996); [7] Kolesov and Geiger (Reference Kolesov and Geiger2004); [8] McKeown et al. (Reference McKeown, Bell and Caracas2010); [9] Freeman et al. (Reference Freeman, Wang, Kuebler, Jolliff and Haskin2008); [10] Bishop et al. (Reference Bishop, Lane, Dyar, King, Brown and Swayze2014); [11] Buzgar et al. (Reference Buzgar, Buzatu and Sanislav2009); and [12] Knittle et al. (Reference Knittle, Phillips and Williams2001).
**‘M’ = different metal cations present in the chemical structure of the mineral (Buzgar et al., Reference Buzgar, Buzatu and Sanislav2009).
aν1: Symmetric stretch; bν2: symmetric bending; cν3: antisymmetric stretch; dν4: antisymmetric bending.
In common with gypsum, the principal symmetric ν1 vibration of Mg-sulfate is identified in Fig. 2b around 1040 cm−1 (Buzgar et al., Reference Buzgar, Buzatu and Sanislav2009). Antisymmetric bending and stretching of SO4 molecules are observed at 620 and 1110 cm−1, respectively.
The Raman spectrum of olivine (Fig. 2c) shows two strong peaks above 800 cm−1, followed by two less intense peaks above 900 cm−1, which are attributed to the symmetric stretch of the Si–O bonds of SiO4 tetrahedrons (Chopelas Reference Chopelas1991; Kolesov and Tanskaya Reference Kolesov and Tanskaya1996; Kolesov and Geiger Reference Kolesov and Geiger2004; Kuebler et al., Reference Kuebler, Jolliff, Wang and Haskin2006; McKeown et al., Reference McKeown, Bell and Caracas2010).
Plagioclase Raman spectrum shown in Fig. 2d exhibits a strong peak around 500 cm−1 attributed to the ν1 of Al2O3 or SiO4 tetrahedrons in the tectosilicate structure (Sharma et al., Reference Sharma, Simons and Yoder1983; Freeman et al., Reference Freeman, Wang, Kuebler, Jolliff and Haskin2008). Peaks identified at higher wavenumbers correspond to the ν3 vibrations for these tetrahedrons.
Pyroxene spectra shown in Figs 2e and 2f are similar in the high-frequency region (>600 cm−1) where bending and stretching vibrations of SiO4 tetrahedrons are observed, for signatures around 660 and 1006 cm−1 respectively. At low frequency, in the 200–400 cm−1 region, it is possible to discriminate clinopyroxene from orthopyroxene, which does not present the same peak intensities. In this region, vibrations related to Fe, Ca and Mg molecular environments are responsible for the observed peaks (Sharma et al., Reference Sharma, Simons and Yoder1983; Huang et al., Reference Huang, Chen, Huang, Lin and XU2000; Wang et al., Reference Wang, Jolliff, Haskin, Kuebler and Viskupic2001; Prencipe et al., Reference Prencipe, Mantovani, Tribaudino, Bersani and Lottici2011; Tribaudino et al., Reference Tribaudino, Mantovani, Bersani and Lottici2012). Specific peak assignments for each mineral investigated are described in Table 2.
Analytical conditions useable for the SuperCam instrument
The new rover for the 2020 Mars mission will use a laser-pulse Raman spectrometer with a 532 nm solid-state laser (Ollila et al., Reference Ollila, Wiens, Perez, Nelson, Bodine, Maurice and Sharma2017; Wiens et al., Reference Wiens, Maurice and Rull2016). The rover will target rocks and soil from several meters away and with a resolution on the order of 10 cm−1 (Wiens et al., Reference Wiens, Maurice and Rull2016).
Knowing those conditions, we performed several tests to analyse the pellets. A map size of 5 mm by 5 mm was necessary to reproduce the mineral mixtures adequately. Using a 2 × 2 or 3 × 3 mm map size was not sufficient to retrieve the initial mineral proportions in the mixture. Furthermore, the 5 × 5 mm size map is also consistent with the analytical conditions for the 2020 rover, which will have a large analytical area. The adopted laboratory analytical conditions (i.e. focus 20×, 300 grooves/mm grating and non-confocal mode) were optimised to obtained spectra that could be compared to the Raman spectra that will be acquired by SuperCam.
Calibration method
The calibration method in the present investigation is similar to that used by Kontoyannis et al. (Reference Kontoyannis, Orkoula and Koutsoukos1997), Noguchi et al. (Reference Noguchi, Shinoda and Masuda2009) and Kristova et al. (Reference Kristova, Hopkinson, Rutt, Hunter and Cressey2013). Our method is based on the spectral deconvolution of the Raman spectrum of the pure minerals investigated in the previous section. For example, to establish a calibration on a gypsum–olivine mixture, the pure spectrums of gypsum and olivine are treated individually. The spectrum treatment consists of extracting peak information using subsequent deconvolution. As we are analysing crystallised species, we expect the Raman signature to have a pure Lorentzian shape; however, a contribution of a Gaussian component in addition to the Lorentzian signal has been observed. This is probably caused by intrinsic crystal defaults. Therefore, we used a Voigt simulation (i.e. a mix of Gaussian and Lorentzian deconvolution) which provides better simulations of our spectra. The simulation equation of a Voigt deconvolution is given below (Eq. 1):
Where y 0 and y are the intensity after a baseline correction of the spectrum and the intensity for the simulated peak, respectively. The parameter A represents the simulated area and W G and W L are, respectively, the Gaussian and Lorentzian widths for a given peak. The x parameter is the position in cm−1; where x is the Raman shift and x c is the derived peak position simulated in cm−1. Finally, in equation 1, t is the time component, though as the Raman spectra are not time-dependent, t is set to 0. All the peaks simulated for pure mineral spectra, with their specific parameters (width, position and area) are reported in Supplementary Table S1. For clarity, simulations of silicate and sulfate minerals pure spectra are also only shown in the Supplementary material (Fig. S1).
Due to the strong overlapping between the different spectral lines in the recovered average Raman spectrum for each pellet, it was not possible to perform the simulation of all the identified peaks for the pure spectrum of the minerals reported in Table 2. For instance, clinopyroxene has a main peak at 1006 cm−1 comparable to the one in the gypsum Raman spectrum. Therefore, simulating those two peaks in the average mixed spectrum is complicated by their proximity and a relevant simulation could not be achieved. Hence, for each species, we have selected peaks that are distinct in their position. These are indicated in Table 3.
Table 3. Samples prepared in this study for binary and ternary mixtures with sulfates (Ca and Mg) and basaltic minerals (i.e olivine, orthopyroxene, clinopyroxene and plagioclase). For each mixture the simulated peak is given, followed by the resulting calibration equation.*
*Notes: WFtheroetical, WFcalculated = theoretical and calculated weight fractions, respectively; a = coefficient. Errors related to calculations are reported in brackets next to WFcalculated and ‘a’ coefficient.
The protocol to simulate Raman peaks is described fully in previous investigations and is used routinely for the quantification of volatiles species in silicate glasses (Mysen and Virgo Reference Mysen and Virgo1980a,Reference Mysen and Virgob; Mercier et al., Reference Mercier, Di Muro, Giordano, Métrich, Lesne, Pichavant, Scaillet, Clocchiatti and Montagnac2009; Morizet et al., Reference Morizet, Brooker, Iacono-Marziano and Kjarsgaard2013a, Reference Morizet, Gennaro, Jego, Zajacz, Iacono-Marziano, Pichavant, Di Carlo, Ferraina and Lesne2017). First, we have fixed the peak position and widths (Gaussian and Lorentzian), leaving only the peak area optimised. The position is then optimised as we observed slight variations in the peak position in our mixtures compared to the position derived from the acquired pure spectrum. These variations could be due to the dependence of the Raman signature on crystal orientation or unaccounted for chemical heterogeneity. The Gaussian and Lorentzian widths are also optimised to better fit our simulations. This procedure is repeated several times until the chi-square (χ2 parameter representing the robustness of the fit) is the lowest possible and the residuals are small (see Fig. 3).
Fig. 3. Global spectra for every mixture of olivine with gypsum in different proportions: (a) WFolivine = 0.99; (b) WFolivine = 0.95; (c) WFolivine = 0.90; and (d) WFolivine = 0.80; with their main peaks reported. Variations of gypsum ν1 (symmetric stretch of SO4) peak intensity are shown as red arrows. Magnified (890–1100 cm−1 area) spectra acquired by Raman spectroscopy after mapping, from different mixtures of olivine with gypsum in several proportions: (e) WFgypsum = 0.01; (f) WFgypsum = 0.05; (g) WFgypsum = 0.10; and (h) WFgypsum = 0.20. Spectra are correlated with peak simulations: blue for olivine and green for gypsum. Red curves are cumulative peaks and black dotted lines are residuals from simulations. Weight fractions are calculated with peak simulations and reported in boxes in each graph and in Table 3.
With parameters extracted from simulations, we were able to calculate the mixed proportions present in the analysed pellet. We determined a ratio R between the simulated area for the peak of the mixed spectrum and that of the pure spectrum such as:
In equation 2, A represents the area determined with a Voigt simulation for a same peak for the mixture (A mixture) and the pure Raman spectrum (A pure). This method differs from previous Raman calibrations studies of Kontoyannis et al. (Reference Kontoyannis, Orkoula and Koutsoukos1997) and Kristova et al. (Reference Kristova, Hopkinson, Rutt, Hunter and Cressey2013) where peak intensities were chosen instead of areas. As we observed several variations in intensity and peak positions between pure spectra and the average spectra of the mixtures, we consider that using peak areas averaged out every possible variation between acquisitions with the 300 grooves/mm grating. The ratios are then normalised to obtain the result as a weight fraction (WF). This proportion is then assimilated to a coefficient ‘a’:
with A being peak areas for gypsum (A gypsum) and for mineral in the mixture (A mineral). For the ternary mixtures with more than two peaks simulated for one mineral, A mineral is entirely summed in the denominator. Examples of pure mineral spectra and mixture deconvolutions are provided in the Supplementary Fig. S1.
Results
Binary and ternary mixtures with Ca-sulfate
A typical example of the spectral treatment is shown in Fig. 3. In Fig. 3a Raman spectra has been collected that represents olivine and gypsum mixtures with WFgypsum = 0.2, 0.1, 0.05 and 0.01. The Raman spectra obtained for the mixtures with other minerals (pyroxenes and plagioclase) are reported in Supplementary Fig. S2. In Fig. 3a, it can be observed that the peak intensity for ν1 gypsum at 1006 cm−1 increases with increasing the proportion of gypsum in the mixture. For instance, in GOLI80 WFgypsum = 0.20 (see Table 3 for theoretical WF of each mixture), the 1006 cm−1 symmetric stretch peak is more intense as compared to the one in GOLI90 (WFgypsum = 0.10). For these two mixtures, the measured intensity in the SO4 vibrations peak is twice for GOLI80 as compared to the one in GOLI90, which appears to be consistent with the prepared compositions (Table 3). Although the gypsum content in the GOLI99 mixture is extremely low (WFgypsum = 0.01), the peak at 1006 cm−1 is still detected because of the strong Raman activity of symmetric stretch of the S–O bonds in SO4 molecular groups in gypsum (see Fig. 3a).
We chose to simulate three different peaks in the 890–1100 cm−1 region and located at 914, 958 for olivine and 1006 cm−1 for gypsum (Fig. 3). For olivine mixtures, relevant results were obtained when considering two Raman peaks identified in Table 2: 914 cm−1 for olivine and 1006 cm−1 for gypsum. In order to avoid contribution of the 1006 cm−1 gypsum peak over the 950 cm−1 of olivine (see on Fig. 3e–h), we have simulated the olivine peak at 914 cm−1. The robustness of our simulations is asserted by the small residual observed in Fig. 3e–h. For a theoretical proportion mixture of 0.80 and 0.20 weight fraction of olivine and gypsum, respectively (Fig. 3d), the calculated proportions (from equations 2 and 3) are 0.79 (0.08, error relative to simulations) for olivine and 0.21 (0.01) for gypsum (Fig. 3h). With a lower Ca-sulfate proportion, we obtain consistent results in between the measured and theoretical mixtures. For initial proportions at 0.90 and 0.10, we calculate 0.91 (0.01) for olivine and 0.09 (0) for gypsum (Fig. 3c and 3g). The same applies with the 0.01 and 0.05 mixtures of gypsum where 0.01 (0.01) and 0.06 (0) weight fraction of gypsum is calculated respectively, as shown in Fig. 3a,b and Fig. 3e,f.
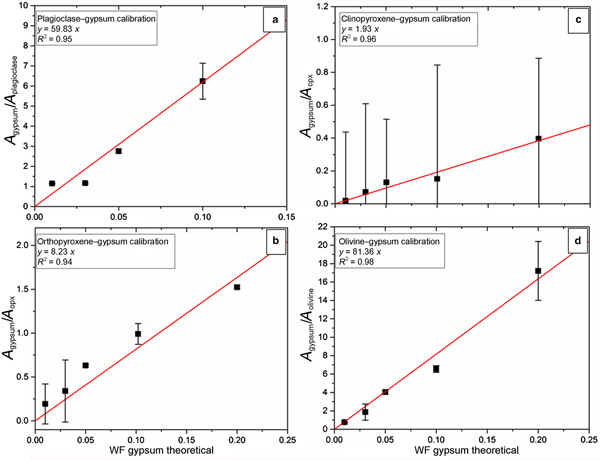
The calculated coefficients from simulated areas in each mixture (see equation 3) as a function of the theoretical CaSO4 content are shown in Fig. 4. The results are represented for the different mixtures with basaltic minerals: plagioclase–gypsum mixture in Fig. 4a; orthopyroxene–gypsum in Fig. 4b; and clinopyroxene and olivine–gypsum in Fig. 4c and 4d, respectively. Results from simulations are reported in Table 3. In Fig. 4, we can observe that the best calibration (based on the linear regression coefficient R 2 which defines the quality of the linear regression on experimental data) is obtained for olivine–gypsum simulations compared to the calibration with other silicate minerals. Simulations (Figs 4a to 4c) show good R 2 with 0.95, 0.94 and 0.96 for plagioclase, orthopyroxene and clinopyroxene, respectively. The plagioclase mixture with 0.20 weight fraction of gypsum (i.e. GPG80, see Table 3) has been calibrated using different peaks because of the use of the 785 nm laser for our analysis. Consequently, this point is not reported in Fig. 4a.
Fig. 4. Calibration coefficients calculated from simulated areas of gypsum and mineral mixes versus the theoretical weight fraction (WF) of gypsum. Black squares are simulated samples with their relative errors. Red lines correspond to calibration lines extrapolated from calibration coefficients depending on the theoretical weight fraction of gypsum. Calibration lines established on four binary mixtures of: (a) plagioclase; (b) orthopyroxene; (c) clinopyroxene; and (d) olivine; with gypsum in different proportions (WFgypsum = 0.20, 0.10, 0.05, 0.03, 0.01). Equations and linear regression coefficient (R 2) of each calibration line are reported in boxes in each graph.
We adopted the same procedure for ternary mixtures as for binary mixtures. The retained peak positions for our simulations are reported in Table 3. We considered the 300–390 cm−1 clinopyroxene peak areas, representative of Ca–O stretching vibrations, as they are isolated from the contribution of olivine and gypsum peaks in the Raman spectrum. For olivine, we consider the 947 cm−1, one of SiO4 symmetric stretching vibrations signatures, and 485 cm−1 for gypsum which represents the bending of SO4 molecules. Those peaks were selected because they were the most separated from each other.
Simulation results and derived coefficients are reported in Table 3. We established a calibration expressed with the coefficient calculated (equation 3) from areas simulated for each mineral according to the initial weight fraction of gypsum, indicated in Fig. 5; we obtained a good calibration with R 2 = 0.99 on ternary mixtures.
Fig. 5. Calibration line for ternary mixtures of gypsum (WFgypsum = 0.2, 0.1, 0.05) with olivine (WFolivine = 0.40, 0.50, 0.50) and clinopyroxene (WFclinopyroxene = 0.40, 0.40, 0.45). Black squares are simulation results with errors (black vertical lines). Red line is the calibration line calculated from simulation results. Equation and regression linear coefficient (R 2) are specified in the graph box.
Binary mixtures with Mg-sulfate
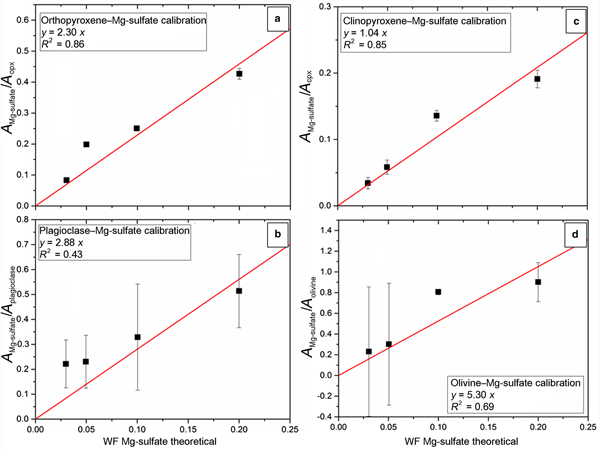
As for Ca-sulfate mixtures, we proceeded with the same method for pellets containing Mg-sulfate. Results are given from Mg-sulfate calibration on Fig. 6 where the same mixtures of natural silicate minerals of olivine, pyroxenes and plagioclase are represented. In Figs 6a and 6c, pyroxene calibration with Mg-sulfate are shown. The R 2 is fairly good (0.86 for orthopyroxene mixtures and 0.85 for clinopyroxene) and initial proportions of Mg-sulfate can be estimated satisfactorily from our method. Plagioclase mixtures with Mg-sulfate are reported on Fig. 6b, where we obtained R 2 = 0.43 and show less consistent results. Finally, olivine mixtures with initial proportions of Mg-sulfate (Fig. 6d) result in R 2 = 0.69. All results of calculated mixture proportions are reported in Table 3.
Fig. 6. Calibration coefficients calculated from simulated areas of Mg-sulfate and mineral mixes versus the theoretical weight fraction (WF) of the sulfate. Black squares are simulated samples with their relative errors. Red lines correspond to calibration lines extrapolated from calibration coefficients depending on theoretical weight fraction of Mg-sulfate. Calibration lines established on four binary mixtures of: (a) orthopyroxene; (b) plagioclase; (c) clinopyroxene; and (d) olivine; with Mg-sulfate in different proportions (WFgypsum = 0.20, 0.10, 0.05 and 0.03). Equations and linear regression coefficients (R 2) of each calibration lines are reported in boxes for every graph.
Discussion
Binary and ternary mixtures with sulfates were calibrated with several different proportions of sulfate. In this section, we discuss the limit of our calibration method and its application to the Martian context.
Detection limit of sulfur
In Fig. 4 we have reported results from binary mixtures of gypsum. We reported error bars extracted from errors under simulated peak areas. As can be observed in Figs 4b and 4c, corresponding to pyroxene-bearing mixtures, samples with 0.03 and 0.01 weight fractions of gypsum present a significant error in calculated values. Some selected peaks for the calibration do not exhibit a high Raman activity but we had to select those peaks, due to the necessity of choosing individual peaks for our simulations. In Table 3, we can see that we have still a good agreement between the calculated proportions and the initial proportions within the mixtures. Considering that some of molecule vibrations are less Raman active relative to Raman spectroscopy, we consider that our method of calibration is reliable until WFsulfate = 0.03 weight fraction in a mechanical mixture.
Knowing this detection limit for our calibration, we can extrapolate this method to Martian rocks. With the proposed method and the calibration equations, S could be determined at the surface of Mars for a sedimentary rock containing sulfate until WFS = ~0.007 weight fraction (i.e. 7000 ppm). Below this S content, our calibration can still be applied, but the errors will be higher and results might not be reliable.
Application of the calibration curves to the determination of sulfur on the Martian surface
The calibration results for all the mixtures created are given in Fig. 7, showing the good agreement of our calibration method. This plot shows that the calculated proportions of gypsum are close to the theoretical proportions and all data points are aligned along the 1:1 line. Ternary mixtures with gypsum are also represented and are in good accordance. Mg-sulfate mixtures in Fig. 7 also show that the calibration is good and data points are aligned along the 1:1 line.
Fig. 7. Weight fractions calculated for sulfates (Ca- and Mg-sulfate) depending on its theoretical weight fraction in each mixture of olivine, clinopyroxene, orthopyroxene and plagioclase. Black = gypsum binary samples; blue = Mg-sulfate mixtures; red diamonds = ternary mixtures of gypsum.
All the calibration equations calculated from our calibration method for gypsum and Mg-sulfate mixtures are reported in Table 3.
As a result, we can determine the sulfate content in a mixture with olivine, pyroxenes and plagioclase in unknown proportions according to equations extracted from our simulations shown in Figs 4, 5 and 6. Using a Raman spectrum obtained on the surface of Mars of a mechanical solid mixture containing sulfate (Ca or Mg), and simulating specific peaks (reported in Table 3), a coefficient can be calculated (i.e. the ‘a’ component in the equations in Table 3).
The calibration method established in present study based on Raman spectroscopy will be of use for the 2020 Mars mission to quantify S abundance when present as sulfates. However, the peak selections from a Raman spectrum must be conducted with care. We suggest using only the peaks mentioned in the present work and reported in the Supplementary Table S1. However, this will be dependent on the resolution of the SuperCam Raman spectrometer and the quality of the acquired signal (Wiens et al., Reference Wiens, Maurice and Rull2016). In the case of a low resolution, peaks with low intensities (for instance ν3) will be difficult to constrain. However, other peaks mentioned in the Supplementary Table S1, such as ν1 or ν2 can be defined sufficiently well by the future rover and calibration can still be applicable (see peak information in Supplementary Table S1). As our analyses were performed with a high-resolution Raman spectrometer, further analyses will be acquired with a pulsed-Raman with distance from the sample similar to the one presupposed for SuperCam in order to compare data and modify, if necessary, the calibration.
Furthermore, Mars mineralogy has been partly investigated using remote sensing and rover data, as well as Martian meteorites, showing that pigeonite and augite are the two most common pyroxenes found in Martian rocks (both are clinopyroxenes but with low Ca content for pigeonite) (e.g. Lodders Reference Lodders1998, Agee and Draper Reference Agee and Draper2004; Mustard et al., Reference Mustard, Poulet, Bibring, Langevin, Gondet, Mangold, Bellucci and Altieri2005; Cousin et al., Reference Cousin, Sautter, Payré, Forni, Mangold, Gasnault, Le Deit, Johnson, Maurice, Salvatore, Wiens, Gasda and Rapin2017; Morrison et al., Reference Morrison2018). Mg-rich olivine, orthopyroxene and plagioclase have also been detected in Martian meteorites and at the surface of the planet (Agee and Draper Reference Agee and Draper2004; Mustard et al., Reference Mustard, Poulet, Bibring, Langevin, Gondet, Mangold, Bellucci and Altieri2005; Dehouck et al., Reference Dehouck, McLennan, Meslin and Cousin2014; Cousin et al., Reference Cousin, Sautter, Payré, Forni, Mangold, Gasnault, Le Deit, Johnson, Maurice, Salvatore, Wiens, Gasda and Rapin2017; Morrison et al., Reference Morrison2018). Nonetheless, Fe-rich olivine can be expected in small amounts which only differs in spectral signature by the relative intensity between the double peak around 800–850 cm−1. As our calibration is not based on those peaks (see Table 3), the quantification of sulfate with fayalite can still be possible. Plagioclase such as anorthite may be the most common feldspar on Mars (Bish et al., Reference Bish, Blake, Vaniman, Chipera, Morris, Ming and Treiman2013; Blake et al., Reference Blake, Morris, Kocurek, Morrison, Downs, Bish and Ming2013; Vaniman et al., Reference Vaniman, Martínez, Rampe, Bristow and Blake2017) although andesine has been observed as the predominant plagioclase at Gale crater by the Curiosity rover instruments (Sautter et al., Reference Sautter, Toplis, Beck, Mangold, Wiens, Pinet, Cousin and Maurice2016; Morrison et al., Reference Morrison2018). Consequently, the proposed calibration method can be useable for a mixture of sedimentary rocks containing sulfates and silicate minerals even if the minerals present do not have the same composition within a solid solution as used in our study.
Summary
In the present investigation, we have prepared pellets by mixing Ca and Mg sulfates with silicate minerals commonly found in basalt (olivine, pyroxenes and plagioclase) in order to investigate the Raman signature of polymineralic mechanical assemblages. The main objective was to establish a relevant calibration for the determination of S content at the surface of Mars with analytical conditions close to the future Raman spectrometer on SuperCam equipment for the 2020 spatial mission. Calibration equations were obtained for both binary and ternary mixtures of CaSO4 with minerals for a range of gypsum weight fractions (0.01 to 0.20). Equations were also estimated from Mg-sulfate mixtures with initial proportions of 0.03 to 0.20 weight fraction.
The protocol used in this study involves simulations of the resulting average Raman spectrum using a Voigt distribution on peaks attributed to each mineral. The simulation of the entire Raman spectrum does not have good enough accuracy and careful attention is necessary for peak identifications. The actual method could be applied to the quantitative characterisation of the soil of Mars which is known to contain sedimentary rocks containing sulfates and silicate minerals obtained from bedrock erosion.
Given our equations extracted from calibrations on both Mg and Ca sulfates, we would be able to calculate a coefficient from a given Raman spectrum acquired on Mars and treated according to specific peak simulations. Coupling this coefficient with the proper calibration equation (i.e. when knowing the mineralogical characterisation of the mixture analysed) we can estimate the proportion of this sulfate in the weight fraction. By extent, this calibration could be used to constrain part of the S content at the surface carried by sulfate mineral phases. We have estimated the detection limit of S at 7000 ppm which is well below the current detection limit by the LIBS technique (e.g. Wiens et al., Reference Wiens, Maurice, Barraclough, Saccoccio, Barkley and Bell III2012; Nachon, Reference Nachon2016; Nachon et al., Reference Nachon, Mangold, Forni, Kah, Cousin, Wiens and Anderson2017; Anderson et al., Reference Anderson, Ehlmann, Forni, Clegg, Cousin and Thomas2017). Nevertheless, further calibrations are required involving more complex mineral mixtures, including other sulfates (Fe-sulfate) and sulfides, and mixtures with more than four compounds. Calibration using a Martian basalt glass analogue in the presence of sulfates could also be established to better constrain the S quantification on the surface of Mars.
Acknowledgements
We thank particularly the Université de Nantes, the LPG and Institut des Matériaux de Nantes Jean Rouxel for their support with experimental and analytical facilities. We also thank Jean Pierre Lorand (LPG) for providing the rocks used in our samples. We acknowledge the support of the Centre National d'Etudes Spatiales (CNES), the Région Pays de la Loire and the Agence Nationale de la recherche (ANR) under the contract ANR-16-CE31-0012 entitled “Mars-PRIME”.
Supplementary material
To view Supplementary material for this article, please visit https://doi.org/10.1180/mgm.2018.147