Introduction
The geology and mineralization of the northern limb of the Bushveld Complex has been the topic of many studies, covered by a number of authors (i.e. Kinnaird, Reference Kinnaird2005; Kinnaird et al., Reference Kinnaird, Hutchison, Schurmann, Nex and de Lange2005; Ashwal et al., Reference Ashwal, Webb and Knoper2005; Maier et al., Reference Maier, de Klerk, Blaine, Manyeruke, Barnes, Stevens and Mavrogenes2008; McDonald and Holwell, Reference McDonald, Holwell, Ripley and Li2011). Most of the attention has been paid to the world class PGE deposit of the Platreef but the discovery of mineralization hosted in the upper stratigraphic units both in the far north (McDonald et al., Reference McDonald, Harmer, Holwell, Hughes and Boyce2017; Kinnaird et al., Reference Kinnaird, Yudovskaya, McCreesh, Huthmann and Botha2017) and south of the limb (Maier and Barnes, Reference Maier and Barnes2010; Holwell et al., Reference Holwell, Jones, Smith and Boyce2013) fundamentally changed the exploration target concept. Some earlier studies proposed that the northern limb terminated at the Hout River Shear Zone (Grobler and Whitfield, Reference Grobler and Whitfield1970) and linked in an arc with the Villa Nora fragment, although van der Merwe (Reference Van der Merwe1976) suggested that the northern limb extends further north beneath cover. This was confirmed by exploration in 2010/2011 that led to the discovery of mineralized Bushveld rocks by Platinum Group Metals (PTM) beneath Waterberg Group sediments north of the Hout River Shear Zone. The Bushveld succession in the Waterberg Project hosts two mineralized zones, a lower ultramafic F mineralized zone and an upper mineralized T zone in a gabbronorite-dominated package.
In this paper, we present for the first time detailed mineralogical characteristics of the sulfide and PGM mineralization for both mineralized zones of the Waterberg Project. The basal F zone is compared with the Platreef marginal style mineralization whereas ore mineralogy and noble metal deportment of the T zone is somewhat unique in the Bushveld. To some extent the lithological heterogeneity of the host package resembles the diversity of the rocks hosting Platreef-style mineralization further to the south, however, the stratigraphic position, felsic-rich host rocks, PGE, Au and base-metal ratios of the T zone cannot be directly correlated with any known mineralization in the Bushveld Complex. A model for the emplacement of the mineralized succession of the Waterberg Project is based on our new PGE and PGM data and takes into account petrochemical constraints that suggest chonolith-like intrusions of the Ultramafic Sequence (Kinnaird et al., Reference Kinnaird, Yudovskaya, McCreesh, Huthmann and Botha2017: Huthmann et al., Reference Huthmann, Yudovskaya, Kinnaird, McCreesh and McDonald2018).
Bushveld Complex geology
The 2055.91 ± 0.26 Ma (Zeh et al., Reference Zeh, Ovtcharova, Wilson and Schaltegger2015) Bushveld Complex is the largest layered intrusion on Earth and hosts the world's largest magmatic ore deposits (Fig. 1) (Lee, Reference Lee and Cawthorn1996). The Bushveld Complex was emplaced as five limbs with an estimated areal extent of ~>90000 km2 according to recent geophysical estimates (Finn et al., Reference Finn, Bedrosain, Cole, Khoza and Webb2015) and results of the drilling underneath the cover of the Waterberg Group sediments (Kinnaird et al., Reference Kinnaird, Yudovskaya, McCreesh, Huthmann and Botha2017) north of the exposed northern limb.
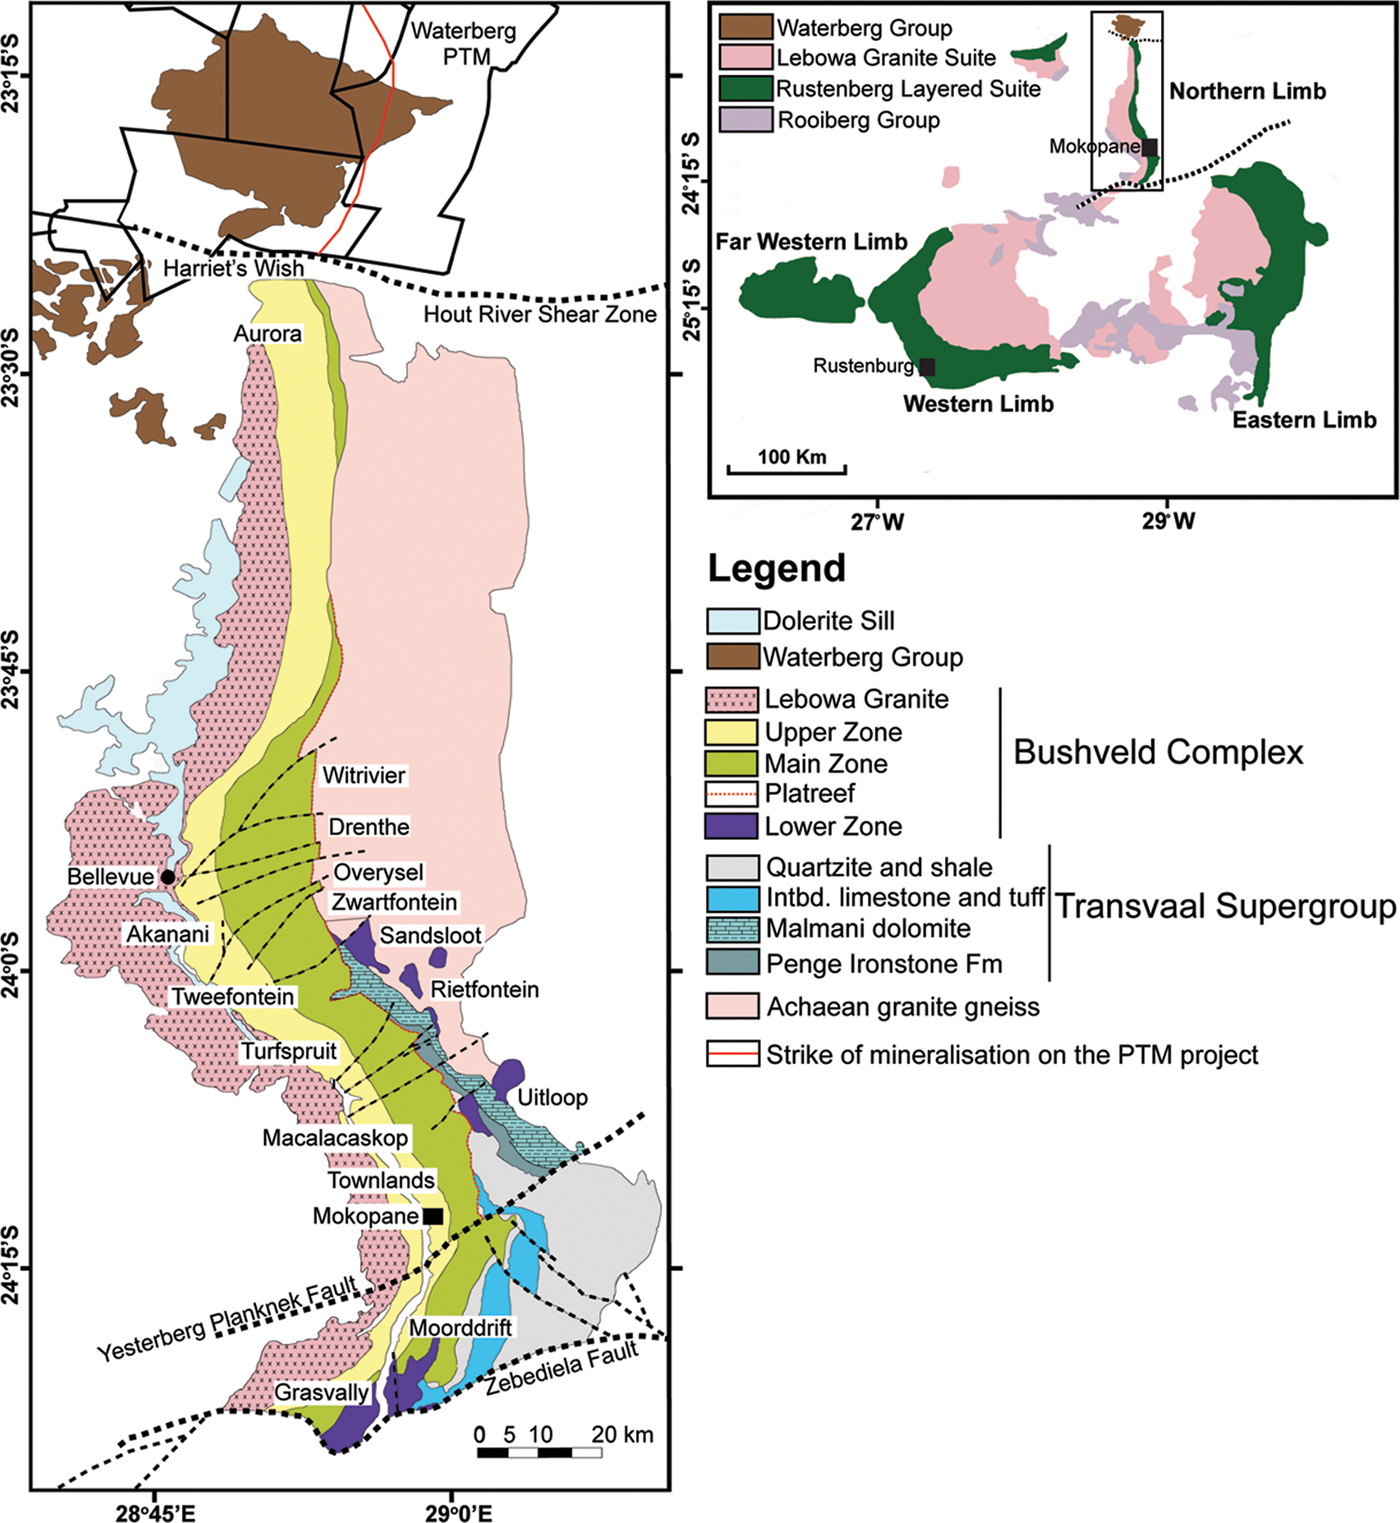
Fig. 1. Schematic geological map of the Bushveld Complex and enlarged map of the northern limb including the extension of the Waterberg Project in the far north. Modified after 1:250 000 geological map of the northern limb (van der Merwe, Reference Van der Merwe1976).
The Bushveld Complex is subdivided into the Rooiberg Group, the Rustenburg Layered Suite, the Rashoop Granophyre Suite and the Lebowa Granite Suite (Cawthorn et al., Reference Cawthorn, Eales, Walraven, Uken, Watkey, Johnson, Anhaeusser and Thomas2006). The 7–8 km thick Rustenburg Layered Suite is further subdivided into the Basal Ultramafic Sequence, Marginal, Lower, Critical, Main and Upper Zones, comprising rock types ranging from dunite, chromitite, pyroxenite to norite, anorthosite and gabbronorite to gabbrodiorite (von Gruenewaldt et al., Reference von Gruenewaldt, Sharpe and Hatton1985; Wilson et al., Reference Wilson2015).
The northern limb is separated from other limbs of the Bushveld Complex by the long-lived Thabazimbi-Murchison Lineament and its connection with the western and eastern limbs (Fig. 1) remains debatable. The limb is exposed over a strike length of 110 km (Fig. 1) and extends from the Zebediela Fault, a branch of the Thabazimbi-Murchison Lineament in the south, to the Hout River Shear Zone in the north. The northern limb succession overlies progressively older Paleoproterozoic Transvaal Supergroup metasediments in the south to Archean granite-gneisses in the far north (van der Merwe, Reference Van der Merwe1976). North of the Ysterberg-Planknek Fault, the earliest intrusions were fine-grained noritic to pyroxenitic sills of the Marginal Zone which occur in contact with metamorphosed sediments beneath and above the Lower Zone. The Lower Zone north of the Ysterberg-Planknek Fault was emplaced into trough-like depressions forming chonolith-like intrusions within the Transvaal metasedimentary rocks and the Archaean granite-gneisses (van der Merwe, Reference Van der Merwe1976; Yudovskaya et al., Reference Yudovskaya, Kinnaird, Sobolev, Kuzmin, McDonald and Wilson2013). Originally this Lower Zone was believed to be limited to satellite bodies cutting Archaean Granite (van der Merwe, Reference Van der Merwe1976), but is now known to form a sequence, up to 800 m thick, beneath the Platreef on Sandsloot and Turfspruit (Yudovskaya et al., Reference Yudovskaya, Kinnaird, Sobolev, Kuzmin, McDonald and Wilson2013). The next unit holds the stratigraphic position of the Critical Zone and is called the Platreef. The Main Zone unconformably overlies the Platreef. It is ~2000 m thick and comprises gabbronorite and norite with minor anorthosite and pyroxenite layers and hosts a 100 m thick troctolitic horizon, 100 m above the base, which does not occur in the Main Zone in the rest of the Bushveld Complex (van der Merwe, Reference Van der Merwe1976; Ashwal et al., Reference Ashwal, Webb and Knoper2005). The Main-Upper Zone boundary in the main Bushveld Complex was defined by the first occurrence of cumulus magnetite, which forms up to 20 magnetitite layers further up the sequence (SACS, Reference Kent1980). However, Ashwal et al. (Reference Ashwal, Webb and Knoper2005) defined the Main-Upper Zone boundary in the northern limb on the appearance of disseminated magnetite as detected by magnetic susceptibility measurements. This parameter placed the boundary ~50 m below the first cumulus magnetite in the Bellevue drill-core. These changes in magnetic susceptibility proved a useful correlation between boreholes cored in the Waterberg Project for definition of the Main-Upper Zone boundary area (Kinnaird et al., Reference Kinnaird, Yudovskaya, McCreesh, Huthmann and Botha2017).
The Platreef
The Platreef is developed north of the Ysterberg-Planknek Fault (Fig. 1) (Wagner, Reference Wagner1929; van der Merwe, Reference Van der Merwe1976) as a series of mafic-ultramafic sills with incorporated interlayers of metasedimentary footwall rocks (Kinnaird et al., Reference Kinnaird, Hutchison, Schurmann, Nex and de Lange2005). The Platreef carries Ni-Cu-PGE mineralization of three different types: massive sulfide bodies at the base, marginal or contact disseminated ore in hybrid rocks, and exoskarns as well as and reef-style mineralization hosted by feldspathic pyroxenite and harzburgite at the top, near the boundary with the Main Zone (Yudovskaya et al., Reference Yudovskaya, Kinnaird, Grobler, Costin, Abramova, Dunnett and Barnes2017). The variable footwall plays a controlling role in the PGM assemblage of the disseminated marginal style mineralization along the Platreef strike (Holwell and McDonald, Reference Holwell and McDonald2006; Nichol and Kinnaird, Reference Nichol and Kinnaird2008). In the southern and northern sectors, where the footwall is unreactive quartzite and anhydrous gneiss, these floor rocks allow for limited fluid activity and the PGE are controlled by sulfide liquids (Holwell and McDonald, Reference Holwell and McDonald2006; Maier et al., Reference Maier, de Klerk, Blaine, Manyeruke, Barnes, Stevens and Mavrogenes2008). In the central sector, highly reactive footwall rocks such as dolomite and shale of the Malmani Subgroup and Duitschland Formation were dehydrated during metamorphism or assimilation and the fluid released remobilized PGE and base-metal sulfides (BMS) forming low temperature PGE mineralization (Hutchison and Kinnaird, Reference Kinnaird2005). High-grade zones may locally occur within the disseminated sulfides in exoskarn, hydrid and magmatic rocks (Holwell et al., Reference Holwell, McDonald and Armitage2006; Klemd et al., Reference Klemd, Jungle, Oberthür, Herderich, Schouwstra and Roberts2016). Generally, contact style mineralization and massive sulfides in the basal Platreef are typically characterized by a significant lower tenor, a higher BMS abundance, lower Pt/Pd <1 and a higher Cu/Pd (Yudovskaya et al., Reference Yudovskaya, Kinnaird, Grobler, Costin, Abramova, Dunnett and Barnes2017).
The reef style mineralization occurs in uncontaminated pristine layers of feldspathic pyroxenite and harzburgite rimmed by persistent chromite seams at the top and the base (Yudovskaya et al., Reference Yudovskaya, Kinnaird, Grobler, Costin, Abramova, Dunnett and Barnes2017). BMS abundance (<5%), Pt/Pd ratios (>1), sulfide tenor (as high as 600 ppm PGE) and PGM assemblages closely resemble that of the Merensky reef mineralization: chromitites host predominant Pt–Pd sulfides grading into Pt–Fe alloy, whereas sperrylite and Pt–Pd bismuthotellurides become more abundant downwards.
The Platreef is not the only mineralized unit in the northern limb. To the south of the Ysterberg Planknek Fault, PGE mineralization occurs in harzburgite and pyroxenites of the Lower Zone rocks on Grasvally (Hulbert and von Gruenewaldt, Reference Hulbert and von Gruenewaldt1985) as well as on Moorddrift in more felsic gabbroic lithologies higher up in the stratigraphy (Maier and Barnes, Reference Maier and Barnes2010; Holwell et al., Reference Holwell, Jones, Smith and Boyce2013). To the north, in the Main Zone, on the Harriet Wish to Aurora sector, mineralization is hosted in felsic gabbroic and anorthosite lithologies (Harmer et al., Reference Harmer, Pillay and Davies2004; McDonald et al., Reference McDonald, Harmer, Holwell, Hughes and Boyce2017).
Waterberg Project setting
The Waterberg Project is located 85 km north of Mokopane, north of the Hout River Shear Zone, within the Southern Marginal Zone of the Limpopo Belt, which is located between the Zimbabwe craton in the north and the Kaapvaal craton in the south. The Southern Marginal Zone is believed to represent the metamorphosed and sheared section of the Kaapvaal craton thrusted upon the latter along the series of shear zones (van Reenen et al., Reference Van Reenen, Roering, Ashwal and de Wit1992). A stage of long-lasting regional tectonism which temporarily coincided with, or slightly postdated the emplacement of the Bushveld Complex, resulted in significant uplift and erosion of the exposed parts of the complexes. The Waterberg Group sediments with a thickness from 3 to 7 km were deposited upon the weathered top of the Bushveld sequence between 1.9–2.0 Ga (Huthmann et al., Reference Huthmann, Yudovskaya, Frei and Kinnaird2016).
The intrusion in the Waterberg Project area is a long lobe of Bushveld age (Huthmann et al., Reference Huthmann, Yudovskaya, Frei and Kinnaird2016; Reference Huthmann, Yudovskaya, Kinnaird, McCreesh and McDonald2018) that forms a >24 km northern extension of the Bushveld Complex (Fig. 1) (Kinnaird et al., Reference Kinnaird, Yudovskaya, McCreesh, Huthmann and Botha2017). This extension to the northern limb generally strikes NE–SW and dips at 34–38° NW in contrast to the north-south strike of the northern limb south of the Hout River Shear Zone, although certain blocks may deviate due to structural and tectonic controls (PTM, 2016). The intrusive succession in the Waterberg Project area has a thickness up to ~1200 m.
Waterberg Project geology
The stratigraphy and geology of the Waterberg Project is described in detail by Huthmann et al. (Reference Huthmann, Yudovskaya, Frei and Kinnaird2016, Reference Huthmann, Yudovskaya, Kinnaird, McCreesh and McDonald2018), McCreesh (Reference McCreesh2016) and Kinnaird et al. (Reference Kinnaird, Yudovskaya, McCreesh, Huthmann and Botha2017), therefore only a brief overview of the stratigraphy and geology is given below.
The footwall rocks are Archean granite gneisses (Fig. 2), although most borehole cores intercept a mixing zone, formed by an interaction between the Waterberg Bushveld magma and the Archean granite-gneisses. This interfingering of alternating felsic-rich layers and pyroxenite-rich layers is locally known as a granofels (Kinnaird et al., Reference Kinnaird, Yudovskaya, McCreesh, Huthmann and Botha2017). The floor contains numerous thin bands of fine-grained mafic-ultramafic rocks from pyroxenite to lherzolite, gabbronorite and norite that may represent the first intrusive sills intruded into the basement granite-gneisses. The intercumulus assemblage may contain abundant quartz and quartz-feldspathic granophyric intergrowths indicating contamination and partial melting of the floor.
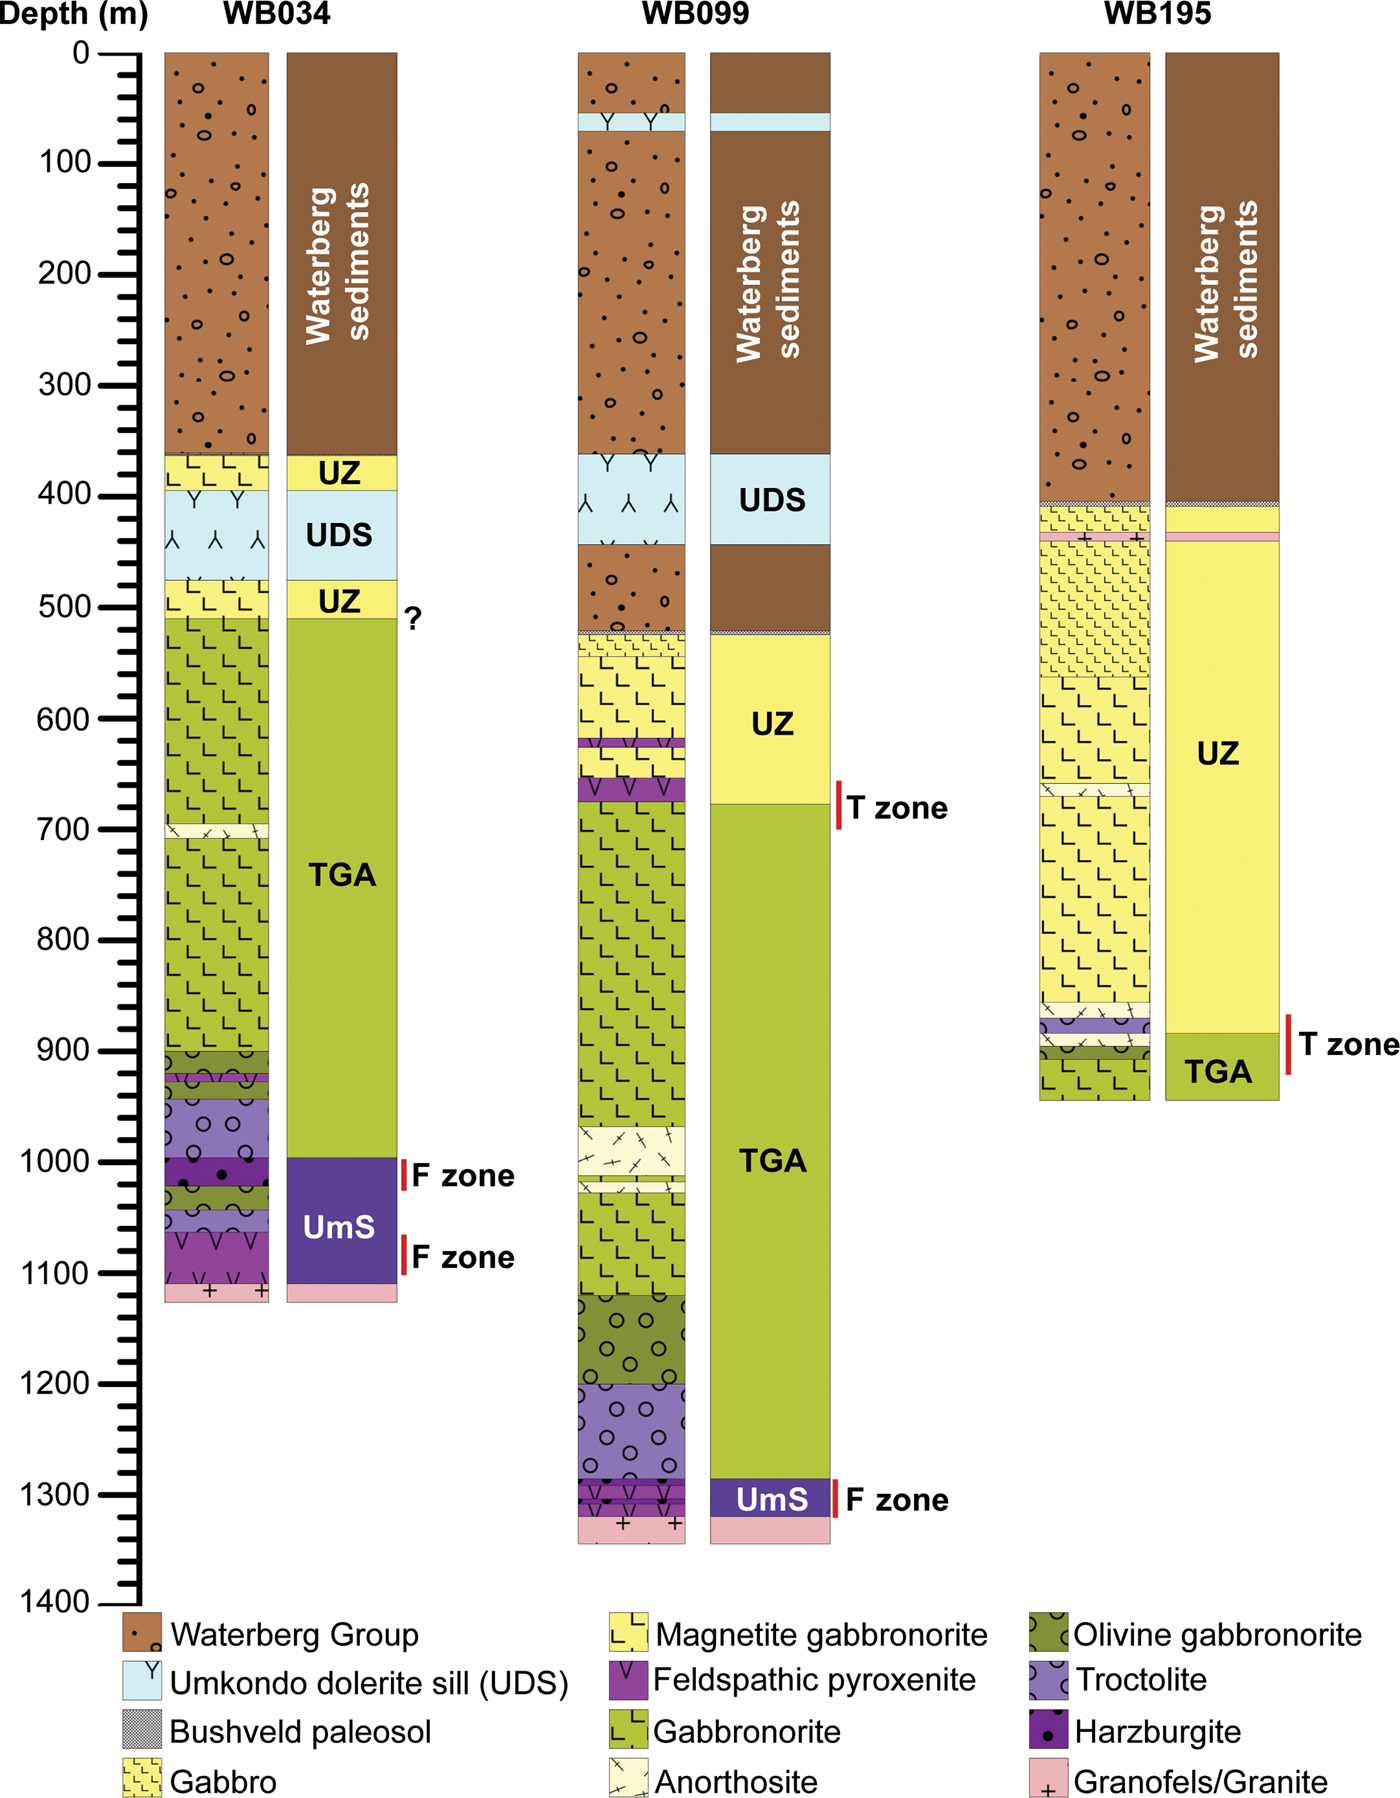
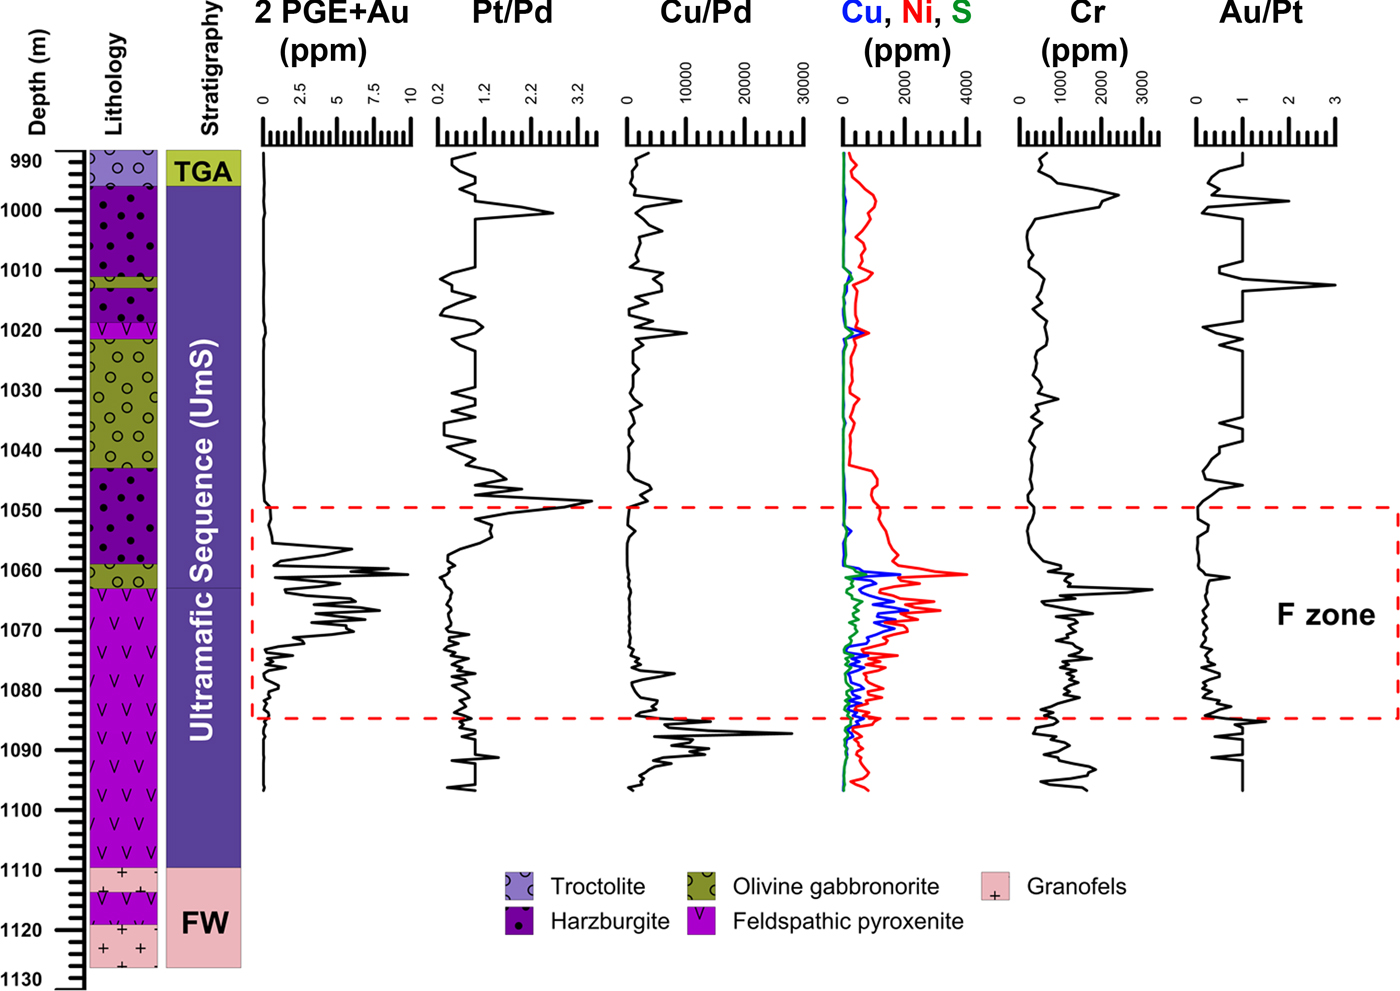
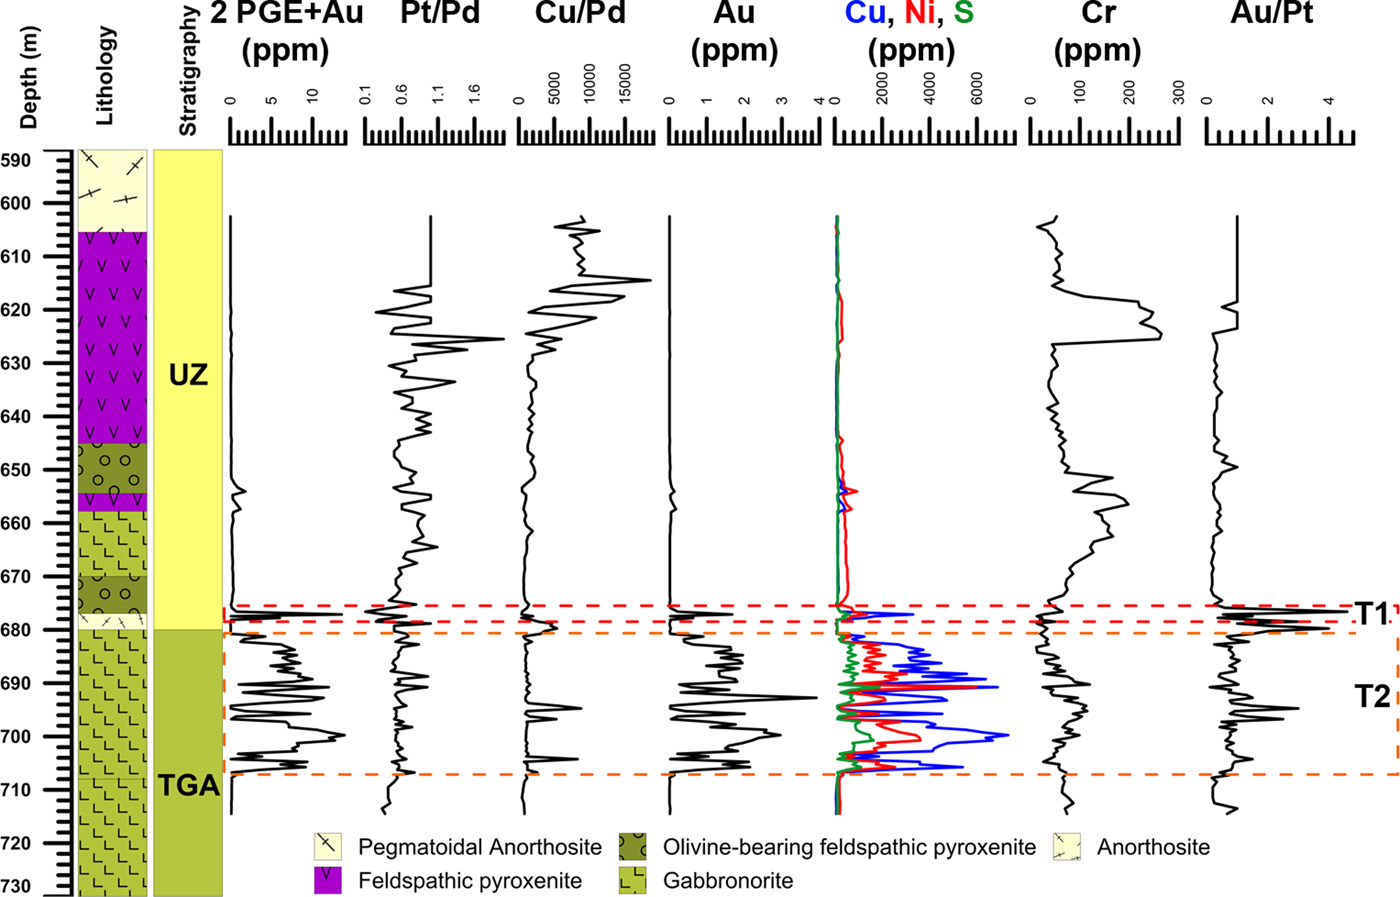
Fig. 2. Schematic stratigraphic columns for WB034, WB099 and WB195 boreholes in the Waterberg Project exploration area. The first column shows the lithology whereas the second column shows stratigraphic units: UmS – Ultramafic Sequence, TGA – Troctolite-Gabbronorite-Anorthosite sequence, UZ – Upper Zone and UDS – Umkondo Dolerite sill as well as F and T mineralized zones.
The basal Ultramafic Sequence (UmS) varies in thickness from 2.5 m to 100 m (McCreesh, Reference McCreesh2016). It comprises a lower medium-grained olivine-pyroxenite, orthopyroxenite and feldspathic pyroxenite and an upper feldspathic harzburgite to mela-troctolite that generally shows extensive serpentinization and chloritization (Fig. 3). A mineralized horizon, called the F zone occurs within the UmS.
Fig. 3. Typical lithologies of the mineralized zones from WB161 (F zone) and WB195 (T zone): (a) medium-grained feldspathic orthopyroxenite with disseminated sulfides within the F zone, (b) feldspathic harzburgite to mela-troctolite with disseminated sulfides within the F zone, (c) coarse-grained leucogabbro/anorthosite with interstitial chalcopyrite from the T2 subzone, (d) medium- to coarse-grained feldspathic harzburgite with disseminated sulfides from the T1 subzone. Photo of half-core cut samples 5 cm in diameter; a depth (m) is shown on the left.
The boundary between the UmS and the overlying troctolite-gabbronorite-anorthosite (TGA) sequence is gradational and is interpreted to be the result of magmatic erosion and digestion of the ultramafic unit by surges of later troctolitic melts (Kinnaird et al., Reference Kinnaird, Yudovskaya, McCreesh, Huthmann and Botha2017). The TGA sequence is characterized by a thick package of troctolite at the base, cyclically grading into medium- to coarse-grained olivine-gabbronorite and norite with minor feldspathic pyroxenite and anorthosite towards the top of the sequence. The TGA sequence ranges from 400 m to 850 m thick (McCreesh, Reference McCreesh2016; Kinnaird et al., Reference Kinnaird, Yudovskaya, McCreesh, Huthmann and Botha2017). A mineralized horizon, called the T zone occurs at the contact between the TGA sequence and the Upper Zone, in a package of varying sulfide-bearing compositionally-varied rock types that include gabbronorite, mafic and ultramafic pegmatoids, anorthosite, feldspathic pyroxenite, feldspathic harzburgite and troctolite.
The base of the Upper Zone is determined by an increase in magnetic susceptibility. The Upper Zone is dominantly magnetite gabbro and gabbronorite with minor anorthosite layers. The maximum thickness of the Upper Zone reaches 500 m but thins northwards and is completely eroded in the centre and northern parts although preserved in the far northern part of the project area. Where the Upper Zone is absent, either an attenuated TGA sequence or UmS are in contact with the overlying Waterberg sediments indicating that the variations of the Upper Zone thickness are due to erosion prior to deposition of the Waterberg Group sediments.
Towards the top of the Bushveld mafic succession, a highly altered zone, dominated by hematite and quartz is believed to be the weathered top of the intrusive rocks before the deposition of the overlying Waterberg Group sediments. The Setlaole and Makgabeng Formations of the Waterberg Group consist of arenites, sandstones and mudstones and pebbly conglomerates.
Dolerite sills or dykes with a maximum thickness of 200 m, but generally ~80 m thick intrude either the Waterberg sediments or the Bushveld mafic rocks although most typically they occur at the contact between the two. Radiometric age determination of a sill correlates with the 1.1 Ga Umkondo Igneous Province (Huthmann et al., Reference Huthmann, Yudovskaya, Frei and Kinnaird2016).
Radiometric U/Pb dating of zircons from the mafic-ultramafic rocks of the Waterberg intrusive rocks have yielded ages of 2059 ± 3 and 2053 ± 5 Ma (Huthmann et al., Reference Huthmann, Yudovskaya, Frei and Kinnaird2016), indicating that the magmatic succession at the Waterberg Project is coeval with the main Bushveld Complex (Zeh et al., Reference Zeh, Ovtcharova, Wilson and Schaltegger2015). The detrital zircons with the U-Pb isotope age of ~2.045 Ma in the basal layer of the Setlaole Formation suggest that the roof and upper parts of the Bushveld sequence were removed within a short time span before the Waterberg Group sedimentation (Huthmann et al., Reference Huthmann, Yudovskaya, Frei and Kinnaird2016).
Methodology
Five boreholes, WB099 and WB195 (representative for upper T zone) and WB034, WB091 and WB165 (representative for a thick well developed basal ultramafic F zone with minor alteration) were selected for study based on company assay data and our logs of 10 boreholes. Results from continuous half core sampling assay by Platinum Group Metals (PTM) Ltd through the high-grade zones, from 602 m to 715 m in WB099 (upper T zone) and from 930 m to 1097 m in WB034 (lower F zone) are shown in Figs 4 and 5. Quarter-core samples were collected from the mineralized intervals.
Fig. 4. Variations of 2PGE + Au, Cu, Ni, S and Cr abundances, Pt/Pd, Cu/Pd and Au/Pt through the F zone within the Ultramafic Sequence in the WB034 section. Data of 0.5 m sampling are shown by courtesy of Platinum Group Metals (PTM).
Fig. 5. Variations of 2PGE + Au, Au, Cu, Ni, S and Cr abundances, Pt/Pd, Cu/Pd and Au/Pt through the T zone in the WB099 section. Data of 0.5 m sampling are shown by courtesy of Platinum Group Metals (PTM).
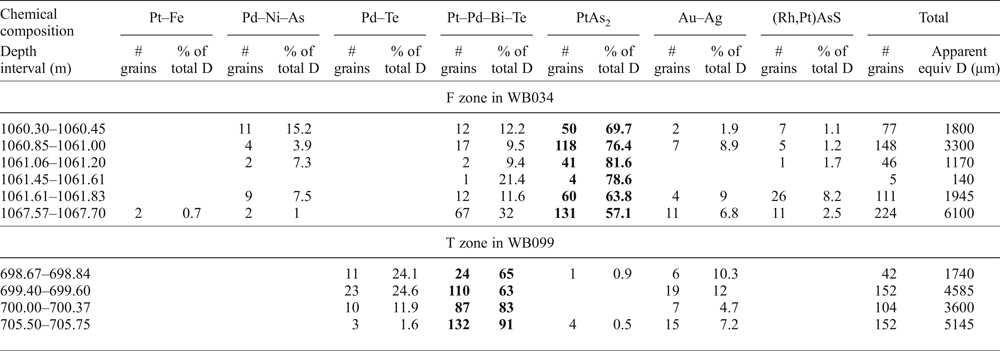
The PGM assemblage was studied in 50 polished thin sections of ore samples and 10 heavy mineral concentrates (Table 1). The PGM concentrates were panned in tribromomethane from a manually crushed fraction <0.5 mm of the quarter-core samples weighing from 18 to 50 g. The minerals were laid out using a needle and a tiny spatula in rows on carbon tape. Each row of PGM was mapped using FEI200 and FEI400 field-emission scanning electron microscopes (SEM) in back-scattered electron (BSE) mode at the Microscopy and Microanalysis Unit (MMU) at the University of the Witwatersrand. The chemical compositions of each PGM were identified semi-quantitatively using a LINK energy-dispersive spectrometer (EDS). The apparent size of each PGM grain was measured as a two-dimensional equivalent-circle diameter. The percentage of each PGM is reported as the sum of the all equivalent-circle diameters for that mineral divided by the sum of all the equivalent-circle diameters in the sample (Table 1). This method is cost effective and provides more representative data on the proportion of PGMs compared to the analysis from polished thin sections because of higher volumes of material involved and preservation of μm-sized particles, which are commonly lost during polishing of heavy separate blocks. The polished sections were used for observation and photography of textures and intergrowths at the MMU as well as at IGEM RAS using a SEM JSM 5610 equipped by EDS. Two polished thin sections from the WB195-898.7 m sample of the T zone contain abundant tiny μm-sized disseminated PGM observed under SEM. Their duplicates were analysed by ALS Minerals using automated Mineral Liberation Analysis (MLA). The sections were analysed using the Sparse Phase Liberation Dual Zoom technique that is based on analysis of BSE images to locate PGMs and identify their compositions using X-ray spectra. The SEM and MLA studies provided data on PGM associations (Table 2) as well as the PGM modal proportions and grain-size distributions, which are obtained by analysis of the heavy-mineral separates.
Table 1. Abundances and proportions (area%) of the PGM types in the heavy separates from the Waterberg deposit. The F zone is represented by mineralization in feldspathic harzburgite to melatroctolite in the borehole WB034. The T zone is represented by mineralization in gabbronorite and magnetite gabbro in the borehole WB099.
Predominant minerals are given in bold; D – apparent grain diameter in μm.
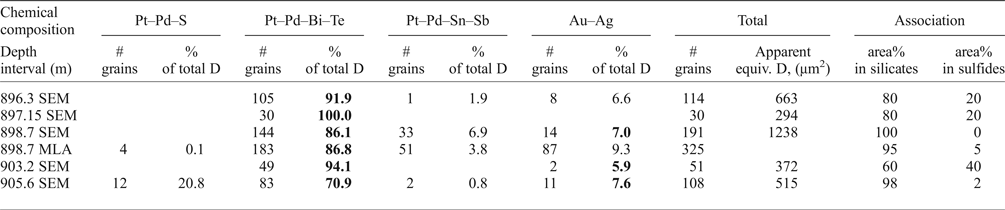
Table 2. Proportions (area%) of the PGM types in the polished sections of poikilitic leucogabbronorite of the T2 subzone in core WB195 according to the MLA results and grain counting under the scanning electron microscope (SEM).
Predominant minerals are given in bold; D – apparent grain diameter in μm.
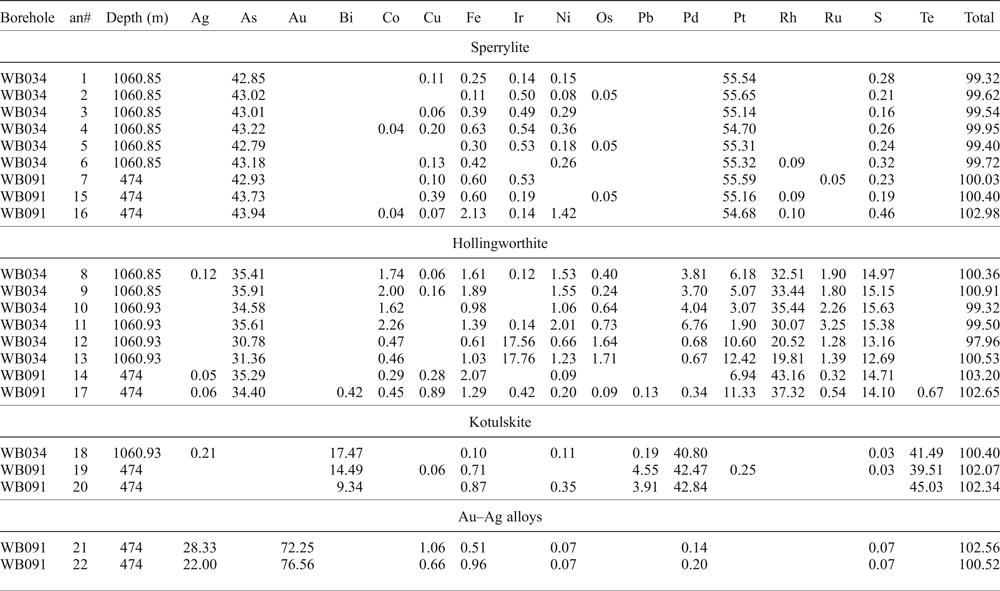
The quantitative electron-microprobe analysis of PGM (Tables 3 and 4) and sulfides (Supplementary Tables S1 and S2) was undertaken on grains in polished sections using a Cameca SX100 wave-length microanalyser at the University of Johannesburg. Analyses were performed at 20 kV acceleration voltage and 40 nA sample current with 2 µm beam diameter. The following X-ray lines, spectrometer crystals, counting time for peak/background and standards (in brackets) were used: SKα, PET, 11/11, (FeS); FeKα, LLIF, 8/8, (Fe); CoKα, LLIF, 8/8, (Co); NiKα, LLIF, 8/8, (Ni); CuKα, LLIF, 8/8, (Cu); AsLα, TAP, 41/41, (As); SeLα, TAP, 35/35, (Se); OsMα, TAP, 44/44, (Os); RuLα, PET, 23/23, (Ru); RhLα, LPET, 21/21, (Rh); PdLα, LPET, 19/19, (Pd); AgLα, LPET, 19/19, (Ag); AgLα, LPET, 27/27, (AgS); SnLα, PET, 13/13, (Sn); SbLα, PET, 13/13, (Sb); TeLα, LPET, 12/12, (Te); IrLα, LLIF, 18/18, (Ir); PtLα, LLIF, 20/20, (Pt); AuLα, LLIF, 23/23, (Au); HgLα, LLIF, (HgS); PbMα, PET, 56/56, (PbS), BiMα, PET, 53/53, (Bi). Off-line corrections for interference were applied to avoid peak interferences for all elements according to a procedure described by Fialin et al. (Reference Fialin, Outrequin and Staub1997). A secondary standard sample PGM1 of MINTEK (the Council for Mineral Technology, Johannesburg, South Africa) was analysed before analysis and reproducibility varied by <2%.
Table 3. Representative electron microprobe analyses of PGM (wt.%) in the F zone from the cores WB034 and WB091.
Detection limits (wt.%): Ag 0.05–0.15, As 0.02, Au 0.08–0.1, Bi 0.05–0.08, Co 0.03, Cu 0.03, Fe 0.03, Ir 0.05–0.08, Ni 0.03, Os 0.03, Pb 0.06–0.09, Pd 0.04–0.16, Pt 0.06–0.08, Rh 0.03–0.07, Ru 0.03–0.04, S 0.04, Te 0.04–0.05.
Blank – below detection limit.
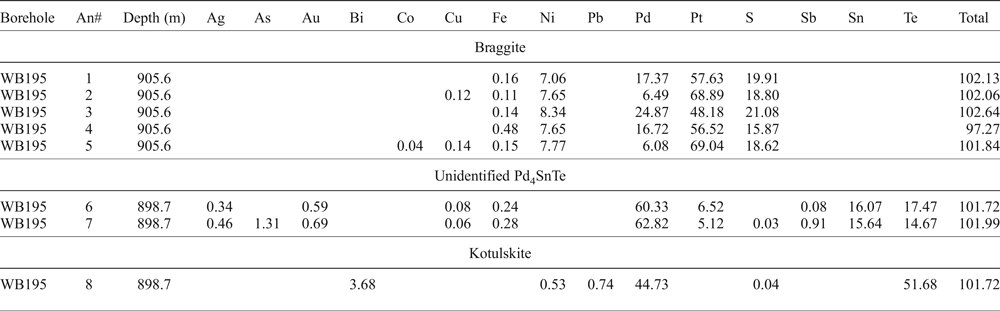
Table 4. Representative electron microprobe analyses of PGM (wt.%) in the T zone from the core WB195.
Detection limits (wt.%): Ag 0.05–0.15, As 0.02, Au 0.08–0.1, Bi 0.05–0.08, Co 0.03, Cu 0.03, Fe 0.03, Ni 0.03, Pb 0.06–0.09, Pd 0.04–0.16, Pt 0.06–0.08, S 0.04, Sb 0.05–0.06, Sn 0.04–0.05, Te 0.04–0.05.
Blank – below detection limit.
Results
Stratigraphy – boreholes WB034, WB099 and WB195
In WB034, the footwall rocks consist of quartz-rich granofels (Fig. 2). Overlying the basement rocks is the UmS which is ~110 m thick, composed of medium- to coarse-grained pegmatoidal feldspathic orthopyroxenite and harzburgite. The 557 m thick TGA sequence gradationally overlies the UmS and includes a ~81 m thick cross-cutting dolerite sill (Fig. 2). The TGA is dominated by medium- to coarse-grained ‘salt and pepper’ textured troctolite at the base, cyclically grading upwards into olivine-bearing gabbronorite, gabbro and norite with minor anorthosite, feldspathic pyroxenite layers and pegmatoidal lenses. A 0.7 m thick palaeosol and hematized and mylonitized siltstone lies between the TGA and the overlying Setlaole Formation quartz-rich clast-supported conglomerate with sandstone and mudstone upwards.
WB099 is 1344 m long (Fig. 2). A ~25 m thick interval of granofels at the base of the borehole includes abundant quartz-feldspathic veinlets. The UmS is 179 m thick and consists of medium- to coarse-grained feldspathic pyroxenite at the base overlain by coarse-grained harzburgite and mela-troctolite with xenoliths of feldspathic pyroxenite. The TGA sequence has a gradational contact with the underlying UmS. The TGA sequence from 1280 m to 602 m depth consists of basal barren troctolite grading into an olivine-bearing gabbronorite, gabbro and norite with minor anorthosite. The Upper Zone is covered by a 3.5 m thick hematite-rich clay palaeosol along the erosional boundary with the overlying Waterberg matrix-supported conglomerate with quartz pebbles, and succession of intercalated sandstone and mudstone upwards.
Borehole WB195 is 944 m long (Fig. 2). It has a 60 m thick TGA package of medium- to coarse-grained gabbronorite, leucogabbro and anorthosite with minor olivine-rich intervals. The 475 m thick overlying Upper Zone is marked by the appearance of titanomagnetite and consists of magnetite-bearing gabbronorite and leucogabbro with minor layers of anorthosite, olivine norite and leuco-troctolite. A 4.7 m thick palaeosol at the top of the Upper Zone developed along the erosional boundary with the overlying Waterberg sediments mainly composed of medium- to coarse-grained sandstone with a basal quartz pebble conglomerate.
Stratigraphy of the mineralized zones
The F zone mineralization is hosted in feldspathic pyroxenite that grades into feldspathic harzburgite upwards (Fig. 3a). Cumulus orthopyroxene (Mg# up to 84) and interstitial plagioclase [An# from 77 to 84 up to 88 according to Huthmann et al. (Reference Huthmann, Yudovskaya, Kinnaird, McCreesh and McDonald2018)] are accompanied by lesser clinopyroxene; minor olivine relics (<15%) and occasional chromite grains. Fragments of granoblastic orthopyroxenite with well-defined contacts within the overlying feldspathic harzburgite are interpreted as xenoliths trapped by a later magma influx.
Feldspathic harzburgite typically has a poikilitic texture with coarser-grained orthopyroxene oikocrysts compared to smaller pyroxene grains in the pyroxenite. Olivine (Mg# up to 83–84) occurs as chadacrysts in orthopyroxene as well as rounded to amoeboid grains surrounded by interstitial plagioclase. Chromite commonly occurs as rare small euhedral and corroded grains forming, <1 vol.% of the rock, although may be accumulated into disseminated concentration in zones up to 20 cm thick. An increasing proportion of clinopyroxene results in the appearance of lherzolite with typical oikocrystic clinopyroxene and peritectic orthopyroxene rims around olivine grains. Phlogopite forms interstitial poikilitic grains and overgrowths on olivine and chromite. Magnetite is a secondary mineral accompanying pervasive serpentinization and replacing chromite and sulfides.
The harzburgite has an irregular erosional or transitional contact with coarse-grained mela-troctolite, which is composed of cumulus olivine and plagioclase, and large oikocrysts of orthopyroxene (Fig. 3b). Olivine and pyroxenes in this unit are extremely altered to serpentine and chlorite with common relics of the pre-existing minerals remaining. Intervals with elongated harrisitic olivine up to 2–3 cm long with relics of corroded chromite (20–1000 µm) in interstitial plagioclase were observed. Above the transitional poikilitic mela-troctolite a typical ‘salt and pepper’ textured barren troctolite occurs, which eventually grades into an olivine-norite or gabbronorite, that represents the hanging wall to the F zone. Olivine has Mg# <77 in troctolite and between 64 and 73 in olivine norite. Its grains are significantly larger than those of plagioclase with the latter exhibiting both euhedral and interstitial habits.
The upper mineralized zone is subdivided into two subzones: the lower T2 and upper T1. It is separated from the underlying F mineralized zone by 100–600 m of a barren TGA. The T2 subzone (Fig. 3c) is hosted in medium- to coarse-grained gabbronorite, leucogabbronorite and leucogabbro to anorthosite. The T2 is characterized by distinctive elongated and rounded isometric milky-white plagioclase cores and crystals, which are saussuritized and filled with microinclusions of Fe-oxides. Whereas the T2 footwall gabbronorite is mostly composed of equigranular cumulus plagioclase, orthopyroxene (± inverted pigeonite) and clinopyroxene that is typical of the Main Zone in the rest of the Bushveld Complex, the T2 gabbro is characterized by a prevalence of cumulus plagioclase with both euhedral and oikocrystic subordinate pyroxenes. Euhedral (cumulus) titanomagnetite and ilmenite have the first appearance in the sequence, although, their sporadic coarse crystals occur in pegmatoidal lenses of the TGA rocks below. Another remarkable feature of the T2 subzone leucocratic rocks is the regular presence of quartz, amphiboles and chlorite as crusts around sulfide blebs.
The hanging wall to the T2 subzone is the Lower Pegmatoidal Anorthosite with spotted and mottled textures of clinopyroxene oikocrysts. The appearance of olivine marks the boundary with the heterogeneous upper T1 subzone composed of intercalated thin layers and veins of feldspathic harzburgite and pyroxenite, olivine-bearing pyroxenite, troctolite and olivine norite as well as their pegmatoidal varieties (Fig. 3d). The discrete layers in the T1 subzone have an irregular distribution and varying thickness so the package resembles a zone of mingling between different magmas or crystal mushes. The upper contact with the Upper Pegmatoidal Anorthosite is sharp although the latter may include thin vein-like injections of medium-grained olivine- and magnetite-bearing leucogabbro. The mottled and spotted texture of the Upper Pegmatoidal Anorthosite is composed of coarse plagioclase with large clinopyroxene and magnetite oikocrystic aggregates (2–3 cm). The magnetite content does not exceed 1–2 vol.%. The proportion of plagioclase in the Upper Pegmatoidal Anorthosite may decrease locally to 70 vol.% resulting in a pegmatoidal gabbro within the anorthositic unit.
PGE variations through the F and T zones
Variations in 2PGE + Au, base metal, S and Cr contents in core/sample WB034 (F zone) are shown in Fig. 4 based on exploration assay data of Platinum Group Metals (PTM). The F zone has low S contents, commonly >0.02 wt.% S and up to 0.76 wt.% S, which decreases gradually downwards to the base of the F zone. Above the F zone, still within the UmS, the S content decreases to below detection limits, although there are minor spikes up to 0.02 wt.% S within the thin harzburgite interlayers (Fig. 4). The S distribution correlates directly with Cu, Ni and PGE distribution at a 0.5 m sampling scale. Nickel has a perfect correlation with Cu and S in the high-grade zones, however, Ni shows elevated values in the intermediate ultramafic hanging wall, where Cu and S fall to background values. The mineralization is mostly confined to orthopyroxenite, feldspathic harzburgite and mela-troctolite although in some cases can be associated with olivine-gabbronorite close to the base of the succession as seen in Fig. 4. The mineralized zone is characterized by an elevated Cr content (>0.1 wt.% Cr) compared to the hanging wall where the Cr content drops to <0.02–0.03 wt.% Cr (Fig. 4). The elevated Cr is mostly related to harzburgite and pyroxenite interlayers, whereas Cr minima in the ore zone characterize subordinate veins of low-Cr troctolite. The footwall of the F zone is also characterized by elevated but variable Cr content that reflects changing ultramafic and gabbroic lithologies. 2PGE + Au in the >25 m thick F zone of WB034 has an average of 5 g/t with a maximum peak of 10 g/t 2PGE + Au two metres above the Cr peak (0.33 wt.% Cr, Fig. 4).
The Cu/Pd value is a good indicator of sulfide melt enrichment due to a contrast in Cu and Pd partitioning coefficients into sulfide melt during exchange with silicate melts (Naldrett et al., Reference Naldrett, Wilson, Kinnaird and Chunnett2009). The average Cu/Pd value in the Critical Zone of the Bushveld Complex is ~4000 and the lower Cu/Pd values indicate enhanced sulfide upgrading (Barnes and Maier, Reference Barnes and Maier2002; Naldrett et al., Reference Naldrett, Wilson, Kinnaird and Chunnett2009). The Cu/Pd values in the F zone is ~500 (Fig. 4), similar to the ranges of the Merensky Reef (Naldrett et al., Reference Naldrett, Wilson, Kinnaird and Chunnett2009) and the high-grade reefs at Turfspruit, Akanani and Sandsloot (Fig. 1) (Yudovskaya et al., Reference Yudovskaya, Kinnaird, Grobler, Costin, Abramova, Dunnett and Barnes2017). The F mineralization has a remarkably S-depleted character compared to the Merensky Reef and the Platreef, where S content ranges between 0.2–2.5 wt.% S at the same Cu/Pd values. Within the mineralized zone, the Pt/Pd ratio is fairly constant around 0.6 (Fig. 4) and the PGE comprise 65% Pd, 30% Pt with 5% Au (PTM, 2016).
Semi-massive sulfides occur in a few intersections at the base of the F zone, however, they have a much higher Cu/Pd and are likely to represent marginal style mineralization similar to the disseminated and massive PGE-Cu-Ni ore-bodies in the Platreef contaminated rocks.
The concentrations of metals and S, as well as metal ratios representative for the T zone, are plotted against stratigraphic height in core/sample WB099 (Fig. 5), where the T zone 2PGE + Au basket comprises 50% Pd, 30% Pt and 20% Au on average (PTM, 2016). The almost 30 m thick T2 subzone is hosted in gabbronorite to gabbro. The 2PGE + Au contents range between 2–7 g/t with a maximum of 12 g/t in this section. The base metals and S show good correlations with PGE + Au in the T2 subzone. The Au/Pt ratio of ~1 is remarkably high with the Au content reaching 4 g/t Au and the Au/Pt peaks up to 4. The Pt/Pd ratio in the T2 is fairly constant at 0.6 (Fig. 5). Copper prevails over Ni with Cu content ranging from 0.01 to 0.73 wt.% Cu. The S content is similar to that in the F zone with the highest values not exceeding 0.2 wt.% S.
The overlying T1 subzone is mostly barren in WB099, which is a rather typical pattern. There is a minor increase in 2PGE + Au at the depth interval of 650–660 m within a thin layer of olivine-bearing feldspathic pyroxenite. The slightly elevated base metal contents at the base of the T1 are accompanied by elevated PGE tenors (Fig. 5).
Generally, the Cu content exceeds 0.6 wt.% Cu within the T zone and is higher than the Ni content. The higher Cu content results in an elevated Cu/Ni ratio, however, the latter does not necessarily correlate with a higher abundance of chalcopyrite or other Cu minerals rather it reflects the lower silicate Ni in the heterogeneous T zone compared to the ultramafic F zone. The whole T zone is also dominated by Pd, has the unusually high Au content and has significantly lower Cr values below 0.03 wt.% (Fig. 5) compared with the F zone (Fig. 4) and with other mineralized reefs of the Bushveld Complex. This is consistent with the gabbroic composition of host lithologies, the absence of chromite or Cr-spinels, and abundant titanomagnetite and ilmenite in the T zone. The Cu/Pd ratio is <1000 in the high-grade intervals, although it drastically increases in the barren interlayers.
The Pegmatoidal Anorthosite carries sporadic elevated 2PGE + Au grades, although this unit is not always present.
Sulfide assemblages of the F zone
Base-metal sulfides (BMS) commonly account for ~1–5 vol.% in the upper part of the zone, although they may form semi-massive ores with up to 25 vol.% sulfides at the base. Disseminated and blebby magmatic sulfides (pyrrhotite/troilite ~45%, chalcopyrite ~30%, pentlandite ~20% on average) are accompanied by minor pyrite, covellite, valleriite, cobaltite–gersdorffite and bornite. Typically, primary interstitial sulfides occur as a discontinuous network of blebs with a pyrrhotite core, and pentlandite and chalcopyrite closer to the margins (Figs 6a–c). Similar textures in the Merensky Reef (Vermaak and Hendricks, Reference Vermaak and Hendricks1976) and in the Platreef (Hutchinson and Kinnaird, Reference Hutchinson and Kinnaird2005) have been interpreted to be a result of crystallization of immiscible sulfide melts.
Fig. 6. Photomicrographs of sulfides in the F zone under reflected light: (a) pyrrhotite (Po) and pentlandite (Pn) with minor chalcopyrite and magnetite (Mgt) rimming an altered olivine (Ol) grain (WB165–1118.1); (b) chalcopyrite and pyrrhotite (Ccp, Po) replaced by secondary magnetite (Mgt) with minor inclusions of moncheite (Mch), and pyrrhotite along the cleavage in silicates (WB034–1060.85); (c) euhedral crystals of sperrylite (Spe), surrounded by chalcopyrite and pyrrhotite (Ccp, Po), replaced by secondary magnetite (Mgt) in serpentinite (WB034-1060.85). (d) Ni-rich pentlandite (Pn) associated with covellite (Cv) and bornite (Bn) and rimmed by magnetite (Mgt) (WB165–1109.4); (e) chalcopyrite and pentlandite (Ccp, Pn) replaced by valleriite-like mineral 1 (Val 1) (WB034–1060.85); (f) Ni-rich chalcopyrite (Ccp) interstitial between chromite (Chr) grains, replaced by magnetite (Mgt). Valleriite-like mineral 2 (Val 2) is developed after phlogopite and serpentine in brecciated chromite (WB034–1060.85). (a–d and f) Plane polarized and (e) cross-polarized light.
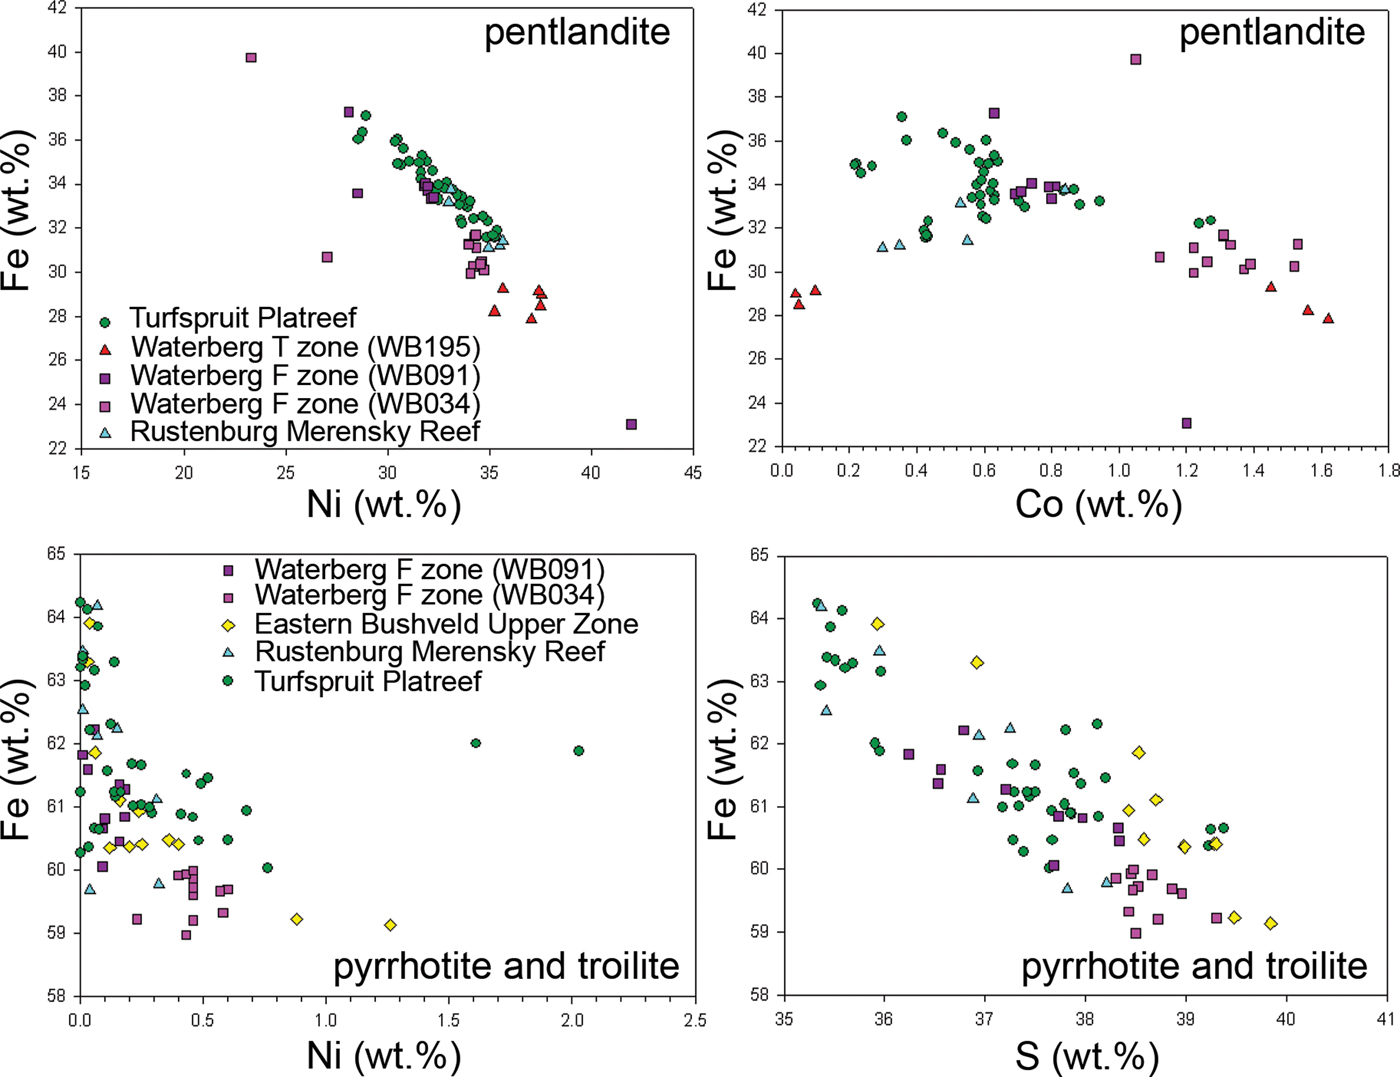
Troilite [FeS] and intermediate pyrrhotite [Fe1–xS] (Suppl. Table S1) are recognized among Fe monosulfides in the F zone according to the criteria of Becker et al. (Reference Becker, De Villiers and Bradshaw2010) for the Merensky Reef sulfides. These authors found that metal/S ratios and Ni content can be used to distinguish between troilite, intermediate and monoclinic pyrrhotite. Merensky Reef troilite is the most poor in Ni whereas coexisting intermediate pyrrhotite is slightly richer up to 0.3 wt.% Ni and monoclinic pyrrhotite contains 0.44–1.3 wt.% (Becker et al., Reference Becker, De Villiers and Bradshaw2010). On the Waterberg Project intermediate pyrrhotite contains up to 0.6 wt.% Ni and reveals rare flame-like pentlandite exsolutions. Troilite forms separate grains and lens-like exsolution lamellae in pyrrhotite. The Ni content in troilite is <0.09 wt.% (Suppl. Table S1). Troilite is not rare in the reefs of the Bushveld Complex and has been identified in a number of studies (Vermaak and Hendriks, Reference Vermaak and Hendricks1976; Schouwstra et al., Reference Schouwstra, Kinloch and Lee2000; Cabri et al., Reference Cabri, Rudashevsky and Rudashevsky2008; Yudovskaya et al., Reference Yudovskaya, Kinnaird, Grobler, Costin, Abramova, Dunnett and Barnes2017).
Several morphological varieties of pentlandite [(Fe,Ni)9S8] are found in polished sections. Coarse-grained fractured or brecciated pentlandite occurs mostly at the margins of interstitial sulfide blebs (Fig. 6a), and is also present within sulfide inclusions in coarse chromite (see fig. 12d in Kinnaird et al., Reference Kinnaird, Yudovskaya, McCreesh, Huthmann and Botha2017). It contains 31–34 wt.% Ni and elevated, but variable amounts of Co (0.7–1.5 wt.%). Pentlandite exsolutions in pyrrhotite have the same major-element chemistry as the coarse-grained variety, whereas pentlandite in irregular veinlets and disseminations among serpentinized silicates and secondary minerals is characterized by lower Ni (23–28 wt.% Ni) but the same elevated Co contents (Suppl. Table S1). Anhedral pentlandite associated with bornite (Fig. 6d) is Ni-rich with up to 42 wt.% Ni and is also Co-bearing (an. 2 in Suppl. Table S1). Both Ni-poor and Ni-rich pentlandite may be associated with native gold and PGM in intergrowths that imply their coeval deposition.
Chalcopyrite [CuFeS2] is the most abundant Cu mineral, while cubanite [CuFe2S3] was only observed in sulfide inclusions in chromite. Rare bornite [Cu5FeS4] (Suppl. Table S1) and covellite [CuS] are secondary after primary chalcopyrite and may form emulsion-like intergrowths (Fig. 6d).
Primary pentlandite-chalcopyrite interstitial intergrowths are replaced locally by aggregates of newly formed Cu–Ni sulfides (Fig. 7a). The compositions of some secondary lamellar grains with persistent 24–27 wt.% Ni and 7.7–9.8 wt.% Cu and a nonstoichiometric formula [Cu0.9–1.2Fe4–4.3Ni2.6–3.4S7.6–7.7] are close to that of sugakiite [CuFe6Ni2S8] or Cu-rich pentlandite [(Fe,Ni,Cu)9S8] (an. 12 and 36, Suppl. Table S1). The mineral is very similar to pentlandite under reflected light although its weak anisotropy indicates that it might be sugakiite. Exact identification would require X-ray study.
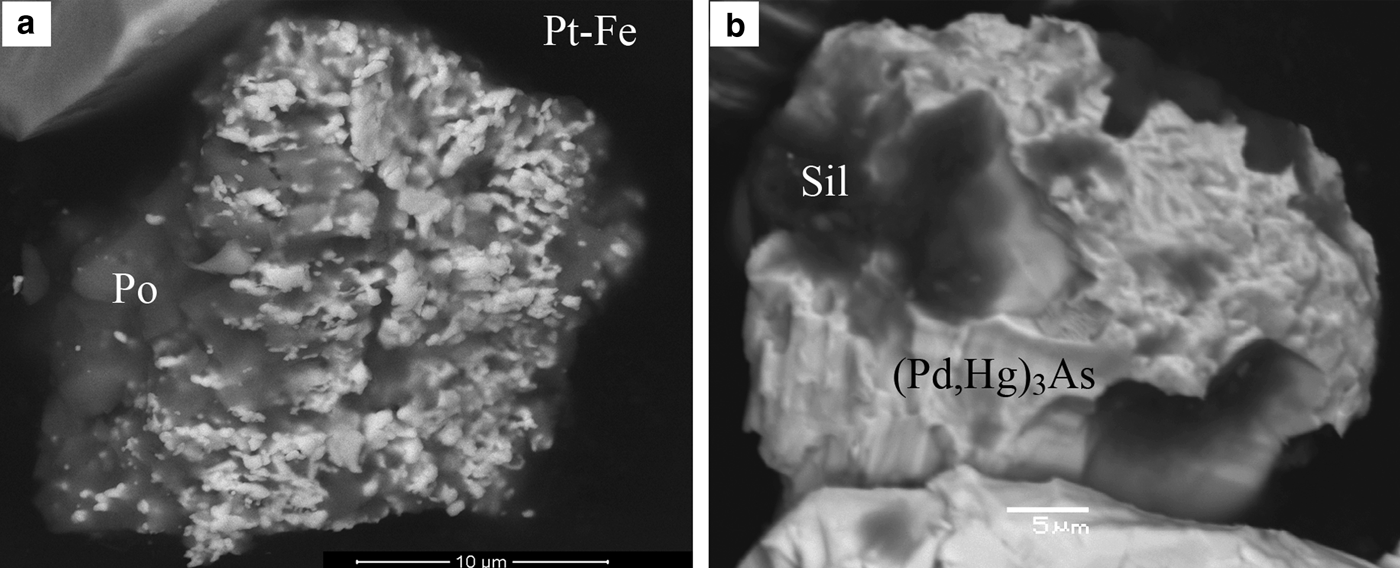
Fig.7. BSE images of PGM and sulfide assemblages of the F zone in polished sections in core WB034: (a) lenses and lamella of probable sugakiite (Sug, an 12 and 36, Suppl. Table S1) in association with chalcopyrite (Ccp, an. 13–14, Suppl. Table S1) and pyrrhotite (Po, an. 22–23, Suppl. Table S1) in sulfide bleb rimmed by magnetite (Mgt) (1060.85 m); (b) inclusion in chromite (Chr) composed of amphibole (Amp), chalcopyrite (Ccp), pentlandite (Pn) and pyrrhotite (Po). Tiny particles of a Pd–Bi–Te mineral are located along fractures in chromite (1060.85 m); (c) brecciated sperrylite (PtAs2, an. 1–6, Table 3) and hollingworthite (RhAsS, an. 8 and 9, Table 3) among pyrrhotite (Po) and chalcopyrite (Ccp) replaced by serpentine (Serp) (1060.85 m), (d) euhedral hollingworthite (RhAsS, an. 10–13 in Table 3) with Ir- and Pt-richer cores in association with kotulskite (PdTe), pyrrhotite (Po) and pentlandite (Pn) in feldspathic harzburgite (1060.93 m).
The intergrowths with this newly-formed sulfide (Fig. 7a) resemble the textures described by Kitakaze et al. (Reference Kitakaze, Sugaki, Itoh and Komatsu2011) for sulfides from the Horoman serpentinized peridotite, where sugakiite was first discovered. Tetragonal sugakiite from Horoman contains from 6 to 8 wt.% Cu (Kitakaze et al., Reference Kitakaze, Sugaki, Itoh and Komatsu2011) and has a composition close to that of cubic Cu-rich pentlandite. Copper-rich pentlandite of secondary origin was described from mooihoekite-talnakhite-cubanite ores of the Noril'sk deposit to contain 7.5 wt.% Cu and has a formula [(Fe5.52Ni2Cu0.88)8.4S8] (Genkin et al., Reference Genkin, Distler, Gladyshev, Filimonova, Evstigneeva, Kovalenker, Laputina, Smirnov and Grokhovskaya1981).
Two valleriite-like minerals (valleriite – [4(Fe,Cu)S·3(Mg,Al)(OH)2]) are present in the F zone. One valleriite-like mineral is a dirty yellow in colour under reflected light, is bireflectant and strongly anisotropic from cyan-blue to bright orange (Fig. 6e) with an obvious cleavage and lamellar brittle structure similar to a variety of valleriite after chalcopyrite, described by Ramdohr (Reference Ramdohr1969). Partial microprobe analysis of this valleriite-like mineral gives 1–3 wt.% Ni, 20–21 wt.% Fe, 19–22 wt. % Cu and 23–24 wt.% S with <70 wt.% total. Energy-dispersive and electron microscope analysis confirms an absence of other elements (such as Mg, Al and halogens) so the low totals are perhaps accounted for by the presence of hydroxyl layers in a layered lattice of the valleriite-type. Magnesium-free valleriite is known from massive talnakhite ores of the Noril'sk deposit, whereas different varieties are abundant in other ore types (Genkin et al., Reference Genkin, Distler, Gladyshev, Filimonova, Evstigneeva, Kovalenker, Laputina, Smirnov and Grokhovskaya1981). While the lamellar texture of the Waterberg valleriite-like mineral 1 is similar to that of valleriite formed after chalcopyrite (Ramdohr, Reference Ramdohr1969) (Fig. 6e), both optical features and composition do not exactly fit the known mineral. The second type of valleriite-like mineral is developed both after phlogopite and serpentine, where they are associated with chalcopyrite (Fig. 6f). This mineral is distinguished by a brown colour and strong anisotropy and contains sets of both chalcophile (Cu, Fe, S) and siderophile elements (Mg, Al, Si, K, Cl and Cr) according to the EDS analysis. Both valleriite-like minerals reveal features of secondary origin and are found in serpentinized harrisitic troctolite in associations with chlorite, phlogopite, sulfides and altered chromite.
Primary sulfides blebs in the F zone are also replaced or rimmed by secondary Fe oxides as well as by late-stage and secondary silicates such as tremolite, phlogopite, serpentine and chlorite (Fig. 6e, f). In addition, a minor carbonate replacement accompanies serpentinization. Secondary Ca-Mg-Fe carbonates, calcite and talc forms rare thin veinlets in the samples. However, disseminated chromite grains and their sporadic segregations may be selectively replaced by carbonates with a formation of stichtite [Mg6Cr2(OH)·16CO3·4H2O]. As a rule, chromite replaced by carbonate is associated with a much more common replacement by magnetite and hercynite, therefore, complete psuedomorphoses after chromite are eventually composed of Cr-Mg-carbonate, magnetite, hercynite and later hematite. Chromite replacement by secondary magnetite is related to both serpentinization and exchange with BMS. In the latter case, chromite can be completely replaced with the blurred shadow of Cr-magnetite relics among massive magnetite indicating the earlier presence of chromite (Fig. 6f). Massive crystals of magnetite in troctolite, as opposed to disseminated serpentinization-related magnetite, are most likely complete pseudomorphs after chromite.
The common and diverse replacement textures indicate a much higher initial abundance of chromite and sulfides in the F zone. It can be roughly estimated based on polished section observations that half of the magmatic S (with accompanying Cu and Ni) as well as more than half of the Cr were removed mostly due to major replacement by magnetite and subordinate carbonization. The secondary sulfides are formed mostly within the limits of the pre-existing sulfide aggregates.
Sulfide assemblages of the T zone
Sulfides account for ~1–2 vol.% in the T1 and ~5–7 vol.% up to 10 vol.% in the T2 subzone. Sulfides include chalcopyrite, pentlandite, pyrrhotite, arsenopyrite FeAsS, secondary millerite NiS, pyrite, galena, sphalerite and bornite (Fig. 8). Two main sulfide assemblages occur in the ores: a primary magmatic assemblage (~40% pyrrhotite, ~30% chalcopyrite, ~30% pentlandite) (Fig. 8b) and a secondary assemblage (~40% millerite, ~35% chalcopyrite, ~15% pyrite) (Fig. 8c). Minerals of the secondary assemblages are superimposed onto primary ones through the whole zone, although they are more widespread in more altered rocks and are predominant in gabbroic pegmatoids.
Fig. 8. Photomicrographs of sulfide assemblages of the T zone: (a) millerite-chalcopyrite-pyrrhotite (Mil, Ccp and Py) association after a primary sulfide bleb inside a larger titanomagnetite-ilmenite intergrowth (Ti-Mgt and Ilm) in gabbronorite (Cpx – clinopyroxene) (WB165-493 m); (b) relics of primary interstitial pentlandite-chalcopyrite (Pn, Ccp) assemblage rimmed by quartz (Q) crust among cumulus clinopyroxene (Cpx) (WB195-902.3 m); (c) millerite (Mil) within pyrite-chalcopyrite (Py, Ccp) symplectitic intergrowths (WB165-493 m); (d) millerite (Mil) and chalcopyrite (Ccp) intergrowth with pyrite-magnetite (Py, Mgt) symplectite within silicates (Sil) (WB165-493 m), (e) chalcopyrite (Ccp) and chalcopyrite-pyrite symplectites rimmed by quartz (Q) and pyrite (Py) (WB195-902.3 m), (f) pyrite (Py) rimmed by quartz-amphibole (Q, Amp) crust interstitial to cumulus clinopyroxene (Cpx) (WB195-902.7 m). (a–e) Reflected light, (f) cross-polarized transmitted light.
The textures of primary sulfides are blebby, interstitial and finely disseminated (Fig. 8), and can be ascribed to segregation and migration of sulfide immiscible melts. BMS tend to occur as irregular or rounded inclusions inside titanomagnetite (Fig. 8a). Pentlandite occurs as fractured granular crystals (an. 1–6, Suppl. Table S2) and as flame-like exsolution in pyrrhotite (see fig. 17a in Kinnaird et al., Reference Kinnaird, Yudovskaya, McCreesh, Huthmann and Botha2017). Flame-like pentlandite may locally be recrystallized into skeletal herring-bone aggregates arranged along boundaries of deformational twins in pyrrhotite. Chalcopyrite (an. 7–10, Suppl. Table S2) is found at the margins of aggregates with pentlandite and pyrrhotite and as separate vein-like segregations. Margins of sulfide aggregates are corroded and replaced by late magmatic amphiboles, chlorite and quartz. Pentlandite contains 35–37 wt.% Ni and up to 1.6 wt.% Co. Chalcopyrite is characterized by elevated Ni up to 0.5 wt.% Ni. Pyrrhotite is subordinate because of widespread conversion into pyrite.
Secondary sulfides replace primary magmatic sulfide blebs and interstitial aggregates and also form new crusts, pseudomorph after silicates and titanomagnetite, or veinlets and disseminations.
Pyrite is a major mineral in the T zone and is predominant in the Upper and Lower Pegmatoidal Anorthosites in particular. Pyrite forms (1) euhedral crystals with sporadic chalcopyrite and pyrrhotite inclusions; (2) symplectitic intergrowths with chalcopyrite and millerite (Fig. 8c); (3) replacement after titanomagnetite; (4) euhedral metacrysts in silicates rimmed by chlorite and quartz; (5) symplectitic intergrowths with magnetite (Fig. 8d) and gangue silicates; and (6) crusts and crusty veins around and across sulfide aggregates (Fig. 8e). Up to 1.4 wt.% Ni and 2.6 wt.% Co was measured in some pyrite grains (an. 11–14, Suppl. Table S2). A pyrite-millerite-chalcopyrite association is indicative of T mineralization. Millerite occurs together with pyrite and chalcopyrite in the absence of pentlandite with the latter probably being replaced by millerite and pyrite (Fig. 8a,c,d). Euhedral magmatic titanomagnetite is common and associated with ilmenite grains and lamellae (Fig. 8a), whereas secondary magnetite replacement is not as widespread as in the F zone. Titanomagnetite is typically replaced completely by silicates and pyrite, whereas remnants of ilmenite plates remain (Fig. 17b in Kinnaird et al., Reference Kinnaird, Yudovskaya, McCreesh, Huthmann and Botha2017).
Quartz and chlorite are associated closely with secondary sulfide assemblages (Fig. 8f). Quartz rims, commonly 50–200 µm thick are associated with amphibole, chlorite and subordinate carbonate and epidote. Sulfides rimmed by quartz in most cases, are represented by secondary assemblages with relics of primary pentlandite and pyrrhotite. The amount of quartz is highly variable (0.5–5 vol.%) through the T zone and does not correlate with the stratigraphic height, changes in rock types, sulfide content or PGE grades.
Platinum-group minerals (PGM)
Overall, ~1000 grains of PGM and native gold were recovered in the 10 heavy separates from the F zone in WB034 and from the T zone in WB099 (Table 1). Almost 500 additional grains were found in the five polished sections from the thick T zone in WB195 under SEM with manual grain counting and measurements (Table 2). Two duplicates of WB195-898.7 m sections were analysed repeatedly by MLA in the ALS commercial laboratory and gave 325 PGM particles (Table 2). The size of PGM grains in sections and separates varies from <1 to 100 µm with a few bigger grains up to 150 µm.
All the PGM were Pd, Pt and Rh minerals, with no Ru, Ir and Os minerals identified. The PGM were grouped into: (1) Pt–Pd bismuthotellurides; (2) sperrylite PtAs2; (3) Pt–Rh sulfarsenides; (4) minerals of the system Pd–Ni–As; (5) Pt–Fe alloys; (6) Pt–Pd (± Ni) sulfides; (7) minerals of the system Pt–Pd–Sn; and (8) Au–Ag alloys. The relative abundance of different PGM types indicates that there are two very different dominant assemblages for the F and T mineralized zones in the Waterberg Project (Tables 1 and 2).
F mineralized zone
Sperrylite PtAs2 is the dominant PGM that is indicative of the F zone and accounts for up to 82% of the PGM assemblage (Table 1) although its proportion decreases downwards into the orthopyroxenite of the mineralized zone. Sperrylite occurs as intergrowths with other PGM (Figs 9b,c and 7c), along the margins of BMS and as isolated crystals in secondary silicates where features indicate sulfide removal (Fig. 6c). It contains traces of Fe (up to 0.6 wt.%), Ir (up to 0.5 wt.%) and lesser amounts of Ni and Cu (Table 3).
Twenty-eight grains of minerals from the system Pd–Ni–As (majakite PdNiAs and menshikovite Pd3Ni2As3) and palladoarsenide Pd2As were encountered in the heavy separates (Figs 9a,d,f). They are mostly associated with other PGM and Au–Ag alloys, in which they form multiple inclusions up to 20 µm long (Fig. 9d). Rare stibiopalladinite (Pd5+x(Sb,As)2+x) forms complex intergrowths with menshikovite (Pd3Ni2As3) (Fig. 9f).
Fig. 9. BSE images of typical PGM grains in heavy-mineral separates of the F zone in core WB034: (a) majakite (PdNiAs) with prints of secondary silicates (1060.3 m); (b) euhedral sperrylite (PtAs2) with epitaxitic hollingworthite (RhAsS) on its faces (1061.6 m); (c) an intergrowth of maslovite (PtBiTe) and sperrylite (PtAs2) with epitaxitic hollingworthite (RhAsS) (1067 m); (d) native gold (Au9Ag1) with inclusions of majakite (PdNiAs) (1061.6 m); (e) Au–Ag alloy (Au5Ag5) with inclusions of cobaltite (Fe,Co,Ni)AsS (1018.00 m); and (f) inclusions of stibiopalladinite (Pd5+x(Sb)2+x) in menshikovite (Pd3Ni2As3) (1060.3 m).
Bismuthotellurides of Pt and Pd comprise michenerite PdBiTe (Fig. 8c), maslovite PtBiTe (Fig. 9b), moncheite PtTe2 and kotulskite Pd(Bi,Te) (Fig. 7d) and account for 9–34% of PGMs (Figs 9c and 7b,d). They are mostly intergrown with pentlandite and rarely with chalcopyrite and pyrrhotite, form exsolutions inside sulfides as well as thin rims around sulfide aggregates (Fig. 6b). Bismuthotellurides may contain up to 4.6 wt.% Pb (Table 3).
Hollingworthite (Rh,Pt,Ir,Os)AsS is also a mineral indicative of the F zone; ~50 grains from 1 to 25 µm in size were recovered in the heavy separates (Table 1), while more were detected under SEM as overgrowths on the faces of larger euhedral sperrylite crystals (Figs 9c and 7c), in association with Ni–Co sulfarsenides and Pd bismuthotellurides as well as zoned euhedral crystals intergrowing with other PGM (Fig. 7d). All compositions analysed belong to the Rh-dominant end-member of the hollingworthite–irarsite–platarsite series (Table 3).
Two grains, ~20 µm in diameter, composed of intimate fine intergrowths of a Pt–Fe alloy and pyrrhotite were identified in the heavy separates in WB034. The nonstoichiometric Pt–Fe alloys are represented by xenomorphic lumpy particles 0.1–2 µm in size (Fig. 10a); and are confined to or arranged along microfractures in pyrrhotite, in which the internal part is devoid of inclusions of Pt–Fe alloy Euhedral isoferroplatinum and cooperite as well as symplectic intergrowths of isoferroplatinum with BMS are typical for the reef-style mineralization in chromitite seams of the Bushveld Complex (for example, fig. 40-2 in Cabri, Reference Cabri and Cabri2002; Yudovskaya et al., Reference Yudovskaya, Kinnaird, Grobler, Costin, Abramova, Dunnett and Barnes2017). However, the morphology of alloys in the intergrowths observed here is different and may have resulted from later alteration of the primary magmatic assemblages.
Fig. 10. BSE images of rare PGM from the F zone in core WB034: (a) intergrowing Pt–Fe alloy and pyrrhotite on the surface of a pyrrhotite (Po) particle (1067 m); (b) surface of atheneite (Pd,Hg)3As with ingrowths and prints of fine-grained hydrous silicates (1019 m).
Rare electrum (Au–Ag alloy) accounts for ~5% of the noble metal minerals (PGE + Au). It is associated preferentially with secondary silicates, other PGM (Fig. 9d) and rarely with sulfides and sulfarsenides (Fig. 9e). Based on results of microprobe (Table 3) and EDS analysis, alloys range in composition from Au5Ag5 to Au75Ag25.
In addition, two grains of atheneite (Pd,Hg)3As (Fig. 10b) and a grain of sopcheite Ag4Pd3Te4 from 10 to 15 µm in size were found in the WB034 heavy separates.
Although we did not calculate weight percentage of PGE comprised in discrete PGM, a rough Pt/Pd value can be approximated from the PGM proportions in Table 1. The fairly constant whole-rock Pt/Pd of 0.6 within the F zone is obviously inconsistent with the Pt/Pd ratio of ~3 to 6 calculated from the PGM proportions. This imbalance can be explained by an assumed Pd storage in pentlandite that is a typomorphic feature of the Bushveld reef style and low sulfide types of mineralization (e.g. Klemd et al., Reference Klemd, Jungle, Oberthür, Herderich, Schouwstra and Roberts2016).
T mineralized zone
The T2 subzone of WB099 is dominated mainly by Pt–Pd bismuthotellurides with no significant change through the mineralized package (Fig. 11a,b, Table 4). The uppermost sample (698 m) of the T2 hosts merenskyite (PdTe2), kotulskite (PdTe), moncheite (PtTe2), froodite (PdBi2) and insizwaite (PtBi2) associated with Au–Ag alloy and minor sperrylite. From 699 m depth downwards, the mineralization is dominated by moncheite and Au–Ag alloys with inclusions of palarstannide. Merenskyite, moncheite and Au–Ag alloys are present 1 m below at a depth of 700 m. At the base of the T zone (705 m) mineralization consists of merenskyite and moncheite, with Au–Ag alloys with inclusions of kotulskite. Sperrylite, mertieite I and palarstannide are rare.
Fig. 11. BSE images of typical PGM assemblages in the heavy separates of the T zone in core WB099: (a) merenskyite (PdTe2) intergrown with chalcopyrite (Ccp) (700 m); (b) an euhedral layered crystal of moncheite (Pd,Pt)Te2 (705 m); (c) an intergrowth between layered moncheite (PtTe2) and native gold (Au9Ag1) with inclusions of kotulskite (PdTe) associated with chalcopyrite (Ccp) (705 m); (d) sperrylite (PtAs2) and native gold (Au9Ag1) associated with chalcopyrite (Ccp) (705 m); (e) palarstannide Pd5(Sn,As)2 on native gold (Au9Ag1) with secondary silicates (705 m); and (f) Au75Ag25 alloy associated with hydrous silicates (Sil) (705 m).
Pt–Pd bismuthotellurides account for up to 100 vol.% through the T zone (Tables 1 and 2). Moncheite forms generally the largest layered crystals (Fig. 11a,b) up to 100 µm in size. Bismuthotellurides form rims at the margins of the BMS blebs (Fig. 12a), intergrowths with chalcopyrite and with each other (Fig. 11c). All tellurides are associated commonly with hydrous silicates (up to 100% association, Table 2) where sulfides have been removed or replaced.
Fig. 12. BSE images of PGM assemblages of the T zone in polished sections in core WB195: (a) disseminated kotulskite (PdTe) (an. 8, Table 4) on margins of chalcopyrite (Ccp) bleb with minor pentlandite (Pn) and pyrite (Py). PGM dissemination extends into neighbouring amphibole-quartz (Amp, Q) intergrowth (898.7 m); (b) an unidentified mineral (Pd4SnTe) (an. 6–7, Table 4) within altered clinopyroxene (Cpx) and secondary silicates. An aureole of Pd–Sn dissemination in silicates surrounds the coarser particle (905.6 m); (c) heterogeneous grain of braggite (Pt,Pd,Ni)S (an. 1–5, Table 4) of variable composition in an intergrowth with pentlandite (Pn) within secondary amphibole (Amp). The grain is crosscut by micro-veinlets of Pt-rich braggite. Note a tail of disseminated braggite in secondary silicates (905.6 m); and (d) euhedral crystal of Au–Ag alloy (Au75Ag25) in a hole encrusted by euhedral pyrite (Py) (898.7 m).
Sperrylite is very rare in the T zone with <1 vol.% (Table 1), as compared to the <82 vol.% in the lower F zone. Five euhedral crystals between 5 and 15 µm in size were found in the WB099 separates, whereas no sperrylite was found in the WB195 samples. The sperrylite crystals are associated with Au–Ag alloy (Fig. 10d) and hydrous silicates.
The occurrence of Pt–Pd stannides, arsenides and antimonides is variable (Fig. 11d) accounting for 7 vol.% at a depth of 898.7 m of borehole WB195. Eighty seven grains, mostly <1–5 µm in size were counted in the samples (Table 2). The microprobe analysis of the only coarse grain of Pt–Pd stannide (Fig. 12b), yields a composition corresponding to a formula [Pd3.85–3.96Pt0.18–0.23Sn0.88–0.92Te0.77–0.93] (an. 6 and 7, Table 4) calculated on the basis of 6 atoms as the simplest one. The unidentified potentially new mineral contains some Au (0.59–0.69 wt.%) and Ag (0.34–0.46 wt.%) (Table 4). The composition is markedly different to the known composition of kojonenite [Pd7–xSnTe2] from the system Pd–Sn–Te (Stanley and Vymazalová, Reference Stanley and Vymazalová2015). However, it is close to the experimental ternary phase with compositions from Pd72Sn16Te12 to Pd73Sn14Te13 (Vymazalová and Drabek, Reference Vymazalová and Drábek2010), which has not been described in nature yet. The coarse grain of the mineral is located in altered clinopyroxene and is surrounded by a halo of disseminated particles 0.5–5 µm in size of similar composition (Fig. 11b).
Sulfides of Pt–Pd and Pt alloys were not found in the heavy mineral separates. However, several grains of braggite [(Pt,Pd,Ni)S] were identified in the 898.7 and 905.6 samples of WB195 (an. 1–5, Table 4). The occurrence at 898.7 m depth is composed of a single large xenomorphic grain 120 µm long within relic pentlandite and an accompanied trail of smaller particles jammed between secondary silicates and quartz (Fig. 12c). The braggite and adjacent pentlandite are corroded by secondary amphibole and quartz encrustations. The braggite grain contains tiny inclusions of quartz, amphibole, calcite and epidote as well as thin veinlets of a variety of braggite richer in Pt (an. 2 and 4, Table 4, Fig. 12c). The composition of braggite in the matrix corresponds to a formula [Pt0.38–0.54Pd0.27–0.36Ni0.2–0.24S0.92–1.03], whereas braggite veinlets richer in Pt have a composition of [Pt0.63Pd0.1Ni0.23S1.03] (Table 4). The braggite intergrowth suggests a secondary origin, although the chemistry of a precursor is difficult to constrain. It is known that cooperite is the highest-temperature Pt sulfide in the Bushveld reefs and it may be replaced or overgrown by later braggite at the late magmatic stage (Merkle and Verryn, Reference Merkle and Verryn2003; Yudovskaya et al., Reference Yudovskaya, Kinnaird, Grobler, Costin, Abramova, Dunnett and Barnes2017). The Ni-rich braggite and vysotskite (Pd,Ni)S are not widespread in the Bushveld reefs, rather they are known to be formed under postmagmatic hydrothermal conditions, for example, in massive sulfides ores of the Noril'sk deposit (Genkin et al., Reference Genkin, Distler, Gladyshev, Filimonova, Evstigneeva, Kovalenker, Laputina, Smirnov and Grokhovskaya1981).
Gold accounts for 25% of the budget of noble metal phases in the T zone (PTM, 2016), but the proportion of the detected Au–Ag alloys does not exceed ~10 vol.% in the samples studied (Tables 1 and 2). These minerals form euhedral, anhedral and platy crystals between 5 and 50 µm in size (Fig. 11). They commonly contain inclusions of PGM (Fig. 11c,e), and are intergrown with BMS, and with primary and secondary silicates. A euhedral crystal of electrum was found in small cavities at the centre of a pyrite rim (Fig. 12d) although no native gold was found enclosed in pyrite crystals.
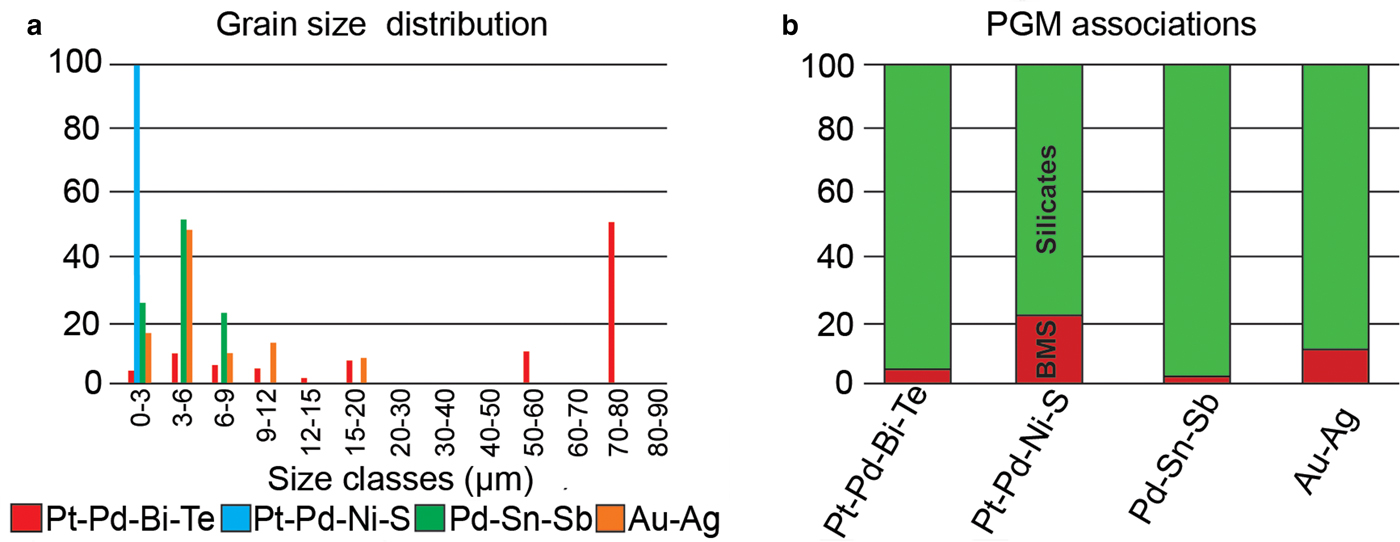
The MLA study reveals the bimodal distribution of PGM grain size in the T zone sample at an 898.7 m depth (Fig. 13a). Half of all PGM found are within a size range of 0–6 µm disseminated as micrograins among silicates (Fig. 13b), whereas the other half are 70–80 µm in size. Only ~5 area% of the PGM in the T zone sample is associated with sulfides according to the MLA results (Table 2), whereas the proportion in the other samples varies from 0 to 40 area% according to the SEM manual grain counting and observations. It was shown that statistical data on polished sections tend to be biased towards finding considerably more fine-grained minerals compared to coarse particles (Cabri et al., Reference Cabri, Rudashevsky and Rudashevsky2008; Cabri, Reference Cabri2015). Nevertheless, the consistency of the average PGM grain size varying from 5 to 10 µm (Table 2) through the 10 m thick T zone in the WB195 by the different methods supports the validity of the MLA results.
Fig. 13. PGM statistics from the MLA study of the T zone core sample WB195-898.7: (a) grain size distribution; and (b) PGM associations with silicates or base-metal sulfides (BMS).
Discussion
Comparison of the F and T zones with other Bushveld mineralized intervals
The discovery of PGE mineralization in the Waterberg Project area north of the Hout River Shear Zone has increased the interest in exploration of the upper stratigraphic zones of the northern limb. The initial studies of the intrusion in the Waterberg (McCreesh, Reference McCreesh2016; Kinnaird et al., Reference Kinnaird, Yudovskaya, McCreesh, Huthmann and Botha2017) have pointed to significant similarities to the rest of the Bushveld Complex. However, the differences in the stratigraphy and mineralization are notable to the western, eastern and northern limb south of the Hout River Shear Zone.
South of the Hout River Shear Zone, on the Harriet's Wish to Aurora section of the northern limb (Fig. 1) mineralization is hosted in more felsic lithologies. McDonald et al. (Reference McDonald, Harmer, Holwell, Hughes and Boyce2017), discussed the question as to whether the Aurora mineralization is a continuation of the contact style Platreef deposits (Maier et al., Reference Maier, de Klerk, Blaine, Manyeruke, Barnes, Stevens and Mavrogenes2008) or belongs to a Main Zone style of mineralization defined earlier by Maier and Barnes, (Reference Maier and Barnes2010). McDonald et al. (Reference McDonald, Harmer, Holwell, Hughes and Boyce2017) argued for a possible correlation between the upper mineralized zone of the intrusion at the Waterberg Project and the Aurora mineralization. This contribution constrains possible correlations with the northern limb and the rest of the Bushveld Complex on the basis of the first detailed data on the mineralization styles and the PGM assemblages of the F and T mineralization.
The PGE mineralization in the Bushveld Complex occurs in two distinct styles: (1) contact-style mineralization along the footwall of the northern limb (Kinnaird et al., Reference Kinnaird, Hutchison, Schurmann, Nex and de Lange2005; Maier et al., Reference Maier, de Klerk, Blaine, Manyeruke, Barnes, Stevens and Mavrogenes2008; McDonald and Holwell, Reference McDonald, Holwell, Ripley and Li2011); and (2) laterally highly continuous stratiform reefs including the Merensky reef, the UG2 chromitite layer and the PGE reefs at the top of the Platreef (Scoon and Teigler, Reference Scoon and Teigler1994; Barnes and Maier, Reference Barnes and Maier2002; Yudovskaya et al., Reference Yudovskaya, Kinnaird, Grobler, Costin, Abramova, Dunnett and Barnes2017). These two styles of mineralization occur exclusively in the Critical Zone and the correlative Platreef. A third style of PGE mineralization in the gabbroic sequence higher up in the stratigraphy has been described recently (Harmer et al., Reference Harmer, Pillay and Davies2004; Maier and Barnes, Reference Maier and Barnes2010; Holwell et al., Reference Holwell, Jones, Smith and Boyce2013; McDonald et al., Reference McDonald, Harmer, Holwell, Hughes and Boyce2017) while some sub-economic PGE grade mineralization was reported in the Upper Zone long ago (von Gruenewaldt, Reference von Gruenewaldt1976; Harney and von Gruenewaldt, Reference Harney and von Gruenewaldt1995).
The ultramafic lithologies and the F mineralized zone
The Pt/Pd and Pt/Au ratios in the F zone are much lower than those in the Merensky Reef or UG2 chromitites, whereas these values are within the range of those known for the Platreef contact-style (Kinloch, Reference Kinloch1982; McLaren and De Villiers, Reference McLaren and De Villiers1982). Both have 5% Au within the precious-metal budget. The Platreef is characterized by significant variations in PGE values and ratios along strike and down dip related to changes in host lithologies and mineralization styles (Kinnaird et al., Reference Kinnaird, Hutchison, Schurmann, Nex and de Lange2005; McDonald and Holwell, Reference McDonald, Holwell, Ripley and Li2011). The Platreef formed as coalescing multiple intrusions with the basal contaminated units hosting Pd-dominated contact-style mineralization (Kinnaird, Reference Kinnaird2005; McDonald et al., Reference McDonald, Holwell and Armitage2005; Maier et al., Reference Maier, de Klerk, Blaine, Manyeruke, Barnes, Stevens and Mavrogenes2008) and the top part carrying Pt-dominated reef-style mineralization (Yudovskaya et al., Reference Yudovskaya, Kinnaird, Grobler, Costin, Abramova, Dunnett and Barnes2017). Therefore, the PGE variations across the Platreef vertical section are related to the change of the mineralization styles whereas the PGE proportions along the strike of the stratiform PGE reef are uniform. The reef of the upper Platreef is characterized by perfect correlations between PGE and S, whereas a poor correlation exists between BMS and PGE in the contact style mineralization of the lower contaminated Platreef on Turfspruit and Macalacaskop (Hutchinson and Kinnaird, Reference Hutchinson and Kinnaird2005) (Fig. 1). The range of the Cu/Pd values (as low as 500) in the stratiform reefs of the Platreef (Yudovskaya et al., Reference Yudovskaya, Kinnaird, Grobler, Costin, Abramova, Dunnett and Barnes2017) is similar to that in the F zone (Fig. 4) and is within the range for the Merensky Reef (Naldrett et al., Reference Naldrett, Wilson, Kinnaird and Chunnett2009). The Cu/Pd values in the Platreef contact style mineralization are generally much higher and variable, reflecting heterogeneous PGE distribution in contaminated magmatic rocks, skarns and hornfels (McDonald and Holwell, Reference McDonald, Holwell, Ripley and Li2011).
The Pt-dominated reefs of the Platreef are interpreted to have formed as chonolith-like coalescing intrusions composed of feldspathic pyroxenite and harzburgite (Yudovskaya et al., Reference Yudovskaya, Kinnaird, Grobler, Costin, Abramova, Dunnett and Barnes2017) and the same mode of intrusion is suggested for the ultramafic bodies hosting the F zone (Kinnaird et al., Reference Kinnaird, Yudovskaya, McCreesh, Huthmann and Botha2017; and this study).
The primary magmatic BMS assemblages of the F zone (Fig. 6) are typical of PGE deposits in ultramafic sequences including the deposits of the Bushveld Complex (McDonald and Holwell, Reference McDonald, Holwell, Ripley and Li2011), and the secondary sulfide assemblage is also typical of serpentinized ultramafic economic or barren packages (Ramdohr, Reference Ramdohr1969; Kitakaze, Reference Kitakaze2008).
Disseminated chromite and chromitite seams within the Platreef package are generally enriched in PGE (Yudovskaya and Kinnaird, Reference Yudovskaya and Kinnaird2010). The chromite seams bound the stratiform sulfide reefs of the Bushveld Complex and are considered to mark the base of a cyclic unit and zone of mixing between a residual magma and a new melt influx (Naldrett et al., Reference Naldrett, Wilson, Kinnaird, Yudovskaya and Chunnett2012). The F zone hosts irregularly distributed disseminated chromite, whereas chromite seams 1–20 cm thick are rare. It may be related to the magmatic erosion at the top of the UmS by a surge of later troctolitic melt. Most of the TGA sequence is Cr-poor and chromite was not a liquidus phase in the TGA parental gabbroic melt. Disseminated chromite in troctolite is xenocrystic in nature suggesting it was derived from digested and consumed UmS harzburgite.
The Platreef contact style mineralization shows a great variability of PGM assemblages (Viljoen and Schürmann, Reference Viljoen, Schürmann, Wilson and Anhaeusser1998) and these changes seem to be related to the change in footwall lithologies (McDonald et al., Reference McDonald, Holwell and Armitage2005; Nichol and Kinnaird, Reference Nichol and Kinnaird2008; McDonald and Holwell, Reference McDonald, Holwell, Ripley and Li2011). On the farms Rietfontein, Macalacaskop and Turfspruit (Fig. 1), the PGMs in the contaminated sequence are represented by Pd-dominated bismuthotellurides and antimonides that comprise up to 90% of the PGM basket, with minor sperrylite and a single grain of PGE sulfide (vysotskite PdS) identified (Armitage et al., Reference Armitage, McDonald, Edwards and Manby2002; Hutchinson and Kinnaird, Reference Hutchinson and Kinnaird2005). From south to north the most abundant PGM identified are Pt–Pd bismuthotellurides at Tweefontein Hill, Pt–Pd sulfides, on Tweefontein North, Pt–Pd alloys and bismuthotellurides, on Sandsloot and Zwartfontein, Pt–Pd sulfides and tellurides on Overysel and Pt–Pd tellurides on Drenthe (Fig. 1) (Schneiderhöhn, Reference Schneiderhöhn and Wagner1929; Mostert, Reference Mostert1982; Kinloch, Reference Kinloch1982; Viljoen and Schürmann, Reference Viljoen, Schürmann, Wilson and Anhaeusser1998; Armitage et al., Reference Armitage, McDonald, Edwards and Manby2002; Holwell et al., Reference Holwell, McDonald and Armitage2006). In these earlier studies, the reef style and the contact mineralization were not distinguished and, therefore, the characteristics above reflect the bulk PGM proportions across the 100–600 m thick Platreef vertical section. The PGE-rich layers at the top of the Platreef are the thickest reefs in the Bushveld Complex (from 1 up to 90 m thick) but they are relatively thin compared to the much thicker zones of basal marginal mineralization. Therefore, the contribution of PGM types from the reefs was inevitably subordinate in the whole balance.
The recent work by Yudovskaya et al. (Reference Yudovskaya, Kinnaird, Grobler, Costin, Abramova, Dunnett and Barnes2017) at Turfspruit has indicated that the PGM assemblage in the uncontaminated stratiform reefs is dominated by Pt sulfides and Pt–Fe alloys and has been interpreted to be mineralogically similar to the Merensky Reef in the rest of the Bushveld Complex. The association of sperrylite-hollingworthite-cobaltite-gersdorffite can be considered as indicative (Good et al., Reference Good, Cabri and Ames2017) of both the Waterberg F zone and for the Akanani harzburgite reefs (Yudovskaya et al., Reference Yudovskaya, Kinnaird, Naldrett, Mokhov, McDonald and Reinke2011). In contrast, Pt sulfides and alloys indicative of the Merensky Reef style (Schouwstra et al., Reference Schouwstra, Kinloch and Lee2000; Prichard et al., Reference Prichard, Barnes, Maier and Fisher2004) are absent in the F zone supporting the idea that it is a zone (Kinnaird et al., Reference Kinnaird, Yudovskaya, McCreesh, Huthmann and Botha2017) not a stratiform reef.
The felsic-rich lithologies and the T mineralized zone
The recent discovery of PGE high-grade mineralization within the Upper-Main Zone of the northern limb warrants the question whether these mineralized zones are continuous south of the Hout River Shear Zone. The TGA sequence hosts the upper mineralization at its very top, at the contact with the Upper Zone rocks. The first appearance of cumulus titanomagnetite, which is an indicative mineral of the Upper Zone sequence (Ashwal et al., Reference Ashwal, Webb and Knoper2005) is confined to the T zone. On this basis, T mineralization may be assigned to the base of the Upper Zone rather than the top of the TGA. Below we compare characteristics of the T zone with other known mineralized intervals along the Main Zone strike in the northern limb, on the Moorddrift farm south of Mokopane and the Aurora project.
The highest PGE grades on Moorddrift farm are hosted by mottled anorthosite and gabbronorite which are associated with a pyroxenite layer (Holwell et al., Reference Holwell, Jones, Smith and Boyce2013). Maier and Barnes (Reference Maier and Barnes2010) suggested that the pyroxenite layer is correlative to the true ‘Pyroxenite Marker’ of the eastern and western limbs of the Bushveld Complex. Cawthorn (Reference Cawthorn2012) and Holwell et al. (Reference Holwell, Jones, Smith and Boyce2013), however, argued that a variable number of thin pyroxenite layers occur elsewhere in the upper Main Zone of the northern limb, and that the Moorddrift layer may represent one of these layers. The mineralized interval at Moorddrift (Fig 1) is also associated with brecciated lithologies, where PGE have been remobilized during hydrothermal activities (Holwell et al., Reference Holwell, Jones, Smith and Boyce2013). The sulfide assemblage comprises pyrrhotite-chalcopyrite-pentlandite with overprinting by pyrite. The δ34S isotope signature for the PGE mineralized interval at Moorddrift ranged between 2.8‰ to 11.5‰ δ34S indicating contamination by Transvaal sediments. The Moorddrift mineralization is Pt-dominated with the PGM assemblages dominated by Pt arsenides up to 70% (Maier and Barnes, Reference Maier and Barnes2010; Holwell et al., Reference Holwell, Jones, Smith and Boyce2013). Therefore, the position of the Moorddrift mineralization is not related to the Upper-Main Zone boundary as established for the Waterberg T zone. The elevated Pt/Pd, the Pt arsenide dominance, typically lower grades and the contaminated sulfur isotope δ34S values do not support a genetic link between the southern Moorddrift and far northern Waterberg mineralization.
South of the Hout River Shear Zone, mineralization is hosted by gabbronorite to leucogabbronorite, minor troctolite and magnetite gabbro at the Aurora project (Fig. 1) (Harmer et al., Reference Harmer, Pillay and Davies2004; Manyeruke, Reference Manyeruke2007; McDonald et al., Reference McDonald, Harmer, Holwell, Hughes and Boyce2017). These lithologies are similar to the T zone in our study area and are assigned to the Main Zone by McDonald et al. (Reference McDonald, Harmer, Holwell, Hughes and Boyce2017) although the presence of magnetite gabbro is not consistent with the Main Zone stratigraphy anywhere else. McDonald et al. (Reference McDonald, Harmer, Holwell, Hughes and Boyce2017) described inverted pigeonite in the mineralized intervals. In the Bushveld Complex the first pigeonite occurs at the top of the Critical Zone (de Klerk, Reference De Klerk1992) whereas the cyclic reappearance of pigeonite further upwards in the Bushveld stratigraphy serves as a basis for subdivision of the Main and Upper Zones into subzones (Nex et al., Reference Nex, Kinnaird, Ingle, van der Vyver and Cawthorn1998). The T zone gabbro may contain sporadic occurrences of inverted pigeonite although pigeonite becomes more widespread in the overlying Upper Zone magnetite-bearing gabbro. McDonald et al. (Reference McDonald, Harmer, Holwell, Hughes and Boyce2017) reported the presence of calc-silicates up to 2 m thick on the Aurora project whereas it is a rare feature in the Waterberg Project sections. These authors highlighted that the Aurora mineralization is Cr poor with the Cr abundance <300 ppm Cr that is typical for Bushveld gabbroic rocks and a negative correlation between Cr and PGE. Similar Cr values and Cr-PGE relationship are noted in the Waterberg T zone (Fig. 5). Both areas are characterized by Pd dominant over Pt with Pt/Pd of ~0.6 although Cu/Pd of ~4000 in Aurora is remarkably higher than that of the higher-grade Waterberg Project mineralization although both still within the range of mantle-derived magmatic sulfides (Naldrett et al., Reference Naldrett, Wilson, Kinnaird, Yudovskaya and Chunnett2012). The Aurora sulfides have magmatic sulfur isotope signatures as the δ34S values range from –0.8‰ to + 5.24‰ with an average of 0.99‰ (Holwell et al., Reference Holwell, Boyce and McDonald2007; Manyeruke, Reference Manyeruke2007; McDonald et al., Reference McDonald, Harmer, Holwell, Hughes and Boyce2017) that is similar to the Waterberg Project δ34S values of ~0‰ (McCreesh et al., Reference McCreesh, Kinnaird and Yudovskaya2015). The most common PGM on Aurora include Pd tellurides (merenskyite and kotulskite) and Au–Ag alloys with subordinate Pt tellurides and arsenides and rare Pt–Pd sulfides (McDonald et al., Reference McDonald, Harmer, Holwell, Hughes and Boyce2017). The Aurora sulfide assemblage of pyrrhotite-chalcopyrite-pentlandite contains only minor secondary pyrite. The PGM association with primary sulfides and silicates on Aurora strongly contrasts to the hydrothermal quartz-chlorite and pyrite-millerite secondary assemblages seen in the T zone. However, given the significant similarities between the two adjacent project areas and the likelihood of a link between their host sequences, we suggest that the Aurora mineralized units may represent a southern distal facies of the T zone.
The Main Zone magma of the Bushveld Complex was not traditionally considered as a fertile PGE source (Naldrett et al., Reference Naldrett, Wilson, Kinnaird, Yudovskaya and Chunnett2012) although some sporadic sulfides were identified in the upper part. Van der Merwe (Reference Van der Merwe1976) analysed gabbronorite samples from the upper Main Zone in the northern limb, and found anomalous enrichment in Cu and S values. Ashwal et al. (Reference Ashwal, Webb and Knoper2005) reported an increase in opaque minerals in the upper Main Zone, although they did not indicate their composition. Barnes et al. (Reference Barnes, Maier and Ashwal2004) noted relatively low Cu/Pd and elevated Cu content in the upper Main Zone from the Bellevue drill-core in the northern limb, similar to the ranges for the Waterberg Project and Aurora mineralization. Holwell et al. (Reference Holwell, Armitage and McDonald2005) have established that the Main Zone in the northern limb unconformably overlies the Platreef and have interpreted that the Main Zone may hold a metal budget of its own. McDonald et al. (Reference McDonald, Harmer, Holwell, Hughes and Boyce2017) speculated that this break between Platreef and Main Zone in the northern limb might explain the anomalous PGE budget of the Main Zone magma in the northern limb compared with the rest of the Bushveld Complex.
The upper Main Zone sequence of the western and eastern limbs also locally bears similar anomalies. Wilhelm et al. (Reference Wilhelm, Zhang, Chen, Elsenbroek, Lombard and de Bruin1997) reported on the basis of soil and sediment geochemical data that Ni, Cu, PGE and Au anomalies associated with the upper Main Zone could be traced for more than 100 km along strike in the western limb of the Bushveld Complex. Sharpe (Reference Sharpe1985) and Wilhelm et al. (Reference Wilhelm, Zhang, Chen, Elsenbroek, Lombard and de Bruin1997) have predicted the appearance of mineralization associated with the Pyroxenite Marker or at the boundary between the Main and Upper Zones. Consequently, several studies on the Pyroxenite Marker have revealed a moderate PGE enrichment in a few samples, although, most PGE abundances were below analytical detection limits (Maier et al., Reference Maier, Barnes and Van der Merwe2001; Maier and Barnes, Reference Maier and Barnes1999). Therefore, the known sulfide mineralization in the upper Main Zone and Upper Zone of the eastern and western limbs was confirmed to be uneconomic (Harney and Merkle, Reference Harney and Merkle1990; Harney and von Gruenewaldt, Reference Harney and von Gruenewaldt1995).
Relationships between PGM, BMS and rock-forming minerals
Typical magmatic PGE concentrations in the Bushveld stratiform deposits are associated with chromite (Lee, Reference Lee and Cawthorn1996), which is a major index mineral of the Lower and Critical Zone melts. In this sense, the Waterberg Project mineralization is atypical for the Bushveld Complex as one of the ore zones is hosted in gabbroic and leucogabbroic Cr-poor magnetite-bearing rocks. Thus, the Critical Zone melts parental to all known Bushveld PGE deposits were not involved in the formation of the T zone mineralization. The different composition of the parental melt does not markedly affect the patterns and compositions of BMS. The zonal sulfide blebs, pentlandite exsolution in pyrrhotite and troilite exsolution within hexagonal pyrrhotite are typical textures seen in the Merensky Reef, Platreef, Upper Zone and other magmatic sulfide deposits. The elevated Co content in the Waterberg pentlandite (Fig. 14) and pyrite is proably related due to later hydrothermal modification as was suggested for Co-enriched pentlandite in the contaminated Platreef (Hutchinson and Kinnaird, Reference Hutchinson and Kinnaird2005).
Fig. 14. Chemical compositions (wt.%) of pentlandite (Ni and Co vs. Fe) and pyrrhotite and troilite (Ni and S vs. Fe) from the F and T zones at the Waterberg Project. The data are compared with compositions from the Turfspruit reef in the Platreef (Yudovskaya et al., Reference Yudovskaya, Kinnaird, Grobler, Costin, Abramova, Dunnett and Barnes2017), the Upper Zone in the eastern Bushveld (von Gruenewaldt, Reference von Gruenewaldt1976) and the Merensky Reef at Rustenburg (Kawohl and Frimmel, Reference Kawohl and Frimmel2016).
Naldrett and Duke (Reference Naldrett and Duke1980) described that a typical magmatic sulfide liquid immiscible with the co-existing silicate liquid scavenges base metals and PGE. As a result of the crystallization of monosulfide solid solution, intermediate solid solution, and PGE-rich residue, PGM would commonly be found along the margins of BMS blebs (Naldrett et al., Reference Naldrett, Gasparrini, Barnes, Von Gruenewaldt and Sharpe1986). The magmatic PGM assemblages are composed of a variety of PGM, among which some of the PGM are considered to be indicative of contamination or hydrothermal remobilization. For example, the abundance of sperrylite is commonly interpreted as a consequence of assimilation of As-rich sediments as the As concentrations in ultramafic melts are commonly too low to achieve saturation in arsenides (Hutchinson and Kinnaird, Reference Hutchinson and Kinnaird2005; Holwell et al., Reference Holwell, McDonald and Armitage2006; Djon and Barnes, Reference Djon and Barnes2012; Holwell et al., Reference Holwell, Jones, Smith and Boyce2013). The Archean granite-gneisses footwall of sperrylite-rich F mineralization cannot be an effective source of As. We believe that the F zone index assemblage of sperrylite + hollingworthite is of high-temperature magmatic origin.
BMS have been altered along their margins and replaced by hydrous silicates (actinolite, phlogopite, tremolite, chlorite and epidote) and quartz. The PGMs occur as isolated crystals hosted by hydrous silicates due to removal and replacement of their host sulfides (Figs 8 and 12). Similar textures are seen in the Platreef (Holwell et al., Reference Holwell, McDonald and Armitage2006), the Merensky Reef and UG-2 chromitite layer (Li et al., Reference Li, Ripley, Merino and Maier2004). The latter authors suggested that the reaction involves the addition of Ca, Mg and Si from the assimilation of Malmani dolomites. Holwell et al. (Reference Holwell, McDonald and Armitage2006) argued that a hydrous fluid reacted with the BMS forming a sulfuric acid which dissolved the margins of BMS, allowing the hydrous silicates to grow into voids along the regressed margins.
The crystallization of primary PGM in both the F and T mineralized zones predates the alteration, as seen by the crosscutting relationships between the PGM and the secondary silicates (Figs 8 and 12). Primary magmatic Pt–Pd bismuthotellurides and native gold are generally easily remobilized by hydrothermal fluids and can precipitate in associated hydrous silicates (Watkinson and Ohnenstetter, Reference Watkinson and Ohnenstetter1992; Li et al., Reference Li, Ripley, Merino and Maier2004; Helmy et al., Reference Helmy, Ballhaus, Berndt, Bockrath and Wohlgemuth-Ueberwasser2007). The euhedral gold crystals in the cavities among pyrite crusts (Fig. 12d) confirm the hydrothermal transport of gold.
However, the primary PGE enrichment was the main controlling factor of mineralization. The pegmatoidal intervals in the middling of the T zone are PGE-poor despite the wide development of the hydrothermal assemblages with quartz-pyrite crusts and titanomagnetite replacement. Although the best PGE grade of the T zone is confined to the hydrothermally-reworked leucogabbro (as in the WB195 section), the variability of the T host lithologies from harzburgite to anorthosite suggests that T mineralization does not belong to the stratiform reef type. It is generally controlled by the zone of intermingling and interaction of two different gabbroic melts with subordinate influxes of Cr-poor ultramafics. The intensive hydrothermal reworking did not change PGE spatial distribution significantly although it did modify the PGM assemblage and may affect the primary geochemical characteristics such as Au/Pt value. Zotov et al. (Reference Zotov, Tagiro, Koroleva and Volchenkova2017) showed experimentally that Au/Pt in high-temperature chloride fluid in equilibrium with native Au, native Pt and Pt sulfide increases up to one order of magnitude with increasing temperature from 550 to 700°C. A decrease in pressure and an increase in sulfur fugacity towards pyrite predominance over pyrrhotite also lead to enrichment of the fluid in Au relative to Pt. Zotov et al. (Reference Zotov, Tagiro, Koroleva and Volchenkova2017) suggested that these coupled tendencies are related to a drop in the fluid density and exsolution of low density supercritical fluid at ~550°C that may be a cause of high Au/Pt ratios in pyrite-bearing mineralization.
Model of the Waterberg Bushveld succession
We suggest a provisional model for the origin of the PGE mineralization and the emplacement of the Waterberg Project succession on the basis of our data and as a development of earlier expressed ideas shared by Kinnaird et al. (Reference Kinnaird, Yudovskaya, McCreesh, Huthmann and Botha2017) and Huthmann et al. (Reference Huthmann, Yudovskaya, Kinnaird, McCreesh and McDonald2018). The tectonic setting of the Limpopo Belt basement and its pre-existing anisotropies (fractures, faults, shear zones, foliations and lithological contacts) have played an important role during the initial stages of magmatism in the Waterberg Project area. Structural controls of the emplacement of the earlier melts defined the observed sill-like and chonolith morphology of the separate units. The initial emplacement started at 2.05 Ma (Huthmann et al., Reference Huthmann, Yudovskaya, Frei and Kinnaird2016) with the intrusions of the Marginal orthopyroxenite, gabbronorite and norite sills into the Hout River gneiss basement (Fig. 15a). These intrusions melted Archean granite gneisses which mingled with a pyroxenitic magma to form granofels, which is similar to the granofels at the contact of the Platreef with gneissic floor (Holwell and McDonald, Reference Holwell and McDonald2006). Continuous influxes of ultramafic magma carved out channelized pathways under lateral dilation to form elongated chonolith-like bodies (Lister and Kerr, Reference Lister and Kerr1991) (Fig. 15a). The earlier ultramafic melts crystallized mineralized feldspathic orthopyroxenite at the base of the F zone (Fig. 15b). Then melts with olivine on the liquidus were transported along the heated channels to crystallize feldspathic harzburgite in the upper part of the F zone (Fig. 15b). High-Mg ultramafic magmas are generally enriched in PGE, which is related to a high degree of partial melting of the mantle source (Barnes et al., Reference Barnes, Cruden, Arndt and Saumur2016). With the continuous flow of ultramafic magma through these elongated channels, thermo-mechanical erosion formed embayments within the footwall of the Hout River Gneiss (Fig. 15b). At the same time, this hot ultramafic magma used points of weakness to widen the conduit for progressive transport and assimilation of the resident orthopyroxene cumulates that were redeposited as xenoliths within the overlying harzburgite (Holwell and McDonald, Reference Holwell and McDonald2006). The maximum heat and melt flow would be focused at the centre of the elongated bodies prohibiting crystallization and allowing for a long-lasting sulfide-silicate exchange to form high-tenor magmatic sulfides (Campbell et al., Reference Campbell, Naldrett and Barnes1983). In a recent study by Mungall and Brenan (Reference Mungall and Brenan2014), extremely high partition coefficients for PGE (from 105 to 106) between the sulfide and silicate melts were found. The calculations for the Merensky sulfides (Mungall and Brennan, Reference Mungall and Brenan2014) confirm a possibility of formation of the high-tenor PGE sulfides mineralization in situ in the resident chamber with no need for a pre-enrichment and an accumulation of a large pool of sulfide melt at depth in the staging chamber. The continuous propagation of magma through the chonoliths is an effective mechanism for the concentration of the sulfide-droplets during magma emplacement (Naldrett, Reference Naldrett2010) and formation of thicker and higher grade ore zones (up to 5 g/t PGE for 60 m interval), which then formed the Super F zone on the PTM exploration site. The PGE ores in the olivine-rich sequence are well known in the Bushveld Complex, although harzburgitic reefs (such as the Pseudo reef and the Turfspruit Main reef) are located commonly below the pyroxenite-hosted reef that assumes the earlier emplacement of the former. Otherwise, the observed stratigraphic order does not necessary reflect the order of emplacement as separate sills and chonoliths can transgress through layering and intrude out of sequence.
Fig. 15. The conceptual model for the emplacement of the entire Waterberg magmatic succession and formation of the mineralized zones: (a) the initial influxes interact with the Archaean basement to form marginal sills of fine-grained pyroxenite and gabbronorite and granofels under lateral dilation. (b) The channelized emplacement of ultramafic melts to form feldspathic orthopyroxenite (FP) and overlying harzburgite (FH). Thermal-mechanical erosion creates embayments in the footwall whereas mixing initiates exsolution of sulfide-droplets. (c) Emplacement of the troctolitic sheet-like bodies extending laterally due to roof uplift and floor depression. (d) Magma mixing between resident ultramafics and gabbroic melts at the base of the TGA sequence. (e) Prolonged fractionation of the TGA melt column resulting in a build-up of S, Cu, Ni and PGE + Au in the residual melt. The influx of fertile magma of the Upper Zone affinity, magma mixing and formation of the T zone. (f) The area experiences uplift and erosion. Palaeosol forms after weathered Bushveld rocks. (g) Deposition of the Waterberg Group sediments. (h) Intrusions of the Umkondo dolerite sills.
Following the ultramafic channelized melt flow, continuous pulses of troctolitic magma utilized pre-existing points of weakness or anisotropies to form more laterally extensive sheet-like bodies (Fig. 15c). The processes of roof uplift and floor depression (Cruden, Reference Cruden1998) may have played a crucial role for creating space for the voluminous pool of stagnant magma to fractionate. The initial influxes of the troctolitic magma with a high proportion of phenocrysts at some point mixed with the earlier ultramafic melts either in the sub-chamber or in the feeder zone (Saper and Liang, Reference Saper and Liang2014), to form mela-troctolite grading into troctolite, olivine gabbronorite, gabbronorite and anorthosite (Fig. 15d). The several regular occurrences of anorthosite at the top of gabbroic cycles within the TGA sequence testifies to multiple surges of magma that were similar compositionally to the Main Zone magmas elsewhere. The prolonged fractionation of the TGA sequence may be one of the key factors in producing the T zone at the top (Fig. 15e) (Keays and Tegner, Reference Keays and Tegner2016). During the fractionation of the TGA magma, the incompatible elements such as S, Cu, Pt, Pd and Au would have become enriched in the residual melt after deposition of the barren olivine-plagioclase cumulate (Andersen et al., Reference Andersen, Rasmussen, Nielsen and Ronsbo1998; Nielsen et al., Reference Nielsen, Andersen and Brooks2005; Keays and Tegner, Reference Keays and Tegner2016). The T zone also marks the first appearance of cumulus magnetite that may indicate a decrease in temperature and ![]() $f_{{\rm O}_{\rm 2}}$ of the magma (Keays and Tegner, Reference Keays and Tegner2016) or may be an indication of a first influx of the Upper Zone melts into the resident chamber. Mixing between the TGA leucogabbroic residue and the Upper Zone melt with magnetite on liquidus, triggered sulfide saturation and exsolution of T2 sulfides. The heterogeneity of the overlying T1 package suggests that the entire T zone was formed as a result of consecutive mixing events. The appearance of T1 harzburgite above anorthosite testifies to an influx of an olivine-saturated magma, which transgress through the underlying T2 and initiated the crystallization of pegmatoidal pods and lenses due to undercooling during protracted crystallization. The T1 and T2 mineralization subzones have the same metal basket but very different lithologies. The PGE grade in the T1, however, is not persistent and, in some cases, the T1 is completely barren as seen in WB099 (Fig. 5). The T1 may have thermally eroded the T2 and the overlying anorthositic interlayer.
$f_{{\rm O}_{\rm 2}}$ of the magma (Keays and Tegner, Reference Keays and Tegner2016) or may be an indication of a first influx of the Upper Zone melts into the resident chamber. Mixing between the TGA leucogabbroic residue and the Upper Zone melt with magnetite on liquidus, triggered sulfide saturation and exsolution of T2 sulfides. The heterogeneity of the overlying T1 package suggests that the entire T zone was formed as a result of consecutive mixing events. The appearance of T1 harzburgite above anorthosite testifies to an influx of an olivine-saturated magma, which transgress through the underlying T2 and initiated the crystallization of pegmatoidal pods and lenses due to undercooling during protracted crystallization. The T1 and T2 mineralization subzones have the same metal basket but very different lithologies. The PGE grade in the T1, however, is not persistent and, in some cases, the T1 is completely barren as seen in WB099 (Fig. 5). The T1 may have thermally eroded the T2 and the overlying anorthositic interlayer.
The fractionation of the voluminous Upper Zone gabbroic magma may have been disturbed by new influxes of less evolved melts forming at least a 500 m thick Upper Zone of the Waterberg Bushveld succession, which may have included now eroded apatite-bearing rocks seen in the rest of the Bushveld Complex (Fig. 15f). Soon after the uplift and partial erosion of the Waterberg Bushveld succession and its possible volcanic roof, the Waterberg Group sediments were deposited upon the weathered surface (Fig. 15g).
The T zone package of the intercalated diverse lithologies served as favourable pathways for fluid migration at the late and post-magmatic stages. The late magmatic alteration involved the replacement of sulfides along the margins with secondary amphiboles and silicates, whereas hydrothermal activity resulted in the deposition of quartz, magnetite replacement, crystallization of pyrite-millerite assemblages and remobilization of PGM and BMS out of sulfide blebs into the silicate matrix. The F zone magmatic mineralization underwent a superimposed alteration during the late magmatic stage and later serpentinization. The late magmatic processes resulted in the replacement of magmatic sulfides by secondary silicates, whereas serpentinization induced a significant BMS and chromite dissolution with spatially restricted PGE remobilization.
Conclusion
The two economic PGE zones in the Waterberg Project succession do not have comparable analogues in the rest of the Bushveld Complex. The detailed PGM and sulfide mineralogy corroborates the earlier ideas (Huthmann et al., Reference Huthmann, Yudovskaya, Frei and Kinnaird2016; Kinnaird et al., Reference Kinnaird, Yudovskaya, McCreesh, Huthmann and Botha2017) of an independent development of the Waterberg Project area as a separate magmatic basin within the Southern Marginal Zone of the Limpopo belt. Our data on PGM and PGE deportment allow the following conclusions regarding the formation of the mineralized zones: (1) Sperrylite and Pt–Pd bismuthotellurides are the dominant PGM in the F zone in the ultramafic rocks, where sulfarsenides of PGE, Fe and Co are index minerals of this type of mineralization. The widespread serpentinization resulted in a significant sulfide and chromite removal and determined the composition of the secondary sulfide assemblages typical of altered ultramafic rocks. The F zone mineralization is confined to the basal layers of the succession and is comparable to mineralization in the Platreef ultramafic sills and chonoliths, assuming similar mechanism of sulfide enrichment in the channelized magmatic flows. (2) The T zone is dominated by Pt–Pd bismuthotellurides, PGE-stannides and electrum. The stratigraphic position at the level of the first cumulus magnetite appearance suggests that Upper Zone melts were involved in the formation of the T ore-bearing package. The higher proportions of ultramafic and troctolitic lithologies distinguish the T zone from the mineralized zone on Aurora, perhaps the latter is hosted in the distal facies of the same succession. Widespread secondary silicates (tremolite, actinolite, epidote, serpentine and chlorite), crusty quartz, carbonates and associated pyrite-millerite assemblages indicate hydrothermal modification of ores. The hydrothermal reworking was responsible for the observed bimodal PGM grain-size distribution where the rare coarse grains are accompanied by haloes and trails of the numerous disseminated PGM in silicates.
Acknowledgements
The authors are grateful to Platinum Group Metals (PTM) and particularly R. Michael Jones, Thys Botha and geologists at the project site: Aleck Mkhabela, Sibusiso Sithole and Given Matjomane for support in all aspect of this work and funding for this project from Platinum Group Metals (PTM). Thelma Chirwa from the ALS Mineralogy (Pty) Ltd is thanked for the MLA (Mineral Liberation Analyser) investigation. Alexander Ziegler from the MMU (Microscopy and Microanalysis Unit) at the University of the Witwatersrand and Andrey Mokhov from the Belov Laboratory at IGEM RAS (Institute of Ore Geology, Geochemistry, Mineralogy and Petrography, Moscow) assisted with the SEM studies. The study was supported by the Russian Foundation for Basic Research (grant 17-05-00456) and CIMERA (Centre of Excellence for Integrated Mineral and Energy Resource Analysis). We thank Tony Naldrett, Paul Nex, Florian Huthmann and Iain McDonald for fruitful discussions. The manuscript was improved by the revision and comments of Louis Cabri and Thomas Oberthür.
Supplementary material
To view supplementary material for this article, please visit https://doi.org/10.1180/mgm.2018.83.