Introduction
Parisite-(La) is the La-dominant analogue of parisite-(Ce). Minerals with a chemical composition consistent with that of parisite-(La) were reported in several studies from different localities: Třebíč durbachite massif, SW Moravia, Czech Republic (Sulovský, Reference Sulovský2001); at a metabauxite/marble interface in the eastern part of Samos island, Greece (Theye et al., Reference Theye, Ockenga and Bertoldi2003); alkaline rocks in Romania (Hirtopanu, Reference Hirtopanu2006, Hirtopanu et al., Reference Hirtopanu, Fairhurst and Jakab2015); Cerro Boggiani massif, Alto Paraguay Province, Paraguay (Enrich et al., Reference Enrich, Gomes and Ruberti2010); and Bear Lodge carbonatite, Wyoming, USA (Moore et al., Reference Moore, Chakhmouradian, Mariano and Sidhu2015). Parisite-(Nd) is also reported in literature as a mineral without IMA approval (Jambor et al., Reference Jambor, Burke, Ercit and Grice1988).
Parisite-(La) has been approved as a new mineral species by the Commission of New Minerals, Nomenclature and Classification (CNMNC) of the International Mineralogical Association (IMA 2016-031). The type specimen of parisite-(La) is deposited in the mineralogical collection of the Museu de Geociências, Instituto de Geociências, Universidade de São Paulo, Rua do Lago, 562, 05508-080 – São Paulo, SP, Brazil, with the registration number DR1032 (a part of the holotype), and at the University of Arizona Mineral Museum (RRUFF Project deposition # R130687).
Occurrence
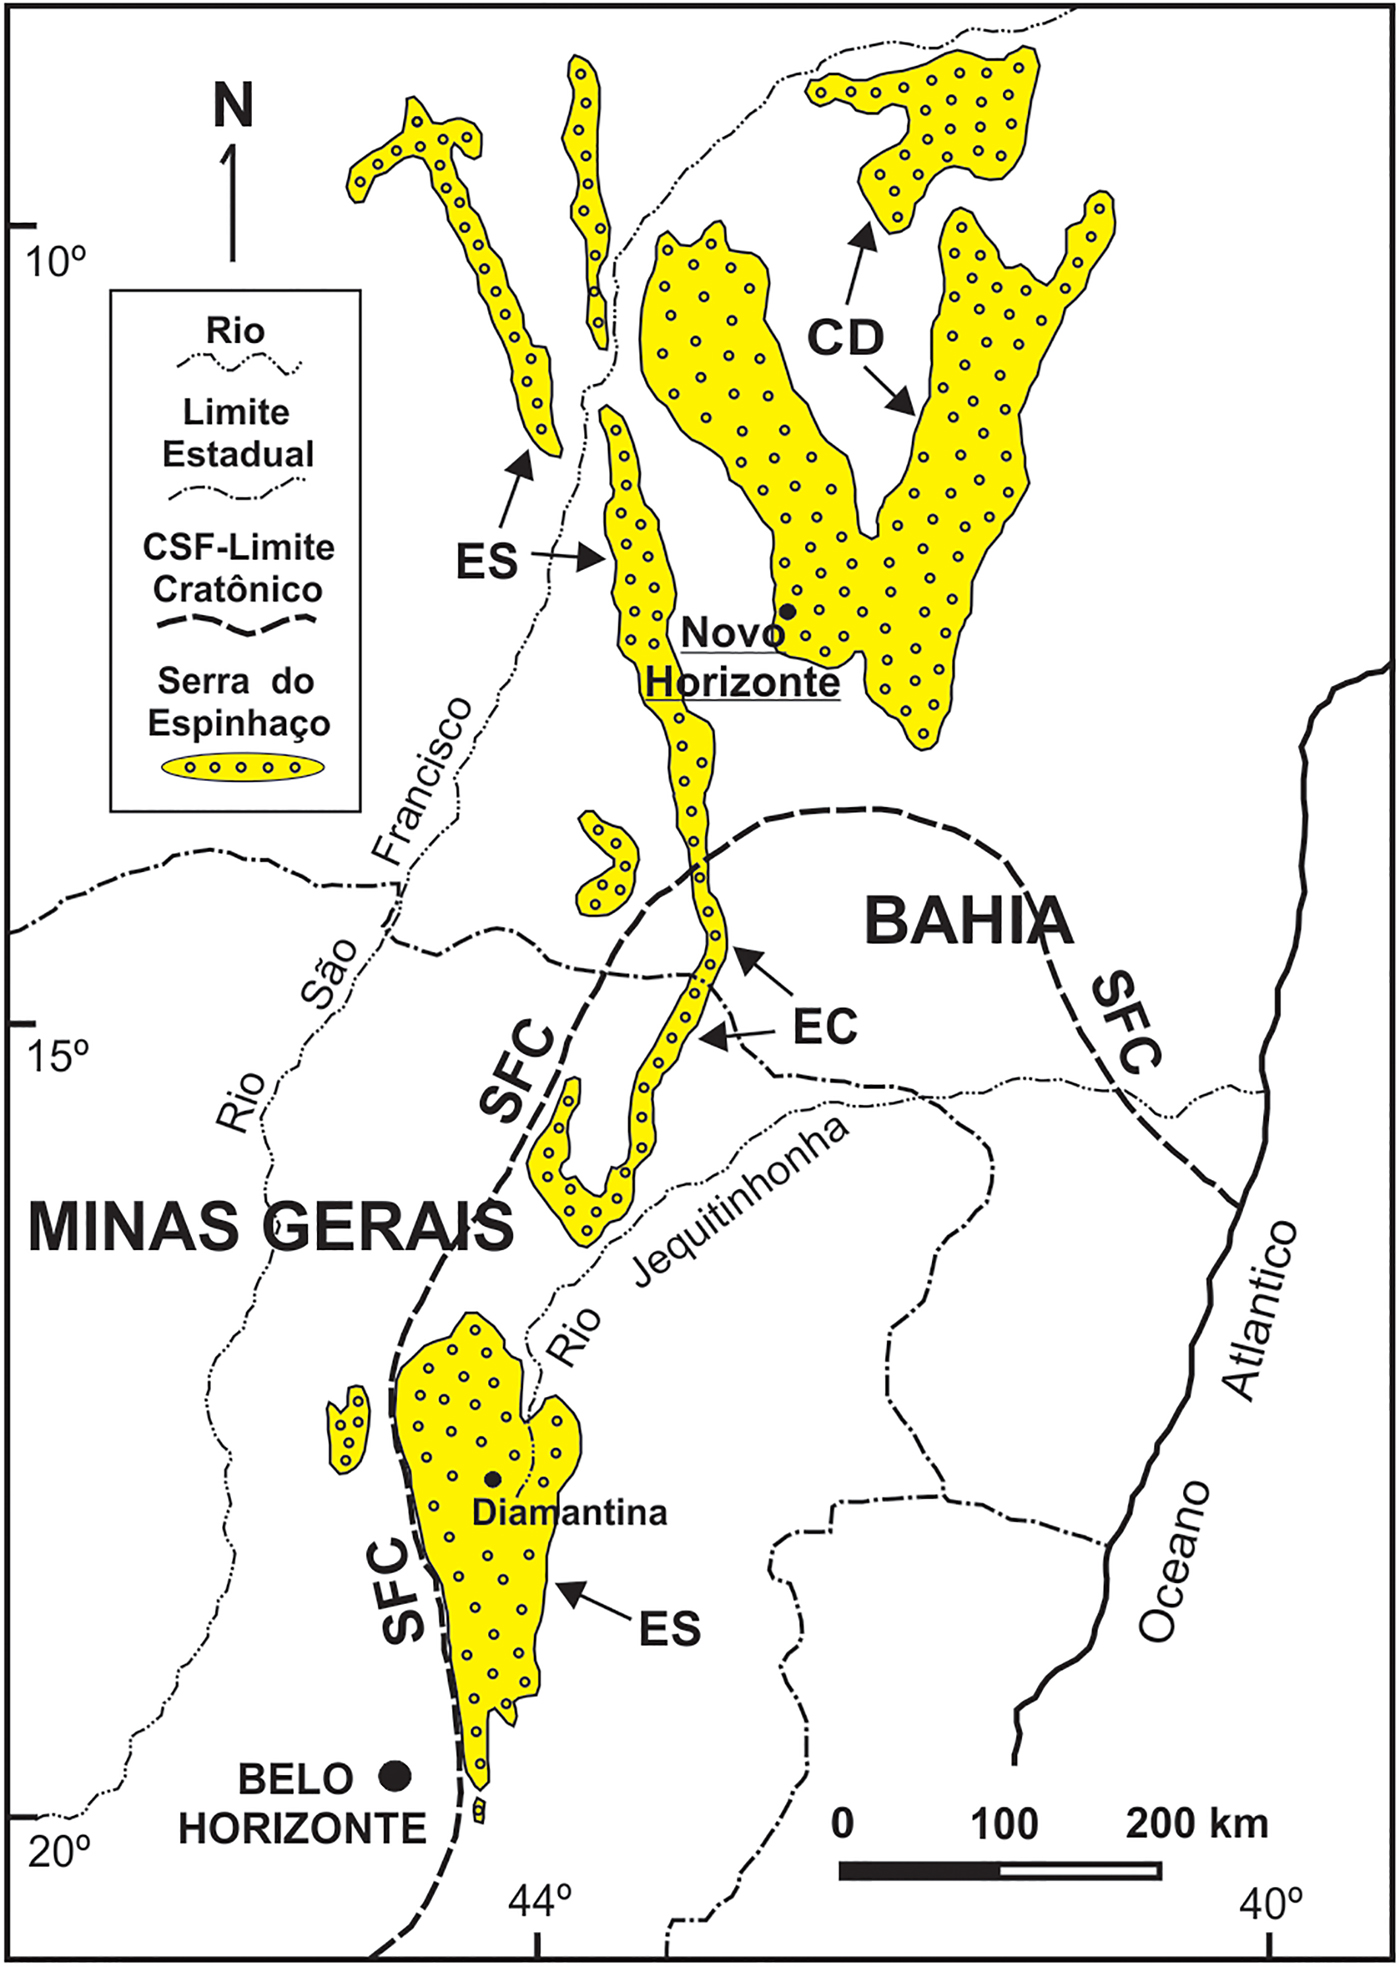
Parisite-(La) occurs in a late-stage hydrothermal vein crosscutting metarhyolites, at the Mula mine, Tapera village, Novo Horizonte, State of Bahia, Brazil (12°48'28”S, 42°10'04”W). The metarhyolites, together with metadacites and meta-andesites, constitute the Rio dos Remédios Group, a package of metavolcanic acid rocks formed as a result of peraluminous and alkaline magmatism during a continental rift which opened ~1.75 Ga (Teixeira, Reference Teixeira2005, Martins et al., Reference Martins, Andrade Filho, Loureiro, Arcanjo and Guimarães2008). This group crops out in an area of ~35 km × 10 km and is one of the lithologic members of a larger package of metasedimentary and locally metavolcanic rocks called Serra do Espinhaço that extends N–S for ~1200 km from the centre of Minas Gerais to the northern reaches of Bahia state (Fig. 1). The evolution of the sedimentary basin in this region occurred in several stages during the Mesoproterozoic (~1.7–1.2 Ga) and during subsequent metamorphism, folding and fracturing, during the Brasiliano Cycle of the Neoproterozoic (630–490 Ma, according to Pedrosa-Soares et al., Reference Pedrosa-Soares, Campos, Noce, Silva, Novo, Roncato, Medeiros, Castañeda, Queiroga, Dantas, Dussin, Alkmim, Sial, Bettencourt, De Campos and Ferreira2011). During the Brasiliano event, swarms of hydrothermal quartz veins were generated. These have been exploited at Novo Horizonte for the production of rutilated quartz, barite and gold. Martins et al. (Reference Martins, Andrade Filho, Loureiro, Arcanjo and Guimarães2008) reported muscovite ages of 404 and 490 Ma in altered metarhyolites close to these veins, confirming their formation during the Brasiliano event. Parisite-(La) is associated with almeidaite (its type locality is also the Mula mine: Menezes Filho et al., Reference Menezes Filho, Chukanov, Rastsvetaeva, Aksenov, Pekov, Chaves, Richards, Atencio, Brandão, Scholz, Krambrock, Moreira, Guimarães, Romano, Persiano, Oliveira and Ardisson2015), hematite, rutile, fluocerite-(Ce), brockite, monazite-(La), rhabdophane-(La) and bastnäsite-(La). The pit of the Mula mine is composed of brecciated quartz veins cemented by chalcedony. The veins show a stockwork pattern, which is typical of hydraulic fracturing processes, and are partially kaolinized; their orientation is NNW–SE, with a thickness of up to 2 m.
Fig. 1. The Espinhaço Range in Eastern Brazil (states of Bahia and Minas Gerais), showing its geographic/geotectonic domains Southern Espinhaço (SE), Central Espinhaço (CE), Northern Espinhaço (NE) and Chapada Diamantina (CD) in relation to the São Francisco Craton (SFC). The study area near Novo Horizonte (Bahia) is underlined.
Appearance and physical properties
Parisite-(La) occurs as residual nuclei (up to 5 mm) in doubly-terminated pseudo-hexagonal pyramidal crystals (up to 8.2 cm) with corrugated faces (Fig. 2a,b). The crystals apparently do not differ from what is usually described for parisite-(Ce): acute dipyramids with horizontally striated faces, terminated by a pinacoid. The pinacoid faces are cleavage planes. The crystals are prismatic in appearance due to the oscillatory combination of steep pyramids, but true prism faces are lacking or very small. However, the real forms of parisite-(La) can be pedion, pinacoid and sphenoid if the space group is C2, pedion, pinacoid and dome if Cm, or pinacoid and prism if C2/m. These crystals were partially replaced by bastnäsite-(La), monazite-(La) and rhabdophane-(La). Crusts consisting of microcrystals of parisite-(La) also occur (Fig. 2c).
Fig. 2 (a,b) Partial pseudomorphs of monazite-(La) [M], bastnäsite-(La) [B] and rhabdophane-(La) [R] after parisite-(La) [P]. (c) Crust consisting of microcrystals of parisite-(La).
Parisite-(La) is transparent, yellow–green to white, with white streak, and displays a vitreous (when yellow–green) to dull (when white) lustre. It is non-fluorescent under both shortwave (254 nm) and longwave (366 nm) ultraviolet radiation. Cleavage is distinct on pseudo-{001} and parting was not observed; and the fracture is laminated, conchoidal, or uneven. The Mohs hardness is between 4 and 5, and the mineral is brittle. Density was not measured; the calculated density is 4.273 g cm–3 using the empirical formula. In transmitted light parisite-(La) is colourless, pseudo-uniaxial (+), ω = 1.670(2) and ε = 1.782(5) (589 nm). Pleochroism was not observed.
Infrared and Raman spectroscopy
In order to obtain infrared (IR) absorption spectra, powdered samples were mixed with anhydrous KBr, pelletized, and analysed using an ALPHA FTIR spectrometer (Bruker Optics) with the resolution of 4 cm–1 in the wavenumber range from 360 to 3800 cm–1; 16 scans were obtained. The IR spectrum of an analogous pellet of pure KBr was used as a reference. The assignments of IR bands have been made in accordance with Adler and Kerr (Reference Adler and Kerr1963), White (Reference White and Farmer1974) and Nakamoto (Reference Nakamoto1997, Reference Nakamoto2009).
The IR spectrum of parisite-(La) is close to that of parisite-(Ce) (Fig. 3). Weak IR bands in the range 1700–3000 cm–1 correspond to overtones and combination modes. The other bands are assigned as follows (cm–1; w – weak band, s – strong band, sh – shoulder): 1454s, 1430sh (degenerate asymmetric C–O-stretching vibrations), 1089w, 1081w (non-degenerate symmetric C–O-stretching vibrations), 871s, 850sh (out-of-plane bending vibrations of the carbonate ion triangles), 746w, 734w (in-plane bending vibrations of the carbonate ion triangles), 679w, 602w (presumably, overtones and/or combination modes) and 368 (lattice mode involving Ca–O- or REE–O-stretching vibrations where REE = rare-earth elements). Bands in the range 3000–3800 cm–1 are not observed, which indicates the absence of OH groups.
Fig. 3. Powder infrared spectra of (a) parisite-(La) and (b) parisite-(Ce) with the empirical formula Ca1.08(Ce0.93La0.47Nd0.32Pr0.06Y0.08Th0.06)Σ1.92(CO3)3.00F1.88 from White Cloud Mine, Pyrites, Ravalli Co., Montana, USA.
The Raman spectrum of parisite-(La) (Fig. 4) was collected on a randomly oriented crystal at 100% of 150 mW on a Thermo Almega microRaman system, using a 532 nm solid-state laser, confocal Olympus optics with a 10x objective, and a thermoelectrically cooled CCD detector. The laser was partially polarized with 4 cm–1 resolution and a spot size of 1 µm. The peak at 1428 cm–1 corresponds to the v 3 asymmetric stretching mode of ![]() ${\rm CO}_3^{2-} $ anions. Symmetric C–O stretching modes are represented by the bands at 1081, 1091 and 1098 cm–1. The bands at 737 and 871 cm–1 correspond to in-plane and out-of-plane vibrations of
${\rm CO}_3^{2-} $ anions. Symmetric C–O stretching modes are represented by the bands at 1081, 1091 and 1098 cm–1. The bands at 737 and 871 cm–1 correspond to in-plane and out-of-plane vibrations of ![]() ${\rm CO}_3^{2-} $, respectively. The bands at 600 and 970 cm–1 may be due to any vibrations involving F– anions. Bands with wavenumbers below 500 cm–1 are attributed to lattice modes. The tentative assignment of Raman bands is based on previous studies (Frost and Dickfos, Reference Frost and Dickfos2007, Guastoni et al., Reference Guastoni, Kondo and Nestola2010, Frost et al., Reference Frost, López, Scholz, Xi and Belotti2013). All peaks above 1500 cm–1 are due to fluorescence. This effect is typical for REE compounds (see e.g. Betancourtt, Reference Betancourtt2003)
${\rm CO}_3^{2-} $, respectively. The bands at 600 and 970 cm–1 may be due to any vibrations involving F– anions. Bands with wavenumbers below 500 cm–1 are attributed to lattice modes. The tentative assignment of Raman bands is based on previous studies (Frost and Dickfos, Reference Frost and Dickfos2007, Guastoni et al., Reference Guastoni, Kondo and Nestola2010, Frost et al., Reference Frost, López, Scholz, Xi and Belotti2013). All peaks above 1500 cm–1 are due to fluorescence. This effect is typical for REE compounds (see e.g. Betancourtt, Reference Betancourtt2003)
Fig. 4. Raman spectrum of parisite-(La).
Chemical data
Chemical analyses (25) were carried out using a Cameca SX100 microprobe (WDS mode, 25 kV, 40 nA and beam diameter 5 µm) at the Department of Geosciences, University of Arizona, Tucson, Arizona, USA. H2O was not analysed because of the absence of bands corresponding to O–H vibrations in the IR spectrum. The thermogravimetric (TG) curve of parisite-(La) in nitrogen atmosphere is given in Fig. 5. The second step in the TG curve may be due to the decomposition of an intermediate carbonate. Fluorine is not lost during the heating because CaF2 melts above 1400°C without decomposition and REEF3 do not decompose into elements below 1200°C (Ranieri et al., Reference Ranieri, Baldochi and Klimm2008). The formula corresponding to a CO2 content of 23.68 wt.% obtained experimentally from TG data is not charge balanced. This weight loss is slightly less than 24.50 wt.% CO2 calculated for formula neutrality. Mean analytical results are given in Table 1. The empirical formula normalized on the basis of 11 (O + F) apfu is Ca0.98(La0.83Nd0.51Ce0.37Pr0.16Sm0.04Y0.03)Σ1.94C3.03O8.91F2.09, where CO2 was constrained to 24.50% for charge neutrality. The idealized formula is CaLa2(CO3)3F2, which requires: La2O3 60.80, CaO 10.46, CO2 24.63, F 7.09, O = F –2.98, total 100.00 wt.%.
Fig. 5. Thermogravimetric curve of parisite-(La).
Table 1. Chemical data for parisite-(La).
**Probe standard compositions (in wt.%): YAG = Y: 44.93, Al: 22.73, O: 32.34
REE1 = Si: 12.60, Al: 16.15, Ca: 17.98, Eu: 3.8, Gd: 3.87, Tb: 3.78, Tm: 3.81, O: 38.01
REE2 = Si: 12.65, Al: 16.21, Ca: 18.05, Nd: 3.65, Sm: 3.67, Yb: 3.74, Lu: 3.75, O: 38.27
REE3 = Si: 12.69, Al: 16.26, Ca: 18.1, Y: 3.21, La: 3.65, Ce: 3.42, Pr: 3.79, O: 38.88
An additional sample was measured at the Instituto de Geociências, Universidade Federal de Minas Gerais, Belo Horizonte, Minas Gerais, Brazil. Chemical analyses (7) were carried out using a Jeol JXA8900R electron microprobe (WDS mode, 15 kV, 20 and beam diameter 5 µm). Mean analytical results are given in Table 1. The empirical formula normalized on the basis of 11 (O + F) apfu is Ca0.91(La0.82Nd0.47Ce0.43Pr0.26Sm0.04Y0.02)Σ2.04(CO3)3.03F1.91, where CO2 was constrained to 24.70 wt.% for charge neutrality.
Crystallography
Single-crystal X-ray diffraction studies and Convergent-Beam Electron Diffraction (CBED) analysis performed under transmission electron microscopy (TEM) indicated monoclinic symmetry (pseudo-trigonal) and systematic absences compatible with space groups C2 (#5), Cm (#8), C2/m (#12). Single-crystal X-ray diffraction studies carried out using a Bruker APEX2 CCD automated diffractometer with graphite-monochromatized MoKα (λ = 0.71073 Å) radiation gave the following results: a = 12.356(1) Å, b = 7.1368(7) Å, c = 28.299(3) Å, β = 98.342(4)°, V = 2469.1(4) Å3 and Z = 12. The a : b : c ratio calculated from the unit cell parameters is 1.7313 : 1 : 3.9652. Gladstone-Dale is –0.046 (good) for the chemical analysis made in Arizona and –0.032 (excellent) (Mandarino, Reference Mandarino1981)for the chemical analysis made in Minas Gerais.
We confirmed that the space groups C2/c (#15) and Cc (#9) cited by Ni et al. (Reference Ni, Post and Hughes2000) were not consistent for parisite-(La). The space group C2/c (#15) analysis shows 816 reflections satisfying systematic absence conditions with an average I/s(I) of 2.07 (21,518 reflections read) and for the space group Cc (#9), there are 789 reflections with an average I/s(I) of 2.11 at the same conditions (20,612 reflections read).
For TEM studies, the sample was ground in an agate mortar and dispersed in a small volume (1 mL) of isopropanol. The suspension was dropped onto the carbon-coated Cu-TEM grid (300 mesh), and placed in a desiccator before TEM analysis. CBED and Nano-Beam Electron Diffraction (NBED) were performed by using a Tecnai G2-20 TEM (FEI), with a LaB6 filament, operated at 200 kV, at the Center of Microscopy at UFMG, Belo Horizonte, Brazil. The diffraction patterns were recorded by using a side-mounted ES500W Erlangshen CCD camera (Gatan). The CBED patterns were performed using a convergence semi-angle of 1.3 mrad, with a beam size of ~20 nm, and the NBED conditions were achieved by slightly spreading the C2 condenser lens to obtain a nearly parallel narrow beam.
In order to deduce the crystal system, the Bravais lattice, and the possible space group, electron diffraction experiments were carried out following Morniroli and Steeds (Reference Morniroli and Steeds1992), Redjaïmia and Morniroli (Reference Redjaïmia and Morniroli1994), Jacob et al. (Reference Jacob, Ji and Morniroli2012) and Morniroli (Reference Morniroli2013). A suitable area of the sample was illuminated by a focused narrow beam under the TEM. Observations of CBED patterns were done while the sample was being tilted around a chosen Kikuchi line, or a row containing reflections, which passed through the origin of the reciprocal lattice. Several zone axis patterns (ZAPs) were recorded in the CCD until the ZAP of highest ‘net’-symmetry had been found. The ‘net’-symmetry takes into account the position of the reflections observed in the diffraction pattern, not their intensity. It is defined as the symmetry of the spots ‘net’ displayed in the zeroth order Laue zone (ZOLZ) and the whole pattern (WP), which includes the ZOLZ and first order Laue zone (FOLZ) (Morniroli and Steeds, Reference Morniroli and Steeds1992; Jacob et al., Reference Jacob, Ji and Morniroli2012). Following Morniroli and Steeds (Reference Morniroli and Steeds1992), the ‘net’-symmetry is here referred as ‘(ZOLZ)WP’ symmetry – the (ZOLZ) symmetry is put in brackets henceforth in order to distinguish it from the WP's.
The identification of the monoclinic crystal system was achieved by observing the ZAP of highest ‘net’-symmetry shown in Fig. 6. The two perpendicular axes drawn in the pattern (Fig. 6) indicate 2 mirrors, and also 2-fold axes, for the spots net shown in the ZOLZ, therefore the symmetry is (2mm). The vertical axis shown in Fig. 6, however, is not a mirror for the WP, but the horizontal one. So the ‘net’-symmetry observed in this ZAP is (2mm)m. Comparisons with the Atlas of Electron Diffraction Zone-Axis Pattern (Morniroli, Reference Morniroli2013) showed that the ZAP shown in Fig. 6 corresponds to the [u0w] zone axis for the monoclinic system.
Fig. 6. Electron diffraction zone axis pattern of highest ‘net’ symmetry found in parisite-(La), required for the identification of the crystal system.
The non-primitive mS (mA or mB) Bravais lattice was deduced by comparing the features displayed in the diffraction pattern shown in Fig. 7 with the typical ZAPs for the monoclinic crystal system (Morniroli, Reference Morniroli2013). The Fig. 7a shows the ZOLZ reflections of the either [010]b or [001]c zone axis, on which two symmetry axes are drawn – the subscripts b and c stand for unique axis b and c, respectively. These non-perpendicular axes (beta* or gamma* equal 89.18°) indicate the 2-fold symmetry (2) for the spots net seen in the ZOLZ. The FOLZ reflections were not easily observed at first, so the electron beam was tilted along each axis until the FOLZ reflection could be seen at the microscope screen as shown in Figs 7b and c. From the observation of the FOLZ reflections the symmetry of the WP was taken as 2-fold. So the ‘net’-symmetry of this ZAP concluded as (2)2. This is the exact zone axis pattern required for the identification of the Bravais lattice for the monoclinic system (Morniroli, Reference Morniroli2013).
Fig. 7. Electron diffraction of the either [010]b or [001]c zone axis required for the identification of the Bravais lattice for the monoclinic crystal system. (a) Only the ZOLZ reflections are visible. The lines indicate the symmetry axis in the pattern. (b–c) Both ZOLZ and FOLZ reflections are visible after the electron beam had been tilted along each axis shown in (a). The narrow parallelogram drawn in each figure corresponds to the ‘unit’ cell in reciprocal space in the ZOLZ and FOLZ. The relative shift of the ‘unit’ cell in the FOLZ, along each symmetry axis, compared to the ZOLZ is an evidence for a non-primitive crystal system. There is no periodicity difference between ZOLZ and FOLZ reflections.
The narrow parallelograms drawn in the ZOLZ and FOLZ reflections shown in Fig. 7 correspond to the ‘unit’ cell in the reciprocal space. This ‘unit’ cell indicates the periodicity of reflections in the spots net in the diffraction pattern. As can be seen in Fig. 6, there is a relative shift of the ‘unit’ cell in the FOLZ compared to the ZOLZ. This means that the Bravais lattice of the parisite-(La) crystal is non-primitive (Morniroli and Steeds, Reference Morniroli and Steeds1992; Jacob et al., Reference Jacob, Ji and Morniroli2012). Therefore, the Bravais lattice is mS (mA or mB).
The lack of periodicity differences between ZOLZ and FOLZ reflections is evidence that there are no glide planes parallel to [010]b or [001]c (Morniroli and Steeds, Reference Morniroli and Steeds1992; Jacob et al., Reference Jacob, Ji and Morniroli2012) as reported by Ni et al. (Reference Ni, Post and Hughes2000) for parisite-(Ce). It was not possible to deduce the screw axis perpendicular to the zone axis pattern [u0w] shown in Fig. 6. The possible 21 screw axis perpendicular to that particular zone axis could be related to the forbidden reflections in the row defined by any of the symmetry axes shown in Fig. 6. The forbidden nodes would appear, however, to be due to a double diffraction effect. This could be investigated by tilting the beam around the symmetry axis shown in Fig. 6 in order to decrease the intensity of the probable forbidden reflections (Morniroli and Steeds, Reference Morniroli and Steeds1992), but it has been not verified during measurements. Moreover, the absence of glide planes parallel to [010]b or [001]c are consistent with the possible extinction symbols, A1–1b or B11–c. From the comparisons of the features observed in the experimental ZAPs with the typical theoretical diffraction patterns (Morniroli, Reference Morniroli2013), the possible space groups are A121 (#5), A1m1 (#8), A12/m1 (#12), B112 (#5), B11m (#8) or B112/m (#12), alternative settings of the space groups C2 (#5), Cm (#8), C2/m (#12).
Unfortunately, despite determining monoclinic unit-cell parameters from the single-crystal pattern, we could not obtain single-crystal data suitable for the structure refinement. Thin inclusions are visible under the microscope. It is possible they are the main cause of the absence of single crystals suitable for structural investigations. Inclusions of synchysite, röntgenite or bastnäsite microblocks are typical for parisite in general.
Powder X-ray diffraction data (Table 2) were obtained using a Rigaku R-AXIS Rapid II single-crystal diffractometer equipped with cylindrical image plate detector using Debye-Scherrer geometry (d = 127.4 mm; CoKα radiation). Parameters of the monoclinic unit cell refined from powder data are: a = 12.323(7), b = 7.121(2), c = 28.28(1) Å, β = 98.33(4)° and V = 2456(3) Å3. A comparison of data for parisite-(La) and parisite-(Ce) is given in Table 3.
Table 2. Powder X-ray diffraction data of parisite-(La).
*The hkl indices are chosen taking into account intensities of reflections of the powder X-ray diffraction pattern calculated from the structure data for monoclinic parisite-(Ce) reported by Ni et al. (Reference Ni, Post and Hughes2000).
Table 3. Comparative data for parisite-(La) and parisite-(Ce).
Discussion
The second most abundant REE in parisite-(La) from Mula mine is Nd, not Ce. On a chondrite-normalized plot there would be a marked negative Ce anomaly. One hypothesis about the conditions of formation could be that the fluids that transported REE had leached them in a mildly oxidizing environment, where Ce was partially oxidized to Ce4+ and thus remained immobile. The resulting solution would be depleted in Ce. For the other five parisite-(La) occurrences quoted in the literature, neither crystallographic nor chemical data are presented. The only exception is a partial chemical analysis for parisite-(La) from Třebíč durbachite massif, SW Moravia, Czech Republic (Sulovský, Reference Sulovský2001): La2O3 28.68, Ce2O3 24.07, Nd2O3 4.01, CaO 10.22, SO3 0.98, F 6.38, O = F –2.67, total 71.64 wt.%. The calculated formula is Ca1.01(La0.97Ce0.81Nd0.13)Σ1.91(CO3)2.89(SO4)0.07F1.84. In this case Ce is the second most abundant REE and the conditions of formation differ from that of parisite-(La) from Mula mine.
Acknowledgements
We acknowledge the Brazilian agencies FAPESP (processes 2014/50819-9 and 2013/03487-8), CNPq, and Finep for financial support, all members of the IMA Commission on New Minerals, Nomenclature and Classification, the Principal Editor Peter Williams, an anonymous reviewer and Fernando Colombo and Peter Leverett for their helpful suggestions and comments. M. Chaves thanks CNPq (grant No. 305492/2013-6) and R. Scholz thanks CNPq and FAPEMIG (respectively grant No. 305284/2015-0 and grant APQ-01448-15).