Introduction
Several mines in Red Canyon in southeast Utah, USA, have in recent years yielded a remarkable array of new uranyl minerals. Of particular note are uranyl sulfates possessing a variety of structural motifs. Described herein are the new minerals magnesioleydetite and straβmannite, which possess topologically identical uranyl-sulfate sheets that are very similar to the uranyl-sulfate sheet in wetherillite, Na2Mg(UO2)2(SO4)4·18H2O (Kampf et al., Reference Kampf, Plášil, Kasatkin and Marty2015a), another mineral described recently from this area.
Magnesioleydetite is named as the Mg analogue of leydetite, Fe2+(UO2)(SO4)2·11H2O (Plášil et al., Reference Plášil, Kasatkin., Škoda, Novák, Kallistová, Dušek, Skála, Fejfarová, Čejka, Meisser, Goethals, Machovič and Lapčák2013), with Mg replacing Fe2+ in the interlayer octahedral cation site. Straβmannite is named for German chemist Friedrich Wilhelm (Fritz) Straβmann (1902–1980) who worked with Otto Hahn and Lise Meitner on the discovery of nuclear fission (of uranium) in 1938. It was Straβmann who, in 1938, identified barium as a product of the bombardment of uranium with neutrons, direct evidence of the process of nuclear fission. Hahn received the Nobel Prize for Chemistry in 1944 for the discovery of nuclear fission. Straβmann served as Director of the Max Planck Institute for Chemistry from 1949 to 1953 and later founded the Institute of Nuclear Chemistry. In 1966, U.S. President Lyndon Johnson presented the Enrico Fermi Award to Hahn, Meitner and Straβmann. He and his wife were recognised in 1985 by the Yad Vashem Institute (Jerusalem) as “Righteous Among the Nations” for hiding a Jew in their home in Germany during World War II. In 1989, the International Astronomical Union named an asteroid for him, 19136 Straβmann.
The new minerals and their names were approved by the Commission on New Minerals, Nomenclature and Classification of the International Mineralogical Association based upon proposals IMA2017-063 for magnesioleydetite and IMA2017-086 for straβmannite. All type specimens have been deposited in the collections of the Natural History Museum of Los Angeles County, 900 Exposition Boulevard, Los Angeles, CA 90007, USA. The four magnesioleydetite cotypes have been assigned catalogue numbers 66647, 66648, 66649 and 66650; however, the magnesioleydetite crystals originally on all of these specimens have largely transformed to a lower hydrate, although remnant domains of magnesioleydetite may remain in some crystals. There are also four straβmannite cotypes, two each from the Green Lizard (67264 and 67265) and Markey (67266 and 67267) mines.
Occurrence
Magnesioleydetite was found underground in the Markey mine (37°32′57″N, 110°18′08″W). Straβmannite was first discovered on specimens collected underground in the Green Lizard mine (37°34′37.10″N, 110°17′52.80″W) and was later found underground in the Markey mine. Both mines are in the White Canyon mining district, San Juan County, Utah, USA, ~72 km west of the town of Blanding, Utah. The Green Lizard mine is near the head of Low Canyon on the east side of Red Canyon, 2.1 km north of the Blue Lizard mine. The Green Lizard mine is also a type locality for greenlizardite (Kampf et al., Reference Kampf, Plášil, Nash and Marty2018b), shumwayite (Kampf et al., Reference Kampf, Plášil, Kasatkin, Marty, Čejka and Lapčák2017b) and meitnerite (Kampf et al., Reference Kampf, Plášil, Nash and Marty2018c). The Markey mine is also a type locality for feynmanite (Kampf et al., Reference Kampf, Olds, Plášil, Marty and Perry2019), leószilárdite (Olds et al., Reference Olds, Sadergaski, Plášil, Kampf, Burns, Steele and Mills2017) and markeyite (Kampf et al., Reference Kampf, Plášil, Kasatkin, Marty and Čejka2018a).
The Markey mine is ~1 km southwest of the Blue Lizard mine, on the west side of Red Canyon. The geology of both mines (see below) is similar to that of the Blue Lizard mine (Kampf et al., Reference Kampf, Plášil, Kasatkin, Marty and Čejka2017a; Chenoweth, Reference Chenoweth1993). Mineralised channels are in the Shinarump member of the Chinle Formation. The Shinarump member consists of medium- to coarse-grained sandstone, conglomeratic sandstone beds and thick siltstone lenses. Ore minerals were deposited as replacements of wood and other organic material and as disseminations in the enclosing sandstone. Since the mines closed, oxidation of primary ores in the humid underground environment has produced a variety of secondary minerals, mainly sulfates, as efflorescent crusts on the surfaces of mine walls.
Magnesioleydetite and straβmannite are both rare minerals. At the Markey mine, they are found together on asphaltum in association with arsenuranospathite, gypsum, metakahlerite, nováčekite-II, uramarsite and at least one additional potentially new Mg uranyl sulfate. At the Green Lizard mine, straβmannite is found on matrix comprised of mainly subhedral to euhedral, equant quartz crystals that are recrystallised counterparts of the original grains of the sandstone; some asphaltum is intermixed with the quartz grains. It is associated with gypsum, halotrichite, rozenite and the Mg analogue of rietveldite.
The principal factors that are likely to control the formation of the various uranyl-sulfate phases at the Blue Lizard mine were discussed by Kampf et al. (Reference Kampf, Plášil, Kasatkin, Marty and Čejka2017a) and these also apply, to similar mines in the area, including the Green Lizard and Markey mines. Briefly, these minerals form at ambient temperature by evaporative processes at the surface of a rock with high relative porosity. The environment is relatively oxidising (high Eh) and solutions are generally acidic (low pH). The relative acidity prevalent during the formation of any given phase can be interpreted from its crystal structure (and, specifically, its structural unit) by considering the charge deficiency per anion (CDA) calculated using the bond-valence approach (cf. Hawthorne and Schindler, Reference Hawthorne and Schindler2008; Hawthorne, Reference Hawthorne2012); higher CDA correlates with higher pH. The molar proportions of S and U in the formulas of the various uranyl sulfates are indicative of the relative concentrations of these elements in solution during formation. Minerals with higher molar proportions of U relative to S can be inferred to form closer to the source of U and, therefore, probably earlier in the paragenesis. The molar proportion of H2O can be expected to decrease with decreasing relative humidity as evaporative processes proceed during formation.
The uranyl-sulfate sheet structural units in magnesioleydetite and straβmannite, being topologically identical, yield a CDA of 0.22 valence units (vu) for both minerals, as well as for wetherillite, which has a similar uranyl-sulfate sheet. Therefore, we can expect all three minerals to form at about the same pH – intermediate among the new uranyl-sulfate phases listed by Kampf et al. (Reference Kampf, Plášil, Kasatkin, Marty and Čejka2017a), which range in CDA from 0.10 vu (shumwayite) to 0.34 vu (belakovskiite). Magnesioleydetite and straβmannite have the same proportion of U relative to S (U:S = 1:2). By comparison, among the new uranyl sulfates from the area, shumwayite and plášilite have the highest proportions of U vs. S (U:S = 1:1), while belakovskiite has the lowest (U:S = 1:5). Therefore, both magnesioleydetite and straβmannite can be expected to form relatively near the source of the U. Finally, it is notable that straβmannite has a much greater molar proportion of H2O than magnesioleydetite, suggesting that it formed later than straβmannite during progressive evaporation from the porous rock surface.
Besides straβmannite, the only other phases with essential F that have been confirmed from the uranium mines in Red Canyon are uranospathite, Al(UO2)2(PO4)2F·20H2O, and arsenuranospathite, Al(UO2)2(AsO4)2F·20H2O, both of which are also secondary phases and are found at the Markey mine. The well-known affinity of Al for F explains why essential Al and F are both found in all three of these phases. It may be that there were Al fluoride complexes in the solutions from which these minerals formed; however, it is clear that F is quite rare in these deposits and no precursor F-bearing phases have been identified.
Physical and optical properties
Magnesioleydetite
Magnesioleydetite occurs as transparent to translucent, pale green–yellow blades up to ~0.2 mm long, commonly growing in irregular aggregates to ~0.5 mm across (Fig. 1). Blades are flattened on {001}; no other forms could be measured, but the general crystal shape can be generated with the additional forms {11![]() $ {\bar 1} $} and {10
$ {\bar 1} $} and {10![]() $ {\bar 1} $}, combined with twinning by 180° rotation on [1
$ {\bar 1} $}, combined with twinning by 180° rotation on [1![]() $ {\bar 1} $0] (indicated by single-crystal X-ray diffraction); the composition plane appears to be {11
$ {\bar 1} $0] (indicated by single-crystal X-ray diffraction); the composition plane appears to be {11![]() $ {\bar 1} $} (Fig. 2). The lustre is vitreous, the streak is white and the mineral is non-fluorescent. Crystals are somewhat brittle, with Mohs hardness of ~2, irregular fracture and one perfect cleavage on {001}. The density could not be measured because of the scarcity and small size of crystals. The calculated density is 2.463 g/cm3 for the empirical formula and 2.434 g/cm3 for the ideal formula. Small crystal size, small amount of material, crystal twinning and the tendency of crystals to dehydrate all conspired to make the determination of optical properties impossible. The optical properties of leydetite could only be determined partially for some of the same reasons. It is likely that magnesioleydetite has indices of refraction similar to those of leydetite: α' = 1.513 and γ' = 1.522. The average index of refraction predicted by the Gladstone–Dale relationship is 1.512 for magnesioleydetite. The mineral is easily soluble in room-temperature H2O and dehydrates readily even at moderate relative humidity. The crystal used for the structure determination transformed to a lower hydrate following data collection, despite being coated with Apiezon grease.
$ {\bar 1} $} (Fig. 2). The lustre is vitreous, the streak is white and the mineral is non-fluorescent. Crystals are somewhat brittle, with Mohs hardness of ~2, irregular fracture and one perfect cleavage on {001}. The density could not be measured because of the scarcity and small size of crystals. The calculated density is 2.463 g/cm3 for the empirical formula and 2.434 g/cm3 for the ideal formula. Small crystal size, small amount of material, crystal twinning and the tendency of crystals to dehydrate all conspired to make the determination of optical properties impossible. The optical properties of leydetite could only be determined partially for some of the same reasons. It is likely that magnesioleydetite has indices of refraction similar to those of leydetite: α' = 1.513 and γ' = 1.522. The average index of refraction predicted by the Gladstone–Dale relationship is 1.512 for magnesioleydetite. The mineral is easily soluble in room-temperature H2O and dehydrates readily even at moderate relative humidity. The crystal used for the structure determination transformed to a lower hydrate following data collection, despite being coated with Apiezon grease.
Fig. 1. Magnesioleydetite. The field of view is 1.5 mm across.
Fig. 2. Crystal drawing of magnesioleydetite twin, clinographic projection in nonstandard orientation, [1![]() $ {\bar 1} $0] vertical.
$ {\bar 1} $0] vertical.
Straβmannite
Light yellow–green, equant, transparent straβmannite crystals to 0.2 mm occur in irregular aggregates to ~0.5 mm across (Fig. 3). It has nearly white streak and exhibits bright greenish-blue fluorescence in 405 nm light. It is somewhat brittle, with Mohs hardness of ~1½, irregular fracture and one good cleavage on {001}. The density measured by flotation in a mixture of methylene iodide and toluene is 2.20(2) g/cm3. The calculated densities are 2.173 g/cm3 for the empirical formula and 2.179 g/cm3 for the ideal formula. Straβmannite is optically biaxial (–) with α = 1.477(2), β = 1.485(2) and γ = 1.489(2) (white light). The 2V measured directly on a spindle stage is 72(2)°; the calculated 2V is 70.2°. There is slight r > v dispersion. The optical orientation is Y = b and X ∧ c = 20° in the obtuse angle β and the pleochroism is X = nearly colourless, Y = pale green–yellow, Z = light green–yellow; and X < Y < Z. Straβmannite is easily soluble in room-temperature H2O.
Fig. 3. Indistinct intergrowths of straβmannite crystals (pale yellow) with rozenite (white) on quartz/asphaltum matrix from the Green Lizard mine. The field of view is 0.84 mm across.
Raman spectroscopy
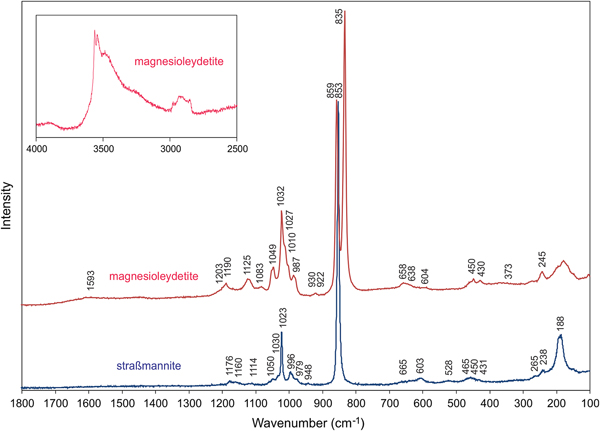
Raman spectroscopy was conducted on a Horiba XploRA PLUS. The spectrum for magnesioleydetite was recorded from 4000 to 100 cm−1 using a 532 nm diode laser. Straβmannite exhibited pronounced fluorescence using a 532 nm diode laser; consequently, its spectrum was recorded from 2000 to 100 cm−1 using a 785 nm diode laser. The spectrum for magnesioleydetite was featureless between 2800 and 1600 cm−1, and that for straβmannite was featureless between 2000 and 1200 cm−1. The spectra from 1800 to 100 cm−1 for both minerals are compared in Fig. 4 and the spectrum for magnesioleydetite in the 4000 to 2500 cm−1 region is shown as a vertically exaggerated insert in Fig. 4.
Fig. 4. Raman spectra of magnesioleydetite (532 nm laser) and straβmannite (785 nm laser). Note that the insert showing the magnesioleydetite spectrum from 4000 to 2500 cm−1 is vertically exaggerated (×10) relative to the spectrum from 1300 to 100 cm−1. See text for band assignments.
Magnesioleydetite
A broad band composed of several overlapping bands between ~3600 cm−1 and 3200 cm−1 is attributed to the ν O–H stretching vibrations of the H2O molecules. According to the empirical correlation given by Libowitzky (Reference Libowitzky1999) the H···A lengths of the corresponding hydrogen bonds are in the range of 2.4 to 1.8 Å. The weak feature at ~2932 cm−1 is most probably due to organic impurities. A very weak, broad band at 1593 cm−1 is connected with the ν2 (δ) H–O–H bending vibration of the H2O molecules. The low intensity of the ν2 (δ) H2O vibration is not uncommon in Raman, as the technique is sensitive to a change of the tensor of polarisability, and not for a dipole moment.
Weak bands with shoulders around 1200–1100 cm−1 [1203(sh), 1190, 1125 and 1083 cm−1] are attributed to split triply degenerate ν3 antisymmetric stretching vibration of the SO4 tetrahedra. Compared to them, the bands related to the ν1 symmetric stretching vibrations of SO4 tetrahedra have higher intensities: 1049 and 1032 cm−1 (with shoulders at 1027 and 1010 cm−1). The number of split bands is in line with the presence of two symmetrically non-equivalent SO4 tetrahedra in the structure (cf. bluelizardite or synthetic klaprothite; Plášil et al., Reference Plášil, Meisser and Čejka2016). The weak band at 987 cm−1 may be attributed to δ U–O–H vibration. A weak, two-component band at 930 and 922 cm−1 is assigned to the ν3 antisymmetric stretching vibration of the uranyl ion, UO22+; and the two-component, very strong, partially overlapping bands at 859 and 835 cm−1 are assigned to the ν1 symmetric U–O stretching vibration of UO22+. In the crystal structure, there is only one unique U atom, so the two peaks cannot represent splitting due to symmetrically independent U atoms. Therefore, we conclude that one of these peaks is an artifact, probably caused by some organic matter (C–C stretches; compare e.g. Quilès and Burneau, Reference Quilès and Burneau1998; Unruh et al., Reference Unruh, Gojdas, Flores, Libo and Forbes2013; Kampf et al., Reference Kampf, Plášil, Kasatkin, Marty and Čejka2015b) as a surface contaminant. This is well supported also by the presence of C–H bands at ~2900 cm−1. Note that the crystal had been preserved in Apiezon grease, which was removed with xylene prior to the recording of the Raman spectrum. Based on inferred U–O bond lengths (after Bartlett and Cooney, Reference Bartlett and Cooney1989) for UO22+ of ~1.78 and ~1.75 Å (ν1 835 and 859 cm−1), we conclude that the band at 835 cm−1 is attributable to ν1 UO22+. The bond lengths inferred from the wavenumber of ν3 UO22+ are ~1.76 and ~1.77 Å.
Weak Raman bands at 658, 638 and 604 cm−1 are attributed to the ν4 (δ) triply degenerate antisymmetric stretching vibrations of SO4 tetrahedra. Weak Raman bands 450 and 430 cm−1 are related to the split ν2 (δ) doubly degenerate bending vibrations of SO4.
The band at 373 cm−1 can be attributed to Mg–O stretching vibrations (cf. Kampf et al., Reference Kampf, Plášil, Kasatkin and Marty2015a,Reference Kampf, Kasatkin, Čejka and Martyc; Plášil et al., Reference Plášil, Buixaderas, Čejka, Sejkora, Jehlička and Novák2010, Reference Plášil, Meisser and Čejka2016; Volkovich et al., Reference Volkovich, Griffiths, Fray and Fields1998). A strong Raman band at 245 cm−1, with shoulders at to both higher and lower energies are most probably overlapping ν2 (δ) doubly degenerate bending vibration of the UO22+ and U–Oeq–ligand stretching modes (cf. Bullock and Parret, Reference Bullock and Parret1970; Ohwada, Reference Ohwada1976; Brittain et al., Reference Brittain, Ansari, Toivonen, Niinisto, Tsao and Perry1985; Plášil et al., Reference Plášil, Buixaderas, Čejka, Sejkora, Jehlička and Novák2010). Weak bands at the lowest energies can be assigned to unclassified lattice modes, most probably skeletal vibrations of the entire sheet of polyhedra.
Straβmannite
Bands at 1176, 1160 and 1114 cm−1 are attributed to the split triply degenerate ν3 antisymmetric stretching vibration of the SO4 tetrahedra. A band at 1050 cm−1 could be also related to the stretching vibrations of the SO4 tetrahedra; however, there is only one symmetrically unique S site in the structure of straβmannite, so the assignment is of this band is disputable. A narrow band at 1023 cm−1 with a shoulder at 1030 cm−1 is assigned to the ν1 symmetric stretching vibrations of the SO4 tetrahedra. The assignment of the bands of weak intensity at 996 and 979 cm−1 is not clear. A very weak band at 948 cm−1 may be related to the ν3 antisymmetric stretching vibration of the uranyl ion, UO22+. A very strong band at 853 cm−1 is assigned to the ν1 symmetric U–O stretching vibration of the UO22+ ion. The inferred U–O bond lengths (after Bartlett and Cooney, Reference Bartlett and Cooney1989) in the uranyl ion of ~1.76 Å (from ν1) are in line with those derived from the X-ray study (see below). Weak Raman bands at 665 and 603 cm−1 are attributed to the ν4 (δ) triply degenerated antisymmetric stretching vibrations of the SO4 tetrahedra. Weak Raman bands at 528, 465, 450 and 431 (sh) cm−1 are related to the split ν2 (δ) doubly degenerate bending vibrations of the SO4. Bands at 265 and 238 cm−1 are most probably related to the ν2 (δ) doubly degenerate bending vibration of the UO22+. A quite intense band at 188 cm−1 is most probably a lattice mode.
Chemical composition
Magnesioleydetite
Electron probe microanalyses (EPMA) were performed (on 8 points) in the laboratory of the Fersman Mineralogical Museum using a CamScan 4D electron microprobe in energy-dispersive spectroscopy mode (20 kV, 5 nA and 3 µm beam diameter). Attempts to use wavelength-dispersive spectroscopy with a higher beam current were made, but resulted in partial dehydration of the mineral and significantly higher totals. H2O was not determined directly because of extreme paucity of material. The H2O content was calculated by stoichiometry on the basis of 3 U + S and 21 O apfu as indicated by the crystal-structure refinement. The Raman spectrum confirms the presence of H2O and the absence of B–O, C–O and N–O bonds in the mineral. Analytical data are given in Table 1.
Table 1. Chemical composition (in wt.%) for magnesioleydetite.
* Based on the structure.
S.D. – standard deviation.
The empirical formula based on the criteria above is (Mg0.56Fe0.26Zn0.11Mn0.01)Σ0.94(U0.98O2)(S1.01O4)2·11H2.01O. The ideal formula is Mg(UO2)(SO4)2·11H2O which requires MgO 5.89, SO3 23.39, UO3 41.78 and H2O 28.95, total 100 wt.%. The Gladstone–Dale compatibility index could not be computed because the indices of refraction could not be determined.
Straβmannite
Electron probe microanalyses (5 points on two crystals from the Green Lizard mine and 3 points on one crystal from the Markey mine) were performed at the University of Utah on a Cameca SX-50 electron microprobe with four wavelength-dispersive spectrometers and using Probe for EPMA software. Analytical conditions were: accelerating voltage = 15 keV, beam current = 10 nA and a beam diameter = 10 µm. Raw X-ray intensities were corrected for matrix effects with a ɸρ(z) algorithm (Pouchou and Pichoir, Reference Pouchou, Pichoir, Heinrich and Newbury1991). Time-dependent intensity corrections were applied to Al, U, S and F; no systematic variation in Na was noted during analyses. Straβmannite was very challenging to analyse. It was impossible to obtain a good polish and crystal surfaces suffered further because of crystal dehydration. The wide ranges in analytical values are probably largely the result of the poor crystal surfaces. Because insufficient material is available for a direct determination of H2O, it is calculated by stoichiometry on the basis of 3 U + S and 27 O + F + Na apfu as indicated by the structure determination. Note that Na is assumed to substitute for H2O in the interlayer region in the structure. Analytical data are given in Table 2.
Table 2. Chemical composition (in wt.%) for straβmannite.
* Based on the structure.
S.D. – standard deviation.
The empirical formula based upon the criteria above is Al1.00Na0.16(U0.99O2)(S1.005O4)2[F0.58(OH)0.42]·15.84H1.99O. The simplified formula is Al(UO2)(SO4)2F·16H2O, which requires Al2O3 6.40, UO3 35.92, SO3 20.11, F 2.39 and H2O 36.19, O = F –1.00, total 100 wt.%. The Gladstone–Dale compatibility index (Mandarino, Reference Mandarino2007), 1 – (K P/K C), for the empirical formula is –0.013 (superior) based on the empirical formula and –0.030 (excellent) based on the ideal formula, in both cases using k(UO3) = 0.118, as provided by Mandarino (Reference Mandarino1976).
X-ray crystallography and structure refinement
Powder X-ray studies were carried out using a Rigaku R-Axis Rapid II curved imaging plate microdiffractometer, with monochromatised MoKα radiation (λ = 0.71075 Å). A Gandolfi-like motion on the ϕ and ω axes was used to randomise the samples and observed d values and intensities were derived by profile fitting using JADE 2010 software (Materials Data, Inc.). The powder data for magnesioleydetite (Table 3) and those for straβmannite (Table 4) show good agreement with the patterns calculated from the structure determinations.
Table 3. Powder X-ray diffraction data (d in Å) for magnesioleydetite. Only calculated lines with I ≥ 2 are listed.
The strongest lines are given in bold
Table 4. Powder X-ray diffraction data (d in Å) for straβmannite. Only calculated lines with I ≥ 2 are listed.
The strongest lines are given in bold
For both minerals, the single-crystal structure data were collected at room temperature using the same diffractometer and radiation noted above. The straβmannite crystal used was from the Green Lizard mine. The data were processed using the Rigaku CrystalClear software package and empirical (multi-scan) absorption corrections were applied using the ABSCOR program (Higashi, Reference Higashi2001) in the CrystalClear software suite. The structures were solved by direct methods using SIR2011 (Burla et al., Reference Burla, Caliandro, Camalli, Carrozzini, Cascarano, Giacovazzo, Mallamo, Mazzone, Polidori and Spagna2012) and SHELXL-2013 (Sheldrick, Reference Sheldrick2015) was used for the refinements of the structures. Difference-Fourier syntheses located all H atom positions for both structures, which were then refined with soft restraints of 0.82(3) Å on the O–H distances and 1.30(3) Å on the H–H distances, and with the U eq of each H set to 1.2 times that of the donor O atom.
Magnesioleydetite
The crystal used for the structure determination consisted of a single individual with a small twinned component; the omission of 20 reflections compensated for most of the overlap problems. The site-scattering value (mean atomic number × site multiplicity) for the Mg site refined to 76.67 e−. In the final refinement cycles, this site was assigned an occupancy of Mg0.56Fe0.26Zn0.18, which corresponds to a site-scattering value of 75.52 e−. Data collection and refinement details are given in Table 5, atom coordinates and displacement parameters in Table 6, selected bond distances in Table 8 and a bond valence analysis in Table 10.
Table 5. Data collection and structure-refinement details for magnesioleydetite and straβmannite.
R int = Σ|F o2–F o2(mean)|/Σ[F o2]. GoF = S = {Σ[w(F o2–F c2)2]/(n–p)}1/2. R 1 = Σ||F o|–|F c||/Σ|F o|. wR 2 = {Σ[w(F o2–F c2)2]/Σ[w(F o2)2]}1/2; w = 1/[σ2(F o2)+(aP)2+bP] and P is [2F c2+Max(F o2,0)]/3; for magnesioleydetite a is 0.0154 and b is 1.9286; for straβmannite a is 0.0243 and b is 12.6098.
Table 6. Atom coordinates and displacement parameters (Å2) for magnesioleydetite.
Straβmannite
The Al–OW1 bond (1.813 Å) is very short for an Al–O bond, but quite reasonable for an Al–F bond. The average EPMA indicates only enough F to occupy ~29% of this site [corresponding to F0.29OH0.21(H2O)0.5 in the site and F0.58(OH)0.42(H2O) in the formula unit] and, considering the range in F content, the EPMA suggests that this site does not have more than ~50% occupancy by F. The difference-Fourier map provided no indication that the OW1 site is split into separate O and F sites and efforts to force splitting of this site were unsuccessful, probably owing to the fact that they would only need to be separated by ~0.05 Å to obtain optimal bond distances to Al. Ultimately, this site was refined with joint occupancy by O and F, providing an occupancy of 0.50(7) each for O and F. Note that the H atoms associated with OW1 were included in the O/F occupancy refinement for the OW1 site. The bond-valence analysis suggested that the H atoms associated with OW5 and OW7 have different configurations, depending on the occupancy of the OW1 site, such that when the OW1 site is occupied by F, it receives hydrogen bonds from OW5 and OW7, but when the OW1 site is an H2O, it contributes hydrogen bonds to OW5 and OW7 (Fig. 5). Difference-Fourier revealed one fully occupied H site and two half-occupied H sites each for OW5 and OW7 in line with the hydrogen-bonding scheme supported by the bond-valence analysis. The structural placement of the small amount of Na indicated in the chemical analysis is not entirely clear; however, it seems quite likely that it replaces some of the H2O in the interlayer region, and this has been taken into consideration for the basis of the empirical formula. Data collection and refinement details are given in Table 5, atom coordinates and displacement parameters in Table 7, selected bond distances in Table 9 and a bond-valence analysis in Table 11.
Fig. 5. Hydrogen bonding configurations for the F/OW1 site in the straβmannite structure depending upon whether the site is occupied by F (top) or O (bottom). Hydrogen bonds are shown with dashed lines.
Table 7. Atom coordinates and displacement parameters (Å2) for straβmannite.
Table 8. Selected bond distances (Å) and angles (°) for magnesioleydetite.
Table 9. Selected bond distances (Å) and angles (°) for straβmannite.
Table 10. Bond-valence analysis for magnesioleydetite. Values are expressed in valence units.*
* Multiplicity is indicated by ×↓. The bond valences associated with the Mg site are based on the assigned occupancy for the site (Mg0.56Fe0.26Zn0.18). Cation–O bond valence parameters are from Gagné and Hawthorne (Reference Gagné and Hawthorne2015). Hydrogen-bond strengths based on O–O bond lengths from Ferraris and Ivaldi (Reference Ferraris and Ivaldi1988).
Table 11. Bond-valence analysis for straβmannite. Values are expressed in valence units.*
* Multiplicity is indicated by ×↓. Al–O and U–O bond-valence parameters are from Gagné and Hawthorne (Reference Gagné and Hawthorne2015). Al–F bond-valence parameters are from Brown and Altermatt (Reference Brown and Altermatt1985). Hydrogen-bond strengths based on O–O bond lengths from Ferraris and Ivaldi (Reference Ferraris and Ivaldi1988). Bond valences of ±0.09 and ±0.11 for OW5 and OW7 represent ½ hydrogen bonds accepted and donated.
The crystallographic information files have been deposited with the Principal Editor of Mineralogical Magazine and are available as Supplementary material (see below).
Description and discussion of the structures
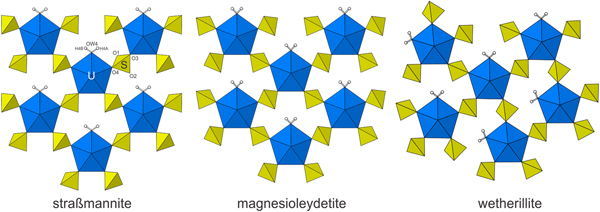
In both structures, the U sites are surrounded by seven O atoms forming squat UO7 pentagonal bipyramids. This is the most typical coordination for U6+, particularly in uranyl sulfates, where the two short apical bonds of the bipyramid constitute the UO2 uranyl group. The UO7 bipyramids share four of their equatorial vertices with SO4 tetrahedra. Each SO4 tetrahedron, in turn, shares two of its vertices with UO7 bipyramids. The remaining unshared equatorial vertex of the bipyramid is occupied by an H2O group, which forms hydrogen bonds to one of the free vertices of the SO4 tetrahedron. The linkages of the UO7 bipyramids and sulfate tetrahedra form a [(UO2)(SO4)2(H2O)] sheet parallel to {001} that is based upon a derivative of the protasite anion topology, graph notation I1/2b (see Lussier et al., Reference Lussier, Lopez and Burns2016).
Magnesioleydetite is the same as that of leydetite, Fe2+(UO2)(SO4)2·11H2O (Plášil et al., Reference Plášil, Kasatkin., Škoda, Novák, Kallistová, Dušek, Skála, Fejfarová, Čejka, Meisser, Goethals, Machovič and Lapčák2013), with Mg replacing Fe2+ in the interlayer octahedral cation site. The synthetic equivalent of magnesioleydetite was reported by Serezhkin et al. (Reference Serezhkin, Soldatkina and Efremov1981). The uranyl-sulfate sheets in the structures of magnesioleydetite and straβmannite are topologically identical, but are geometrical isomers. The sheets are similar to those in wetherillite, Na2Mg(UO2)2(SO4)4·18H2O (Kampf et al., Reference Kampf, Plášil, Kasatkin and Marty2015a); however, the sheet in wetherillite is topologically distinct, in that alternate rows of bipyramids are rotated in orientation (Fig. 6).
Fig. 6. The uranyl-sulfate sheets in straβmannite, magnesioleydetite and wetherillite. Note the different orientations of the SO4 tetrahedra for straβmannite and magnesioleydetite, which define different geometrical isomers of topologically identical uranyl-sulfate sheets.
Besides their topologically identical sheets, the structures of magnesioleydetite and straβmannite are also similar in that their interlayer regions contain octahedra and isolated H2O groups that link the sheets to one another only through hydrogen bonding. The straβmannite interlayer region is significantly thicker and contains more than twice as much H2O (Fig. 7).
Fig. 7. The structures of straβmannite and magnesioleydetite viewed down [010]. The unit cells are shown by dashed lines.
Acknowledgements
Igor Pekov and an anonymous reviewer are thanked for their constructive comments on the manuscript. A portion of this study was funded by the John Jago Trelawney Endowment to the Mineral Sciences Department of the Natural History Museum of Los Angeles County. JP acknowledges support of the Czech Science Foundation (project GACR 17-09161S).
Supplementary material
To view supplementary material for this article, please visit https://doi.org/10.1180/mgm.2018.118