Introduction
The internal evolution processes of a pegmatite-forming magma, such as fractionation (Černý and Ercit, Reference Černý and Ercit1985; Mulja et al, Reference Mulja, Williams-Jones, Martin and Wood1996; Novák and Černý, Reference Novák and Černý1998; Martins et al., Reference Martins, Lima and Noronha2009) and crystallisation conditions (Ercit et al., Reference Ercit, Wise and Černý1995; Van Lichtervelde et al., Reference Van Lichtervelde, Beziat and Linnen2007) can be traced using the composition of Ta–Nb–Sn oxides. While many studies have focused on the pegmatite or crystal scale (Lahti, Reference Lahti1987; Splide and Shearer, Reference Splide and Shearer1992; Hanson et al., Reference Hanson, Simmons and Falster1998), new data have begun to emerge in which compositional databases for columbite-group minerals [(Fe,Mn)(Ta,Nb)2O6] are based on a group, or a district and may even cover the continental scale (Alfonso et al., Reference Alfonso, Corbella and Melgarejo1995; Tindle and Breaks, Reference Tindle and Breaks2000; Beurlen, Reference Beurlen, Da Silva, Thomas, Soares and Olivier2008; Melcher et al., Reference Melcher, Graupner, Gäbler, Sitnikova, Henjes-Kunst, Oberthür, Gerdes and Dewaele2013, Reference Melcher, Graupner, Gäbler, Sitnikova, Henjes-Kunst, Oberthür, Gerdes and Dewaele2015, Reference Melcher, Graupner, Gäbler, Sitnikova, Oberthür, Gerdes, Badanina and Chudy2017). In addition, columbite-group minerals have been the subject of many experimental studies (e.g. Černý et al., Reference Černý, Ercit and Wise1992b; Linnen et al., Reference Linnen, Pichavant and Holtz1996; Linnen and Keppler, Reference Linnen and Keppler1997; Linnen, Reference Linnen1998), have been used in conjunction with whole-rock pegmatite geochemistry (Raimbault, Reference Raimbault1998) and have even been used for radiometric age determination (Romer and Lehmann, Reference Romer and Lehmann1995; Smith et al., Reference Smith, Foster, Romer, Tindle, Kelley, Noble, Horstwood and Breaks2004; Baumgartner et al., Reference Baumgartner, Romer and Moritz2006; Van Lichtervelde et al., Reference Van Lichtervelde, Grand'Homme, de Saint-Blanquat, Olivier, Gerdes, Paquette, Melgarejo, Druguet and Alfonso2017).
In the Cape Cross–Uis pegmatite belt of Namibia, numerous granitic pegmatite bodies intrude the metasedimentary and granitic rocks of the Zerrissene Group and Salem-type granites. These pegmatites have been mined sporadically for Li, Sn, Ta and Nb. Fuchsloch et al. (Reference Fuchsloch, Nex and Kinnaird2018) have reported in detail on the field characteristics, mineralogy and whole-rock geochemistry of pegmatites from the Cape Cross–Uis pegmatite belt. These pegmatites show a wide variety of characteristics in terms of intrusion dimensions, complexity, mineralogy, mineralisation and whole-rock geochemistry, throughout the 120 km long by 40 km wide area (Richards, Reference Richards, Anhaeusser and Maske1986; Diehl, Reference Diehl1993; Fuchsloch et al., Reference Fuchsloch, Nex and Kinnaird2018).
Regardless of the emergence of district and continent scale columbite-group mineral compositional databases (Wise et al., Reference Wise, Francis and Černý2012; Melcher, et al., Reference Melcher, Graupner, Gäbler, Sitnikova, Henjes-Kunst, Oberthür, Gerdes and Dewaele2013, Reference Melcher, Graupner, Gäbler, Sitnikova, Henjes-Kunst, Oberthür, Gerdes and Dewaele2015), many pegmatite groups have not yet been studied in detail. The objective of this paper is to present the first detailed compositional study of columbite-group minerals, tapiolite and cassiterite from the Cape Cross–Uis pegmatite belt. High definition back-scattered electron (BSE) images combined with mineral geochemical data are used to evaluate the fractionation trends within the pegmatites at all scales from an individual crystal through the pegmatite body, to a regional pegmatite-belt scale. An evaluation of the degree of fractionation gives insight into the granite–pegmatite relationship, which Fuchsloch et al. (Reference Fuchsloch, Nex and Kinnaird2018) found questionable, suggesting an anatexis model for pegmatite petrogenesis rather than fractionation from a parent granite body. Crystallisation conditions and paragenetic sequences of crystallisation of columbite-group minerals and cassiterite are also assessed by evaluating the heterovalent substitutions in these minerals.
Geological setting
Regional overview
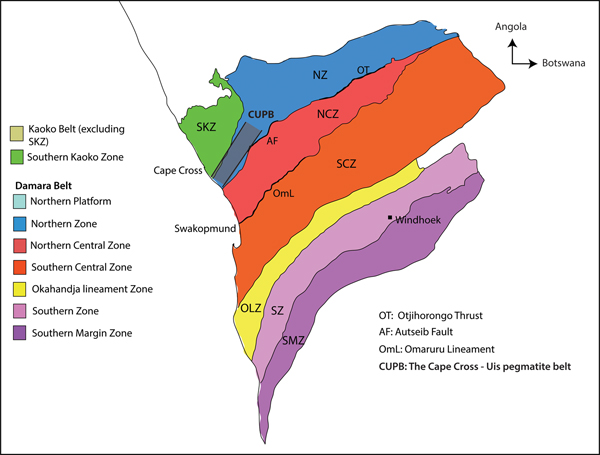
Several rare-element pegmatite belts in Namibia occur within the Damara Belt, which is the northeast-trending intracontinental branch of the Neoproterozoic Pan-African Damara Orogen (See Richards, Reference Richards, Anhaeusser and Maske1986 and Keller et al., Reference Keller, Robles, Pérez and Fontan1999; Fig. 1). The Damara Belt extends from the Atlantic coast near Swakopmund inland towards Botswana and represents a typical ‘Wilson Cycle’ between 750 Ma to 440 Ma, which culminated in the collision of the Kalahari and Congo cratons (Martin and Porada, Reference Martin and Porada1977; Hoffman et al., Reference Hoffman, Hawkins, Isachsen and Bowring1996; Prave, Reference Prave1996; De Kock et al., Reference De Kock, Eglington, Armstrong, Harmer and Walraven2000; Gray et al, Reference Gray, Foster, Goscombe, Passchier and Trouw2006; Miller, Reference Miller, Frimmel, Gaucher, Sial, Halverson and Frimel2009). On the basis of structure, stratigraphy, igneous activity and metamorphic grade, Miller (Reference Miller and Miller1983, Reference Miller and Miller2008 and Reference Miller, Frimmel, Gaucher, Sial, Halverson and Frimel2009) divided the Damara Belt into a number of tectonostratigraphic zones bound by major lineaments and faults (Fig. 1). The Cape Cross–Uis pegmatite belt is located in the Northern Zone of the Damara Belt, which is bound by the Autseib fault and the Otjihorongo thrust (Figs 1, 2).
Fig. 1. The Damara Belt showing the different stratigraphic zones defined by Miller (Reference Miller and Miller2008) (modified after Miller, Reference Miller and Miller1983 and Fuchsloch et al., Reference Fuchsloch, Nex and Kinnaird2018).
Fig. 2. A simplified geological map of the Cape Cross–Uis pegmatite belt, Namibia (modified after Fuchsloch et al., Reference Fuchsloch, Nex and Kinnaird2018). The black squares show the approximate locations of the twenty pegmatite areas that were sampled. Twenty five individual samples were collected from these pegmatites. Pegmatites in the southwest are part of the Strathmore swarm, those in the Karlowa area are part of the Karlowa swarm and those in the northeast are part of the Uis swarm.
During the stages of extension, spreading, subduction and final continental closure, various sedimentary, volcanic and intrusive rocks were formed that represent the magmatism in the polydeformed and polymetamorphic Damara Belt (Prave, Reference Prave1996; Trompette, Reference Trompette1997). Initial Damaran intrusive magmatism was triggered by subduction which occurred between 580 Ma and 545 Ma and is represented by the Goas Suite (Milani et al., Reference Milani, Kinnaird, Lehmann, Naydenov, Saalmann, Frei and Gerdes2015). The final deformation event, D3, has been determined radiometrically to be between 542 and 519 Ma and is responsible largely for the voluminous granodioritic and granitic magmatism during the orogenesis stages of the Damara Belt (Tack et al., Reference Tack, Williams and Bowden2002; Kisters, Reference Kisters2005; Longridge, Reference Longridge2012). Pegmatites form part of this magmatic episode and are ubiquitous within the Damara Belt. They were emplaced within the time period 509–429 Ma (Briqueu et al., Reference Briqueu, Lancelot, Valois and Walgenwitz1980; Longridge, Reference Longridge2012), however, economic mineralisation appears to be exclusively post-tectonic (Wagener, Reference Wagener1989; Diehl, Reference Diehl1993; Kinnaird and Nex, Reference Kinnaird and Nex2007; Miller, Reference Miller and Miller2008; Longridge, Reference Longridge2012; Ashworth, Reference Ashworth2013).
The Cape Cross–Uis pegmatite belt
Pegmatites of the Cape Cross–Uis pegmatite belt intrude metasediments and granites of the Northern Zone, which is dominated by the Amis River Formation of the Zerrissene Group (Fuchsloch et al., Reference Fuchsloch, Nex and Kinnaird2018). Granites are fine- to coarse-grained, porphyritic granodiorites of the Salem type and monzogranites of the Red and Grey granites. Metasedimentary rocks represent a fan fringe deposit and consist typically of biotite schist ± cordierite porphyroblasts and minor metagreywacke and quartzite units (Swart, Reference Swart1992). Metasedimentary rocks show both earlier regional metamorphism to greenschist facies and later thermal metamorphism induced by the intrusion of Salem-type granites (Goscombe et al., Reference Goscombe, Gray and Hand2004). Structural features of the area are characterised by moderately- to steeply-inclined, north–south-striking folds (Macey and Harris, Reference Macey and Harris2006). However, Fuchsloch et al. (Reference Fuchsloch, Nex and Kinnaird2018) show that pegmatites are exclusively post-tectonic and were emplaced into pre-existing north-northeast structural weaknesses in the crust.
The pegmatite belt is divided into three pegmatite swarms known as the Strathmore, Karlowa and Uis swarms (Fig. 2). Diehl (Reference Diehl1993) suggested that increased Sn mineralisation in pegmatites coincides with an increase in the metamorphic grade to the west. Fuchsloch et al. (Reference Fuchsloch, Nex and Kinnaird2018) found no evidence for the westward increase of the mineralisation grade but instead describes different features in the swarms. The authors found that the Uis pegmatites show the highest cassiterite abundances whereas the Karlowa pegmatites are Li-Nb-Ta rich with spodumene occurring as the dominant Li mineral. Furthermore, the Strathmore pegmatites show enrichment in Li, Ta, Nb, Sn and Be with petalite occurring as the dominant Li mineral. Strathmore is the only swarm in which complex mineralogically zoned pegmatites occur, for example, the Petalite pegmatite (Fig. 2).
Pegmatites in the Cape Cross–Uis pegmatite belt are classified as LCT type (lithium, caesium and tantalum) based on the classification of Černý and Ercit (Reference Černý and Ercit2005). Some pegmatites show the hallmarks of LCT-type pegmatites whereas others, such as the intragranitic garnet–tourmaline pegmatites, show intermediate characteristics between NYF (niobium, yttrium and fluorine) and LCT pegmatite types. Shortcomings in the current classification schemes have led authors such as Fuchsloch et al. (Reference Fuchsloch, Nex and Kinnaird2018) to subdivide the pegmatites of the Cape Cross–Uis pegmatite belt into three separate groups based on geochemical and mineralogical characteristics: (1) the barren to Nb–Ta–Sn-mineralised, unzoned pegmatites; (2) garnet–tourmaline, intragranitic, crudely zoned pegmatites; and (3) zoned and unzoned Li-mineralised pegmatites. The petrology and characteristics of the pegmatite groups are well documented (Richards, Reference Richards, Anhaeusser and Maske1986; Wagener, Reference Wagener1989; Diehl, Reference Diehl1993; Ashworth, Reference Ashworth2013; Fuchsloch et al., Reference Fuchsloch, Nex and Kinnaird2018). Table 1 assigns the pegmatites studied to these different groups. The bulk mineralogical composition of the pegmatites is granitic, with quartz, muscovite, albite and microcline as essential minerals. Primary accessory mineralogy varies between the pegmatite groups and includes columbite-group minerals cassiterite, tapiolite, magnetite, ilmenite, tourmaline, apatite, beryl, petalite, lepidolite, spodumene, zircon and monazite. Secondary mineralogy includes cleavelandite, hectorite, eucryptite and alteration zones of muscovite, quartz and albite.
Table 1. Ta–Nb and Sn oxides and characteristics of pegmatites studied in the Cape Cross–Uis pegmatite belt (shown in Fig. 1).
Grt–Tur = garnet–tourmaline pegmatite type; Ta–Nb–Sn indicates the unzoned Ta–Nb–Sn mineralised pegmatites; Li pegmatites indicate the unzoned and zoned Li-mineralised pegmatites.
FeC = columbite-(Fe); FeT = tantalite-(Fe); MnC = columbite-(Mn); MnT = tantalite-(Mn); Cst = cassiterite; Tap = tapiolite; Wdg = wodginite; Ix = ixiolite; CGM = columbite-group minerals.
Various authors, such as Richards (Reference Richards, Anhaeusser and Maske1986), suggest that pegmatites of the Damara Belt are associated with I- and S-type granitic and granodioritic intrusions. However, Fuchsloch et al. (Reference Fuchsloch, Nex and Kinnaird2018) questioned this relationship and showed, using the spatial distribution of pegmatites of the Cape Cross–Uis pegmatite belt together with whole-rock geochemistry, that a parent–daughter relationship between granites and pegmatite is unlikely. Fuchsloch et al. (Reference Fuchsloch, Nex and Kinnaird2018) favours an anatexis model for pegmatite petrogenesis. Rb–Sr radiometric age determination of the Uis pegmatites is 496 ± 30 Ma and 486 ± 8 Ma by Haack and Gohn (Reference Haack and Gohn1988) and Diehl (Reference Diehl1993), respectively. Richards (Reference Richards, Anhaeusser and Maske1986), Wagener (Reference Wagener1989), Diehl (Reference Diehl1993) and Singh (Reference Singh2007, Reference Singh2008) agreed that mineralisation of elements such as Sn was controlled by assimilation of country rock. However, Fuchsloch et al. (Reference Fuchsloch, Nex and Kinnaird2018) shows, using field evidence and whole-rock geochemistry, that assimilation was not likely to have been the cause of mineralisation and that internal pegmatite fractionation was the dominant process leading to Nb, Ta, Cs and Sn enrichment.
Late-stage greisenised and albitised zones contain Ta–Nb and Sn oxides in abundance although they also occur in magmatic zones with an equigranular magmatic texture (Table 1; Fuchsloch et al., Reference Fuchsloch, Nex and Kinnaird2018). These alteration zones which have been shown to have the highest levels of fractionation in terms of whole-rock geochemistry, occur sporadically, or in discrete zones, within pegmatites and are not restricted to a pegmatite type. Columbite-group minerals occur in all the different pegmatite types in the Cape Cross–Uis pegmatite belt but to a lesser extent in the garnet–tourmaline pegmatites as only one such pegmatite was found to have columbite-group minerals (Fuchsloch et al., Reference Fuchsloch, Nex and Kinnaird2018). Cassiterite occurs sporadically in different pegmatites, is completely absent from the garnet–tourmaline type and is abundant in the Uis swarm. Previous studies (Melcher et al., Reference Melcher, Graupner, Gäbler, Sitnikova, Henjes-Kunst, Oberthür, Gerdes and Dewaele2013, Reference Melcher, Graupner, Gäbler, Sitnikova, Henjes-Kunst, Oberthür, Gerdes and Dewaele2015) and this present investigation have reported the occurrence of other Ta–Nb oxides such as tapiolite, ixiolite and wodginite, on the basis of compositions obtained by microprobe. Melcher et al. (Reference Melcher, Graupner, Gäbler, Sitnikova, Henjes-Kunst, Oberthür, Gerdes and Dewaele2013, Reference Melcher, Graupner, Gäbler, Sitnikova, Henjes-Kunst, Oberthür, Gerdes and Dewaele2015) suggests that the Uis pegmatites and the C1 pegmatite (Fig. 2) show concomitant Fe–Mn and Nb–Ta fractionation trends (increasing Ta/(Ta + Nb) and Mn/(Mn + Fe) in a 1 to 1 ratio) in columbite-group minerals, which is typical of the complex spodumene pegmatite type. However, that study is on a continental scale and lacks the detailed investigation of this report.
Sampling and analytical techniques
Twenty-five different pegmatite bodies were sampled in 20 different pegmatite locations in the Cape Cross–Uis pegmatite belt (Fig. 2). Although the pegmatites are predominantly unzoned (Fuchsloch et al., Reference Fuchsloch, Nex and Kinnaird2018), samples were selected from greisenised zones, albitised zones and magmatic zones with a magmatic equigranular texture. Each sample was crushed, milled and sieved to <500 µm grain size and then processed on a Wilfley table. Samples were further processed using a Franz magnetic separator. These processes extracted the heavy and magnetic mineral populations that were then mounted into resin blocks for electron microprobe analysis. All samples yielded columbite-group minerals ± tapiolite, whereas cassiterite was only recovered in 15 samples (Table 1).
Five hundred and thirty five quantitative compositional analyses for columbite group minerals, tapiolite and cassiterite were obtained using a JEOL JXA-8230 electron micro-analyser with four wavelength dispersive spectrometers at Rhodes University. The electron beam was generated by a tungsten cathode at 30 nA current with a 1 µm beam size. X-ray counts for Mg, Fe, Ca, Mn, Ti and Sc were measured on Kα peaks, Sn, W and Nb on Lα peaks and U and Ta on Mα peaks. Counting times were 10 s on the peak and 10 s total on the background, for all elements. Standards used were: Sn – metallic Sn; Ta – metallic Ta; U – metallic U; Ca/W – scheelite; Mg/Fe – chromite; Mn – rhodonite; Nb – metallic Nb; Ti – rutile; and Sc – metallic Sc. Calibration acquisitions were peaked on the standards whilst unknown acquisitions were peaked on the samples before each point analysis. The data were collected with JEOL software. An automated ZAF matrix algorithm was applied to correct for differential matrix affects.
Individual, complexly zoned, tapiolite crystals and cassiterite crystals were analysed using a Cameca SX100 electron microprobe at the Natural History Museum, London. Eighty seven points on 15 tapiolite crystals and 24 points on five cassiterite crystals for samples 3.1-2 and 6-1, respectively, (Table 1) were analysed. A current of 20 nA was used with an accelerating potential of 20 keV, a beam size of 1 µm and various counting times ranging from 10–60 s. Counts for Na, Mg, Al, Si, Ca, Ti, Mn, Fe and Sc were measured on Kα peaks, Nb, Sn, Zr, Ta, Hf and W on Lα peaks and U and Th on Mα peaks. Standards used were: Na – jadeite; Mg – forsterite; Al – corundum; Si/Ca – wollastonite; Nb –metallic Nb; Sn – cassiterite; Ti – rutile; Mn – manganese titanium oxide; Fe – haematite; Zr – zircon; Ta –metallic Ta; Hf – metallic Hf; Th – monazite; U – uranium oxide; W – pure tungsten; and Sc – metallic Sc. The data were collected on Cameca software and a ZAF matrix algorithm was used to correct for differential matrix affects. Oxygen was calculated using stoichiometry and the atoms per formula unit (apfu) were calculated based on 3 cations and 6 oxygens pfu for all data collected.
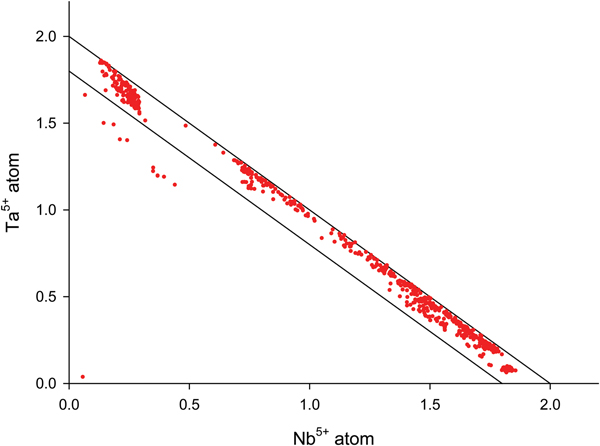
The data collected were screened to ensure that only columbite-group minerals, tapiolite and cassiterite were evaluated, as wodginite and ixiolite are very minor constituents or are completely absent from most pegmatites and therefore are beyond the scope of this study. The data were plotted on a Nb vs. Ta diagram (Fig. 3) where ideal columbite-group mineral and tapiolite compositions should plot within a boundary between Nb + Ta = 2.0 apfu and Nb + Ta = 1.8 apfu. Ideal compositions refer to the correct stoichiometric proportions of Nb to Ta in a given crystal that constitutes the specific crystal being of the columbite-group minerals (Neiva, Reference Neiva1996). Ten data points plotted below this boundary and are considered to belong to the wodginite and ixiolite family as defined by Neiva (Reference Neiva1996). Table 1 shows the Ta–Nb and Sn oxide mineralogy of each pegmatite.
Fig. 3. The atomic proportions of Ta and Nb of the columbite-group minerals and tapiolite from the Cape Cross–Uis pegmatite belt. Points that plot below the boundary are considered to be of the wodginite and ixiolite family. Points within the boundary are considered to be of ideal columbite-group mineral compositions where Ta and Nb are in the correct proportions to constitute the columbite-group mineral (Neiva, Reference Neiva1996; Tindle and Breaks, Reference Tindle and Breaks2000).
Results
Columbite-group minerals and cassiterite are the dominant Ta–Nb–Sn-bearing phases in the Cape Cross–Uis pegmatite belt. Subordinate tapiolite, wodginite and ixiolite occur but have not been observed macroscopically and have restricted distributions occurring only in highly altered zones of the pegmatites. Wodginite and ixiolite were only identified from their composition as analysed by microprobe, whereas tapiolite has been observed microscopically, only as a secondary phase in all samples except in sample 3.1-2 (Table 1). Although many samples include Ta–Nb–Sn-bearing phases in magmatic zones with a distinct equigranular texture, they are more abundant in greisenised or albitised zones within the pegmatites. These altered zones do not indicate that the pegmatite itself is zoned; only the Petalite pegmatite shows a true mineralogical zonation (Fig. 2; Table 1). The greisens consist essentially of new or recrystallised quartz and muscovite, with accessory columbite-group minerals, tapiolite and cassiterite. They were formed by late-stage pegmatitic fluids and show varying degrees of alteration. They occur as patchy networks, layered units, or in the case of the Petalite pegmatite, as large metre-scale zones surrounding the quartz core of the pegmatite. Their sizes range from several centimetre patches, occurring sporadically in pegmatites, to metre-scale lensoidal or layered units. Albitised zones share similar features to greisens but consist of a homogeneous mass of saccharoidal albite. Ta–Nb–Sn-bearing phases show varying grain sizes in greisens but are mostly macroscopic whereas albitised zones rarely display distinguishable grains.
Most Ta–Nb and Sn oxide studies (e.g. Černý et al., Reference Černý, Chapman, Ferreira and Smeds2004) are related to complexly zoned pegmatites, each zone having uniquely occurring Ta–Nb–Sn-bearing phases with distinct compositions. Although only one pegmatite shows true pegmatite zonation in this study, in other examples, a comparison between magmatic and altered zones yields a similar distinction in characteristics and mineralogy of Ta–Nb–Sn oxides. The whole-rock geochemical and mineralogical differences in these zones have already been characterised by Fuchsloch et al. (Reference Fuchsloch, Nex and Kinnaird2018).
Columbite-group minerals have the general formula of AB 2O6 where the A site is occupied mostly by Fe and Mn and the B site mostly by Ta and Nb. The columbite-group minerals comprise four end-members all with an orthorhombic crystal structure: columbite-(Fe) [FeNb2O6], tantalite-(Fe) [(Fe > Mn)(Ta > Nb)2O6], columbite-(Mn) [MnNb2O6] and tantalite-(Mn) [MnTa2O6]. Tantalite-(Fe) only requires Fe > Mn and Ta > Nb as the composition FeTa2O6 belongs to the tetragonal tapiolite series and does not exist in the orthorhombic crystal structure of columbite-group minerals (Černý et al., Reference Černý, Ercit and Wise1992b). The overall proportions of Ta to Nb and Fe to Mn [Ta/(Ta + Nb), Ta#; Mn/(Mn + Fe), Mn#] in the columbite quadrilateral are used to show fractionation trends within pegmatite bodies where various different trends may be observed and linked to certain petrochemical processes and abundances (e.g. Černý and Ercit, Reference Černý and Ercit1985; Tindle and Breaks, Reference Tindle and Breaks2000). An increase in Ta# in columbite-group minerals, and in tapiolite and cassiterite is widely accepted as an indication of higher levels of fractionation whereas changes in the Mn# are debated (see discussion in Van Lichtervelde et al., Reference Van Lichtervelde, Beziat and Linnen2007). Columbite-group minerals, tapiolite and cassiterite compositional data were used to evaluate fractionation trends within pegmatites of the Cape Cross–Uis pegmatite belt. Element substitution by Ti, Ca, W, Mg and Sn was also assessed. The data were then used to compare compositions from different pegmatite groups and swarms in the Cape Cross–Uis pegmatite belt. The shape of certain fractionation trends in the columbite quadrilateral for columbite-group minerals have also been used as a classification tool (Černý and Ercit, Reference Černý, Ercit, Moller, Černý and Saupe1989).
Columbite-group minerals and tapiolite
Occurrence and internal structure
Columbite-group minerals in the Cape Cross–Uis pegmatite belt occur in various morphologies depending on their location within a given pegmatite and are the most abundant Ta- and Nb-bearing phases. The most common occurrence of columbite-group minerals is in the form of platy striated black crystals with a metallic lustre which can either occur as amalgamated laths, several centimetres long or as single plates with smaller grain sizes between 100 and 500 µm. The largest amalgamated crystals occur in the unaltered magmatic zones of the pegmatite whereas the equigranular plates occur mostly in the alteration zones. Large tabular crystals are rare but have also been noted. The columbite-group minerals occur uniformly throughout the Cape Cross–Uis pegmatite belt and no swarm in particular favours higher abundances. The most common end-member in the Cape Cross–Uis pegmatite belt is columbite-(Fe) followed by tantalite-(Fe). Manganese end-members are rare but are present in several samples, particularly in greisens (Table 1). Tapiolite forms exclusively anhedral crystals up to 0.5 mm in size and similarly to manganese end-members are rare, with only one sample having abundant tapiolite (Sample 3.1-2; Table 1).
The internal structure of columbite-group minerals and tapiolite shows multiple, singular and/or complex zonation patterns (Fig. 4). The columbite-group minerals are sometimes associated with cassiterite either enclosing cassiterite grains or co-occurring with cassiterite (Fig. 4a). The complexity of zonation in a single crystal corresponds to the degree of alteration in the pegmatite zone in which the crystal occurs. The most complex-zoned crystals occur in the latest-stage zones. Zonation patterns in columbite-group minerals and tapiolite have been compared to typical feldspar zoning of which there are three dominant types (Lahti, Reference Lahti1987).
Fig. 4. Back-scattered electron images of various columbite-group minerals and cassiterite crystals. (a) Oscillatory-zoned columbite-group mineral enclosing a euhedral cassiterite grain showing a resorption texture along the margins of the cassiterite crystal. (b) Progressively-zoned columbite-group mineral with later-stage patchy zonation along the rim and centre zone. (c) Platy progressively-zoned columbite-group mineral. (d) Oscillatory-zoned columbite-group minerals with resorption textures in the large centre zones. (e) Multiple zonation of a columbite-group mineral showing later resorption of the rim and renewed oscillatory zonation. (f) Complexly-zoned columbite-group mineral showing patchy zonation.
The most common type of zonation seen in the Cape Cross–Uis pegmatite belt is a progressive zonation whereby crystals, from core to rim, have a mono-directional compositional variation that can either be in a single direction (Fig. 4b) or concentrically arranged (Fig. 4c). Each subsequent zone that crystallised can show either a progressive increase in Ta or Nb, from core to rim. Subsequently crystallised zones may not show alternating increases and decreases of Ta or Nb, which would be considered oscillatory zonation. Within each individual zone (e.g. Fig. 4b has four individual zones), slight changes in the BSE images brightness show that progressive zonation may occur within individual zones. Elevated levels of brightness in the BSE are indicative of higher Ta and lower Nb proportions in the crystal structure. In comparison to oscillatory zonation, crystals such as illustrated in Fig. 4b and c are still considered to be progressively zoned as there is an overall increase in the Ta proportions from core to rim, even though individual zones also show changes in brightness and therefore composition.
Oscillatory zonation is a common feature of columbite-group minerals and tapiolite and is generally the typical abundant zonation within a given pegmatite (e.g. Zhang et al., Reference Zhang, Wang, Hu, Zhang, Zhu and Chen2004). However, oscillatory zonation, which is not as widespread in the Cape Cross–Uis pegmatite belt as progressive zonation, occurs equally in columbite-group minerals in both magmatic and altered zones. Oscillatory zonation occurs as repeating, alternating zones of different Ta and Nb compositions (Fig. 4d). As with progressively-zoned crystals, each specific zone may also show individual progressive zonation (Fig. 4e). The width of the zones in the oscillatory-zoned crystals may vary widely. In the case of Fig. 4d, zones at the core have an average width of several μm and then a larger 40 µm zone occurs, followed by extremely thin banded zones. Tapiolite shows the most prominent oscillatory zonation (Fig. 5). Thin, less than a micrometre in thickness, zones occur as banded layers that can either be concentric (Fig. 5a,b,d) or unidirectional (Fig. 5c) across the specific crystal face cross section. Zones similarly show varying widths with either slight changes in BSE brightness or more notable changes.
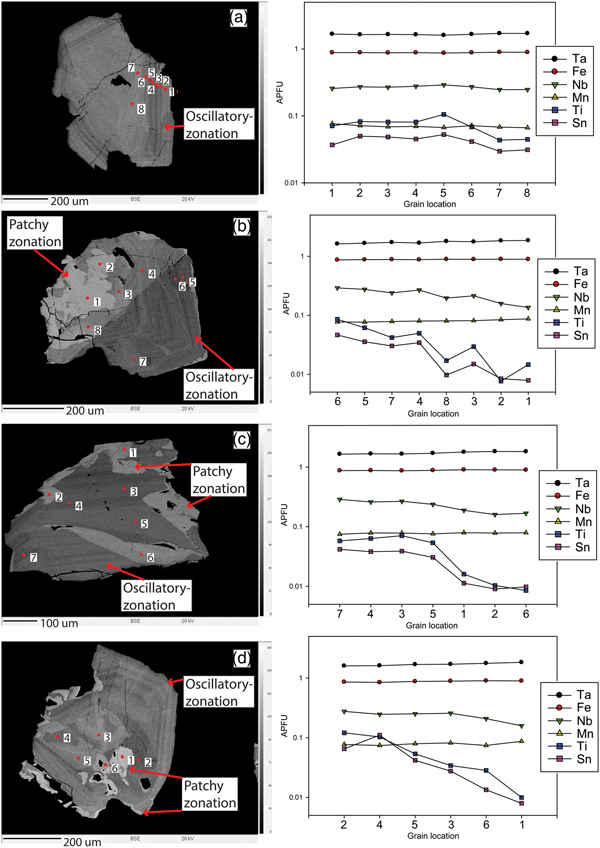
Fig. 5. Back-scattered electron images of individual tapiolite grains from sample 3.1-2 with their corresponding analyses of elements Ta, Fe, Nb, Mn, Ti and Sn at different points in the grains. Note that the numbers in the corresponding graphs (x axis) are ordered from darkest zones to lightest zones and not in ascending order. (a) Oscillatory-zone tapiolite crystal. (b) Twinned complexly-zoned tapiolite crystal. (c-d) Complexly-zoned tapiolite crystals.
Abundant patchy zonation is typical of samples from altered zones. Patchy zonation may occur as resorption textures that have replaced primary grains/zones with later secondary undulating or irregularly shaped grains/rims (Fig. 4a,d,e,f). Patchy zonation has no particular affinity for grain cores or rims and is superimposed on either oscillatory or progressive zonation or both, giving the crystals complex zonation patterns (Fig. 4b,e,f). Patchy zonation generally shows the highest BSE brightness in all crystals, having the highest Ta contents, but may also occur as darker zones which appear to intrude a previously crystallised zone (Fig. 4d,e). Tapiolite occurs exclusively as patchy zones except in sample 3.1-2 (Fig. 5; all crystals are tapiolite in this figure).
Mineral compositions
Representative compositions of columbite-group minerals and tapiolite are given in Table 2. Columbite-group minerals display an extremely wide range of Ta2O5 and Nb2O5 contents from 1.8–82.3 and 1.8–72.9 wt.% respectively. FeO and MnO show similar broad ranges, 0.9–16.4 and 0.5–16.1 wt.%, respectively, however, most compositions are rich in Fe compared to Mn and show an average of 12.4 wt.% FeO and 5.1 wt.% MnO. SnO2 and TiO2 contents in general average ~0.9 wt.% but may exceed 4 wt.% in rare cases. Scandium, U, Ca and W show low to non-detectable levels that do not generally exceed 0.5 wt.%, however, it is notable that columbite-group minerals in the garnet–tourmaline pegmatites have WO3 contents up to 4.0 wt.%. Anomalous elevated minor-element substitutions in columbite-group minerals are not unique to specific pegmatite groups, with the exception of W in garnet–tourmaline pegmatites. However, the columbite-(Fe) end-member, where present, shows the highest abundance of minor elements compared to the other end-members. The total atoms per formula unit (apfu) for columbite-group minerals and tapiolite cluster at 3 units for unaltered samples, however, greisenised samples show slightly elevated values of 3.1 apfu. Tapiolite shows less variation with respect to Ta2O5 and Nb2O5, having averages of 77.2 and 6.7 wt.% respectively. FeO contents cluster around 13.0 wt.% whereas MnO is much lower at an average of 1.0 wt.%. SnO2 and TiO2 are elevated compared to columbite-group minerals, commonly reaching 4.4 and 2.5 wt.% respectively. Magnesium, Ca, U, Sc and W were not detectable in tapiolite.
Table 2. Representative compositions of columbite-group minerals and tapiolite from the Cape Cross–Uis pegmatite belt.
FeC – columbite-(Fe); FeT – tantalite-(Fe); MnC – columbite-(Mn); MnT – tantalite-(Mn); Cas – cassiterite; Tap – tapiolite; n.d. – not detected; Alb – albitised.
Intra-crystal tapiolite compositional variation
Sample 3.1-2 is the only one in the Cape Cross–Uis pegmatite belt that primary magmatic textures, such as concentric oscillatory-zoning in subhedral grains, were observed in individual tapiolite crystals (Fig. 5). However, multiple patchy zonation and resorption textures overprint oscillatory zonation. Individual crystals show the typical overall increase in Ta with respect to Nb, from the core outwards, regardless of alternating changes in Nb and Ta in oscillatory zonation (Fig. 5). Little change is observed in the Fe and Mn content through individual crystals (Fig. 5). The highest abundance of Ta (greatest BSE brightness) occurs in patchy zonation regardless of whether the patch is at the core or on the rim. Sn and Ti show that, on a single crystal-scale, as Ta is enriched, minor-element substitution decreases (Fig. 5a,b,c). There is also an apparent ‘jump’ in the decrease in Ti and Sn from the oscillatory zones to the patchy zones (Fig. 5b,c). These discrete tapiolite grains show that, on an individual crystal scale and between the magmatic and late-stage patchy zonation, minor-element trends are similar to those of the samples seen in Fig. 6a–d. In addition, Fig. 5a–c shows that there is a decrease in the Nb contents from oscillatory to patchy zonation indicating an increase in the Ta/(Ta + Nb) ratios from different textural zones. Calculations of the Ta# in both oscillatory and patchy zonation show that patchy zonation has a Ta# 0.05 to 0.1 greater than oscillatory zonation.
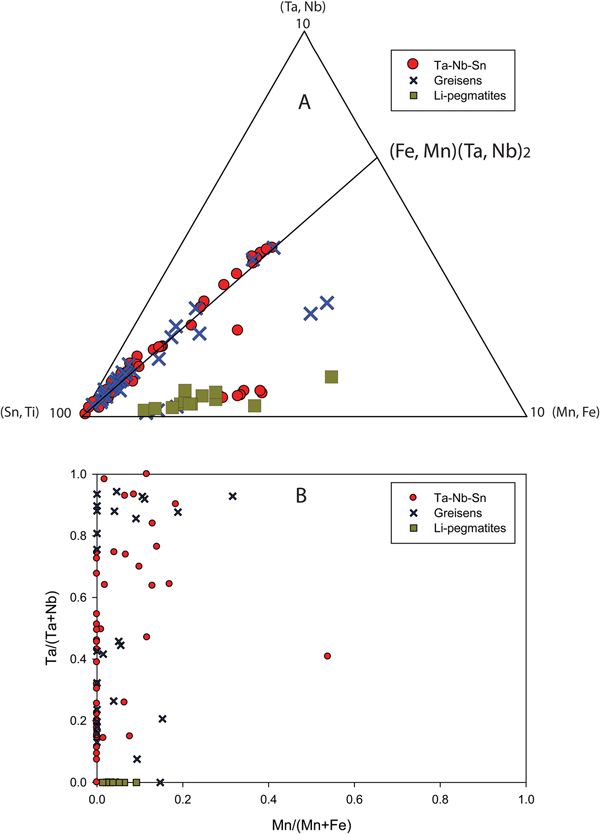
Fig. 6. Compositional variation plots of columbite-group minerals and tapiolite (data are in apfu; TAP = tapiolite; CGM = columbite-group minerals). (a) Sn and Ti values in tapiolite plotted against Ta# (Ta/(Ta + Nb)). (b) Sn and Ti values in columbite-group minerals plotted against Ta#. (c) W in both tapiolite and columbite-group minerals plotted against Ta#. (d) Ca and Mg in both tapiolite and columbite-group minerals plotted against Ta#. Each plot (a–d) groups elements of the same charge whereas tapiolite and columbite-group minerals are separated by a dashed line in plots c and d. (e) columbite-group minerals and tapiolite in a section of the (Sn + Ti) – (Mn + Fe) – (Ta + Nb) triangle. The diagonal line connecting to (Mn, Fe)(Ta, Nb)2 indicates ideal substitution whereby the ratio of (Mn, Fe) to (Ta, Nb), or A site to B site, is 1:2. Points falling below this line indicate B-site deficiency in the crystal structure of columbite-group minerals, tapiolite or cassiterite.
Columbite-group minerals and tapiolite mineral composition
When the minor elements, Ti, Sn, Ca, Mg and W are plotted against Ta# for the entire dataset, weak hyperbolic trends are seen (Fig. 6a–d). Figure 6a displays this trend the best where early-crystallised (lower ranges of Ta#) tapiolite has high concentrations of Sn and Ti and later growth gradually becomes depleted in Sn and Ti with increasing Ta#. These trends are less defined for the entire dataset in Fig. 6b–d, however, by plotting each sample separately this trend is clear and ubiquitous for all samples. Essentially there is an overall decrease in minor-element heterovalent substitution in columbite-group minerals and tapiolite with increasing Ta#. Tapiolite compositions are different compared to columbite-group minerals in that they have elevated Sn and Ti concentrations, which is why individual plots for tapiolite and columbite-group minerals were used in Figs 6a and b. Furthermore, tapiolite data shows low contents of W, Mg and Ca compared to columbite-group minerals at lower Ta# values. This is an interesting observation as zonation patterns and Ta# show columbite-group minerals as an early-stage Ta–Nb oxide whereas tapiolite is mostly observed with patchy zonation, appearing to be a late-stage Ta–Nb oxide. If we consider a transition from crystallising only columbite-group minerals, to columbite-group minerals and tapiolite, there is a marked increase in the Ti and Sn contents in newly crystallised tapiolite, followed by a repeat of the trend of decreasing minor-element heterovalent substitution with increasing Ta#. This ‘jump’ is absent for other minor elements, such as W, Ca and Mg, which remain at low concentrations in tapiolite (Fig. 6c,d).
Columbite-group minerals and tapiolite generally conform to an ideal Fe-Mn and Ta–Nb substitution with a 1:2 ratio of the A site to the B site (Fig. 6e). Ideal substitution is shown by the (Mn, Fe) = 2(Ta, Nb) tie line in Fig. 6e. Deviations from the ideal substitution are found dominantly in columbite-group minerals and tapiolite from greisen samples where there is a notable deficiency in the B-site cations, Ta and Nb, as these samples plot below the ideal substitution line (Fig. 6e). The columbite-group minerals in Li pegmatites show a similar distinct depletion in the B-site cations, Ta and Nb, being Fe-Mn enriched relative to Ta and Nb.
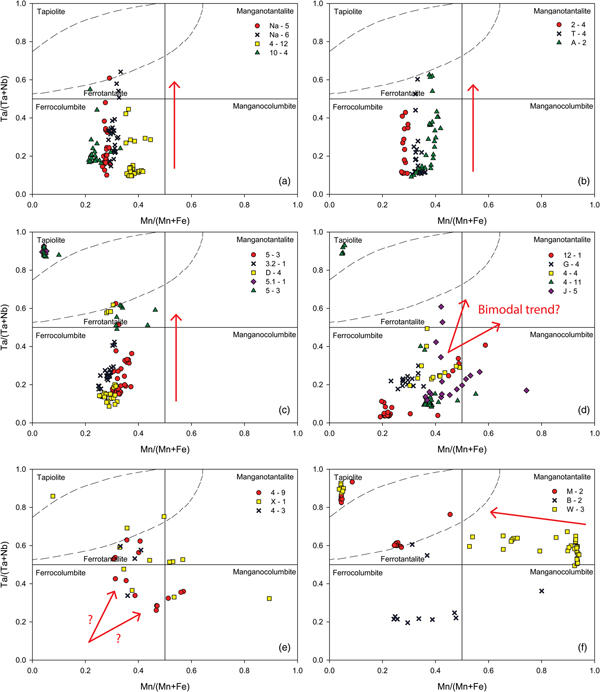
Columbite-group mineral compositions in most samples plot in a linear fashion from the columbite-(Fe) field into the tantalite-(Fe) field with increasing Ta# and little or no change in the Mn# in the columbite quadrilateral (Fig. 7a–c). Compositions terminate against the tapiolite gap described in Černý et al. (Reference Černý, Ercit and Wise1992b). The tapiolite gap is a compositional gap between the tetragonal tapiolite field and orthorhombic columbite-group mineral field (Fig. 7) where it is not uncommon for some data to plot on or near the boundary of the field. Some samples show that co-occurring tapiolite is present to give a complete trend: columbite-(Fe) → tantalite-(Fe) → tantalite-(Fe) + tapiolite (Fig. 7c). As Ta# is an indication of fractionation, these samples that have co-occurring tapiolite are the most fractionated. Data points that plot in the tapiolite field are notably Fe rich and co-occurring tantalite-(Fe) and tapiolite show moderate gradient (1:1) lines linking the two Ta–Nb phases. Figure 7d shows that some samples have columbite-group minerals which appear to have a bimodal fractionation trend, with initial compositions clustering in the columbite-(Fe) field and then proceeding both towards the tantalite-(Fe) field with increasing Ta# and towards the columbite-(Mn) field with equal increases in Ta# and Mn#. Sample 4-9, Fig. 7e, also possibly shows this bimodal trend. It is also notable in Fig. 7d, Sample 12-1, that the columbite-group minerals of the garnet–tourmaline pegmatite have the lowest Ta# in the dataset and show a distinct concomitant trend, starting in the columbite-(Fe) field with equal increases in Ta# and Mn# into the columbite-(Mn) field. Other samples (Fig. 7e,f) show a scattering of data where no discernible trends are observed, with the exception of sample W-3 (Fig. 7f) that possibly evolves from the tantalite-(Mn) field towards the tantalite-(Fe) field. It appears that data with the lowest Ta# in sample W-3 have the highest Mn#, subsequent data being more scattered at higher Ta# and lower Mn#.
Fig. 7. Columbite-group minerals and tapiolite compositions for individual samples in the columbite quadrilateral (ferro and mangano used as prefixes for the suffixes -(Fe) and -(Mn), respectively). The samples are grouped roughly according to the trend they display which is shown by the red arrows in each plot. (a–c) Typical trends subparallel to the Ta/(Ta + Nb) axis, defined by increasing Ta# with little variation in the Mn#. (d) Apparent bimodal fractionation trends in samples J-5, 4-4 and 4-11. Sample 12-1 shows a concomitant trend of equal increases in the Ta# and Mn# whereas sample G-4 clusters in the columbite-(Fe) field with no discernible trend. (e,f) Columbite-group minerals and tapiolite that display uncharacteristic behaviour. Sample 4-9 potentially shows a bimodal trend with missing data in the columbite-(Fe) field (indicated by red arrows). Sample W-3 potentially shows a trend of decreasing Mn# with slight increases in the Ta# (indicated by the red arrow in f). Other data is scattered. The tapiolite immiscibility gap is shown in the figures as dashed lines in the tantalite-(Fe) field (top left).
On a regional pegmatite belt scale when comparing data from all samples, columbite-group minerals show an overall trend in the columbite-group minerals quadrilateral subparallel to the Ta/(Ta + Nb) axis due to increasing Ta# with little change in the Mn# (Fig. 8). Columbite-group minerals and tapiolite from greisen samples display the highest Ta# in the dataset with most tapiolite occurring in greisenised samples (Fig. 8). Similarly, only greisens show compositions that plot in the tantalite-(Mn) field. Lithium pegmatites also show high Ta# plotting well within the tantalite-(Fe) and tapiolite field with only one datum plotting in the columbite-(Fe) field. Nb–Ta–Sn pegmatite types show a wide variety of compositions, having intermediate Ta# and Mn# values compared to the other pegmatite types and altered zones.
Fig. 8. Combined compositional data of columbite-group minerals and tapiolite from all samples in the Cape Cross–Uis pegmatite belt. Samples are plotted based on the pegmatite group to which they belong (Table 1) and whether a sample is an altered greisenised zone (blue crosses). Ferro and mangano used as prefixes for the suffixes -(Fe) and -(Mn), respectively.
Cassiterite
Occurrence and internal structure
In the Cape Cross–Uis pegmatite belt cassiterite has been observed in fewer pegmatites than columbite-group minerals, although it has a greater overall abundance in terms of tonnage. The Uis swarm hosts most of the cassiterite in the area possibly reflecting the larger dimensions of the pegmatites in the swarm and the increased degree of greisenisation compared to other swarms (Fuchsloch et al., Reference Fuchsloch, Nex and Kinnaird2018). Cassiterite generally occurs as black anhedral- to- subhedral grains ranging from rectangular 5 cm x 1 cm crystals to fine-grained 0.5–1 mm grains in albitised zones. Rare euhedral, bypyramidal and sub-transparent crystals up to a size of 1.3 cm along the a axis also occur. Local artisanal miners have also identified ‘red tin’ which has a red hue and rusty texture and occurs mostly as 1–2 mm equidimensional grains.
Microscopically cassiterite is generally homogeneous and rarely shows any zonation on BSE imagery (Fig. 4a). Cassiterite occasionally co-occurs in association with columbite-group minerals in unaltered magmatic assemblages either adjacent to or as individual crystals. In altered zones, columbite-group minerals are observed as epitaxial overgrowths around cassiterite crystals where the rims of the cassiterite show resorption textures (Fig. 4a). A feature in the Uis swarm is the occurrence of oscillatory-zoned, columbite-group mineral inclusions within cassiterite. Some inclusions show resorption textures but there is no indication of the columbite-group minerals having been derived from exsolution in cassiterite.
Cassiterite mineral composition
Cassiterite shows little to moderate variation in its composition, with most crystals consisting of almost pure SnO2 (Table 3). Some homogenous grains with no associated columbite-group mineral inclusions exhibit elevated Ta2O5 contents of ~5 wt.% (Table 3; Sample Na-5 and J-5). Generally, it is the cassiterite from greisens that show slightly higher Ta2O5 contents between 1 and 3 wt.%. No distinguishable differences were observed between cassiterite from different pegmatite groups except for the absence of Ta2O5 in cassiterite from the Li pegmatites. Although cassiterite typically contains 0.16–1.83 wt.% FeO, there is no specific variation between pegmatite groups. Nb2O5 contents are generally <0.5 wt.%, however, some greisen samples contain cassiterite with Nb2O5 contents >2 wt.%. Mn is notably present in low concentrations together with Sc, U, W, Ca and Ti.
Table 3. Representative compositions of cassiterite from the Cape Cross–Uis pegmatite belt.
n.d. – not detected
In a (Ta,Nb) – (Sn,Ti) – (Mn,Fe) plot, cassiterite compositions mostly show ideal compositional variations along a line defined by the substitution reaction (Fe, Mn)2+ + 2(Ta, Nb)5+ = 3(Sn,Ti)4+ (Fig. 9a). This line indicates that the proportions of Fe–Mn and Ta–Nb conform to the ideal ratio of 1:2. However, cassiterite from Li pegmatites plot below the ideal substitution line indicating (Ta, Nb)5+ depletion with respect to (Fe, Mn)2+ and show the lowest Ta#. Some cassiterite from greisen samples also plot below the ideal substitution line whereas none of the compositions plot significantly above it. The Ta# of cassiterite in the dataset shows a wide variety of values whereas the Mn# is mostly below 0.2 (Fig. 9b). No specific trend is observed in a plot of Ta# vs. Mn#, however, data with Ta# >0.6 appear to show slightly higher Mn# values.
Fig. 9. Compositional characteristics and trends in cassiterite from the Cape Cross–Uis pegmatite belt. (a) (Sn,Ti) – (Ta,Nb) – (Fe,Mn) triangular plot showing the solid solution with columbite-group minerals (ideally with rutile structured tapiolite). The line marked (Fe,Mn)(Ta,Nb)2 represents the ideal substitution. This graph shows the detail of the bottom left portion of the triangular diagram where (Sn,Ti) = 100% and (Ta,Nb) and (Mn,Fe) up to 10%. (b) Cassiterite compositions plotted in the columbite quadrilateral
Discussion
The approach we take in this study is to characterise three main factors that occur during the paragenesis of the pegmatites and Ta–Nb and Sn oxides: (1) the minor-element evolution in Ta–Nb oxides; (2) the fractional crystallisation evolution; and (3) the potential of a phase transition from a magmatic to an exsolved pegmatitic aqueous fluid.
Minor-element evolution
The fractionation of Ta from Nb is well established in experimental work (Linnen and Keppler, Reference Linnen and Keppler1997; Linnen, Reference Linnen1998) which found that in silicate melts, Ta-bearing phases are more soluble than their Nb-bearing counterparts (Ta# increases during fractionation). Minor-element heterovalent substitution in Ta–Nb oxides is greatest in the early stages of pegmatite crystallisation and decreases with fractionation into the late stages of crystallisation (Fig. 6a–d). Although similar trends have been recorded in the Varuträsk pegmatite, Sweden (Černý et al., Reference Černý, Chapman, Ferreira and Smeds2004), an explanation of the phenomenon is not clear. Ercit et al. (Reference Ercit, Wise and Černý1995) questioned whether this evolutionary compositional trend is crystal-chemical or geochemical in origin by comparing the minor-element trend to the state of order in the crystal structure of columbite-group minerals, i.e. do the mechanisms of hetrovalent substitution induce cation disorder or do columbite-group minerals with high contents of minor elements form early in the crystallisation history of the pegmatite when disordered states are more stable, allowing higher levels of minor-element substitution? A possible explanation, favouring the crystal-chemical origin, is that as other phases in the magma chamber began to stabilise, the minor elements favoured these newly stabilised minerals and therefore their abundances in columbite-group minerals and tapiolite decreased during fractionation. This hypothesis is important for Fe–Mn fractionation trends in columbite-group minerals as some authors suggest (Van Lichtervelde et al., Reference Van Lichtervelde, Beziat and Linnen2007) that co-existing phases competing for Mn, also control the fractionation of Fe from Mn.
Tapiolite is considered to form at late stages in pegmatites (Černý et al., Reference Černý, Ercit and Wise1992b). This is supported by abundant tapiolite being primarily found in greisenised zones of the pegmatites of the Cape Cross–Uis pegmatite belt (Fig. 8). Furthermore, and with the exception of some grains in sample 3.1-2, tapiolite exclusively has patchy zonation within pegmatites (Fig. 5). Co-occurring tapiolite and columbite-group minerals generally represent a composition that plots within the tapiolite gap giving rise to the pair of mineral phases, however, tapiolite shows much higher contents of Sn and Ti at a low Ta# (Fig. 6a; Černý et al., Reference Černý, Ercit and Wise1992b). If the crystallisation sequence is considered to transfer from columbite-group minerals to columbite-group minerals and tapiolite, then there is an observed increase in the Sn and Ti contents in tapiolite compared to columbite-group minerals. Tapiolite has a tetragonal crystal structure and therefore a greater affinity for Sn and Ti which can account for the increase in concentration of these minor elements in tapiolite (Neiva, Reference Neiva1996). Tapiolite repeats the same trend for Sn and Ti as seen in columbite-group minerals of decreasing minor-element substitution with increasing Ta# and fractionation. The abundance of cassiterite within the greisenised zones suggests that cassiterite competed for Sn and Ti, which favoured cassiterite as the solubility of cassiterite decreased and cassiterite stabilised.
Tapiolite shows no change in concentration compared to columbite-group minerals when other minor elements, Ca, Mg and W are compared to Sn and Ti. This is difficult to account for, considering the limited research of partition coefficients of specific elements into the tapiolite crystal structure. In essence, tapiolite might have no affinity for these minor elements or perhaps they had already been depleted in the crystallising liquid at the late-stages of crystallisation. In addition, these elements may have had a low activity during this phase of crystallisation if tapiolite is considered to crystallise from an exsolved aqueous fluid phase that did not preferentially partition Ca, Mg and W. Apart from the Ca, Mg and W concentrations in tapiolite, we suggest that minor-element trends in columbite-group minerals and tapiolite are governed by competing mineral phases.
Fractional crystallisation evolution of pegmatitic melts
Many authors have debated the controlling factors that lead to the fractionation of Fe from Mn or the lack of fractionation of Fe from Mn in Ta–Nb and Sn oxides. For example, Mulja et al. (Reference Mulja, Williams-Jones, Martin and Wood1996), Raimbault (Reference Raimbault1998), Van Lichtervelde et al. (Reference Van Lichtervelde, Beziat and Linnen2007) and Beurlen et al. (Reference Beurlen, Da Silva, Thomas, Soares and Olivier2008) suggest that co-existing phases competing with columbite-group minerals for Fe in the pegmatites deplete Fe in columbite-group minerals during fractionation leading to Mn-rich end-members. Van Lichtervelde et al. (Reference Van Lichtervelde, Beziat and Linnen2007) elaborate on this and show late-stage Ta–Nb oxides become progressively richer in Fe during fractionation and suggest that the natural fractionation progression of Ta–Nb oxides is one of Fe enrichment when competing mineral phases are absent. The depletion of Fe in columbite-group minerals is typical of the lepidolite-type pegmatites and typically precedes fractionation of Ta from Nb. Other authors (Černý, Reference Černý, Ercit and Wise1992b; Tindle and Breaks, Reference Tindle and Breaks2000; Černý et al., Reference Černý, Chapman, Ferreira and Smeds2004; Wise et al., Reference Wise, Francis and Černý2012) suggest that an increased alkali-fluoride activity promotes the extreme Fe–Mn fractionation before the onset of Ta enrichment, instead of a competing mineral phase control.
It is difficult to add to this debate based on the current study as the dominant pegmatite fractionation trend in Ta–Nb and Sn oxides is controlled by increasing Ta# (Figs 7, 8 and 9) where Ta is enriched relative to Nb and there is little fractionation between Fe and Mn, similar to pegmatites observed in Mulja et al. (Reference Mulja, Williams-Jones, Martin and Wood1996), Tindle and Breaks (Reference Tindle and Breaks2000) and Beurlen et al. (Reference Beurlen, Da Silva, Thomas, Soares and Olivier2008). Essentially the pegmatites in the Cape Cross–Uis pegmatite belt show both a lack of F-bearing phases and minerals that may compete for Mn, both of which may cause the observed fractionation trend. Evaluating the outliers that do not conform to the typical trend may provide some insight (Fig. 7d–f). It may be possible that sample W-3 (late-stage greisenised sample; Fig. 7f) follows a similar fractionation trend to the ones observed by Van Lichtervelde et al. (Reference Van Lichtervelde, Beziat and Linnen2007) in that Fe enrichment is the natural progression of fractionation in columbite-group minerals. The garnet–tourmaline pegmatite type also shows a concomitant fractionation trend in the Cape Cross–Uis pegmatite belt (Fig. 7d) similar to that noted in the pegmatites of the Preissac-Lacorne batholith, Canada, by Mulja et al. (Reference Mulja, Williams-Jones, Martin and Wood1996), where garnet occurrence in pegmatites is a controlling factor in Fe–Mn fractionation. This favours a co-existing mineral phase argument instead of the amount of alkali-fluoride activity. However, this trend might also be attributed to the garnet–tourmaline pegmatites having a slight NYF affinity (Fuchsloch et al., Reference Fuchsloch, Nex and Kinnaird2018) and, although not measured, might potentially have higher abundances of F (Wise et al., Reference Wise, Francis and Černý2012). Other bimodal trends and scattered data are more difficult to account for (Fig. 7d–f). Scattered data have been attributed to disequilibrium crystallisation in Ta–Nb and Sn oxides from other pegmatites (Splide and Shearer, Reference Splide and Shearer1992; London, Reference London2008) and the changes in thickness of oscillatory zones observed in columbite-group minerals and tapiolite (Figs 4d, 5b,c) support disequilibrium crystallisation (Lahti, Reference Lahti1987). Bimodal fractionation trends may likewise be a consequence of disequilibrium or in situ crystallisation, however, to our knowledge, no other similar bimodal trends have been presented in the literature. Local saturation in a boundary layer can be discredited as the cause of bimodal trends as the samples and pegmatites are homogenous and not zoned mineralogically (e.g. Gonzàlez et al., Reference González, Polonio, Moro, Fernández, Contreras and Benito2017). Perhaps these samples reflect a period in the crystallisation history of the pegmatites where Mn-competing phases stabilised in the melt thus changing the trend of newly crystallised columbite-group minerals.
Minor-element substitution trends in columbite-group minerals and tapiolite favour a co-existing mineral phase argument, if one agrees that minor-element substitution in Ta–Nb oxides induces mineral structural disorder, however, Ercit et al. (Reference Ercit, Wise and Černý1995) stresses that a broader range of Ta–Nb-bearing rock types requires investigation. Whatever the ultimate explanation as to the controlling factors of Fe–Mn fractionation, the pegmatites of the Cape Cross–Uis pegmatite belt have a beryl-to-spodumene Ta–Nb-oxide pegmatite signature (Černý, Reference Černý, Ercit and Wise1992b) and a typical Ta# increase during fractionation with little change in the Mn#.
Magmatic vs. exsolved aqueous fluid crystallisation
There is a general consensus amongst authors that patchy zonation in columbite-group minerals and tapiolite (Figs 4, 5) is the result of re-equilibration of columbite-group minerals and tapiolite with later fluids, whether they were magmatic (Tindle and Breaks, Reference Tindle and Breaks2000; Van Lichtervelde et al., Reference Van Lichtervelde, Beziat and Linnen2007, Reference Van Lichtervelde, Grégoire, Linnen, Béziat and Salvi2008), metamorphic (Černý et al., Reference Černý, Chapman, Chackowsky and Ercit1992a) or exsolved aqueous fluid (Novák and Černý, Reference Novák and Černý1998; Zhang et al., Reference Zhang, Wang, Hu, Zhang, Zhu and Chen2004; Alfonso and Melgarejo, Reference Alfonso and Melgarejo2008; Ashworth, Reference Ashworth2013; Ballourad et al., Reference Ballourad, Poujol, Boulvais, Branquet, Tartèse and Vigneresse2016). Similarly, oscillatory and progressive zoning are indicative of a magmatic regime (see discussions in Lahti, Reference Lahti1987 and Van Lichtervelde et al., Reference Van Lichtervelde, Beziat and Linnen2007).
The underlying principle surrounding the debate is not if a pegmatitic magma will exsolve an aqueous fluid but instead is directed at the partition coefficients of Ta and Nb into the aqueous fluid. Many authors have shown that the presence of an aqueous fluid being exsolved from the pegmatitic magma in the late stages of petrogenesis is probable (London, Reference London2008). For example, the muscovite chemistry of greisens in the Tanco pegmatite, Canada, show characteristics of crystallisation from an aqueous fluid (Van Lichtervelde et al., Reference Van Lichtervelde, Grégoire, Linnen, Béziat and Salvi2008). In essence, are Ta–Nb-bearing phases crystallised from a highly fractioned magma (Van Lichtervelde et al., Reference Van Lichtervelde, Grégoire, Linnen, Béziat and Salvi2008) with or without a co-existing aqueous fluid or are they crystallised directly from the aqueous fluid itself? In the case of aqueous fluid crystallisation, Ta and Nb partition preferentially into the aqueous fluid, causing saturation of Ta and Nb and subsequently crystallising Ta–Nb-bearing phases (Alfonso and Melgarejo, Reference Alfonso and Melgarejo2008). In either case, the authors on both sides of the debate present evidence for and against crystallisation from a magmatic phase. For example, Van Lichtervelde et al. (Reference Van Lichtervelde, Grégoire, Linnen, Béziat and Salvi2008) suggests, based on the experimental evidence of Chevychelov et al. (Reference Chevychelov, Zaraisky, Borisovskii and Borkov2005), that a late, rare-metal and flux-enriched magma may produce metasomatic features such as patchy zonation whereas other authors (Zhang et al., Reference Zhang, Wang, Hu, Zhang, Zhu and Chen2004; Alfonso and Melgarejo, Reference Alfonso and Melgarejo2008) use patchy zonation as evidence of crystallisation from an aqueous fluid as Ta–Nb oxides are synchronous with greisenisation and other late-stage fluid-alteration products.
Chevychelov et al. (Reference Chevychelov, Zaraisky, Borisovskii and Borkov2005) showed that the partition coefficients of Ta and Nb into a co-existing aqueous fluid were very low (0.002–0.080 and 0.005–0.080, respectively). Van Lichtervelde et al. (Reference Van Lichtervelde, Beziat and Linnen2007, Reference Van Lichtervelde, Grégoire, Linnen, Béziat and Salvi2008) argue, based on this study, that an aqueous fluid could not transport significant quantities of Ta and Nb and subsequently crystallise Ta–Nb-bearing phases during alteration of K-feldspars to muscovite in greisens. However, the experimental study of Chevychelov et al. (Reference Chevychelov, Zaraisky, Borisovskii and Borkov2005) was based on fluoride aqueous fluids only and at temperatures exceeding 900°C. More probable pegmatitic crystallisation temperatures for the Cape Cross–Uis pegmatite belt, shown by Ashworth (Reference Ashworth2013), are between 450°C and 550°C with hypersaline and aqueo-carbonic fluid compositions. In addition, the experimental study shows that decreasing temperatures cause significant increases in the partition coefficient of Ta in an aqueous fluid whereas the Nb partition coefficient shows negligible changes with decreasing temperatures. Perhaps at pegmatitic conditions, the Ta partition coefficients for an aqueous fluid may be higher than the Nb partition coefficient.
A suitable example from this research is the Ta# variation between patchy zonation and oscillatory zonation. Figure 5 shows that patchy zonation has lower Nb contents than Ta compared to oscillatory zonation indicating patchy zonation has a higher Ta#. If the partition coefficient of Ta into an aqueous fluid increases with decreasing temperature and the Nb partition coefficient remains relatively unchanged, it can therefore be inferred that patchy zonation, at pegmatitic temperatures, has a higher Ta# if crystallised from an aqueous fluid. However, Chevychelov et al. (Reference Chevychelov, Zaraisky, Borisovskii and Borkov2005) only extrapolate their data for Ta to lower temperatures of 600°C and do not extrapolate data for Nb. As this is only an extrapolation and in light of the limited experimental research, only hypothetical situations may be discussed. For example, Van Lichtervelde et al. (Reference Van Lichtervelde, Beziat and Linnen2007) found that Ta# in both patchy and co-existing oscillatory/progressive zonation is roughly constant for both types of zonation, therefore, as Nb and Ta have different partition coefficients (Chevychelov et al., Reference Chevychelov, Zaraisky, Borisovskii and Borkov2005) for an aqueous fluid phase, crystallised from a magmatic phase.
Some of the data for columbite-group minerals, tapiolite and cassiterite show non-stoichiometric values (Figs 6e, 9a) in terms of the ratio of A-site and B-site cations. It is notable that these minerals occur ubiquitously, expect for sample 5-3, in greisens and are depleted in Ta and Nb (B site) relative to Fe and Mn (A site). As Ercit et al. (Reference Ercit, Wise and Černý1995) points out, this may be geochemically or crystal-chemically controlled. The stoichiometry may be controlled by the state of order of the crystals, being different in the early- and late-stages of Ta–Nb–Sn-oxide crystallisation. Another hypothesis is that the Ta and Nb in magmatically crystallised minerals are remobilised preferentially over Fe and Mn during the greisenisation process by either a highly differentiated magma in the late-stages of crystallisation or an exsolved pegmatitic hydrothermal fluid. This would account for Ta–Nb–Sn oxides in greisens having a B-site deficiency. However, the fluid that might cause remobilisation is still debatable and comes down to the understudied partition coefficients of these elements at pegmatitic conditions.
The characteristics of zonation and associated minerals is important when considering their co-crystallising nature. Minor elements show that cassiterite competes with Ta–Nb-bearing phases for Sn and Ti (Fig. 6a). Cassiterite is known to crystallise preferentially from an aqueous phase with partition coefficients of Sn into an aqueous fluid being high, examples being cassiterite-bearing quartz veins (e.g. Kovalenko et al., Reference Kovalenko, Ryzhenko, Barsukov, Klintsova, Velyukhanova, Volynets and Kytayeva1986). Cassiterite, tapiolite and columbite-group minerals show an intimate mineralogical relationship, specifically in synchronous alteration zones such as greisens (Fig. 4a). It would therefore be plausible that the crystallising medium of cassiterite is concomitant to the fluid or magma crystallising Ta–Nb-bearing phases. As abundant cassiterite is suggested to crystallise from an aqueous fluid specifically in greisen zones (Fuchsloch et al., Reference Fuchsloch, Nex and Kinnaird2018), it would be incongruent for the Ta–Nb-bearing phases to be crystallising synchronously from another phase such as a highly fractionated magma simultaneously.
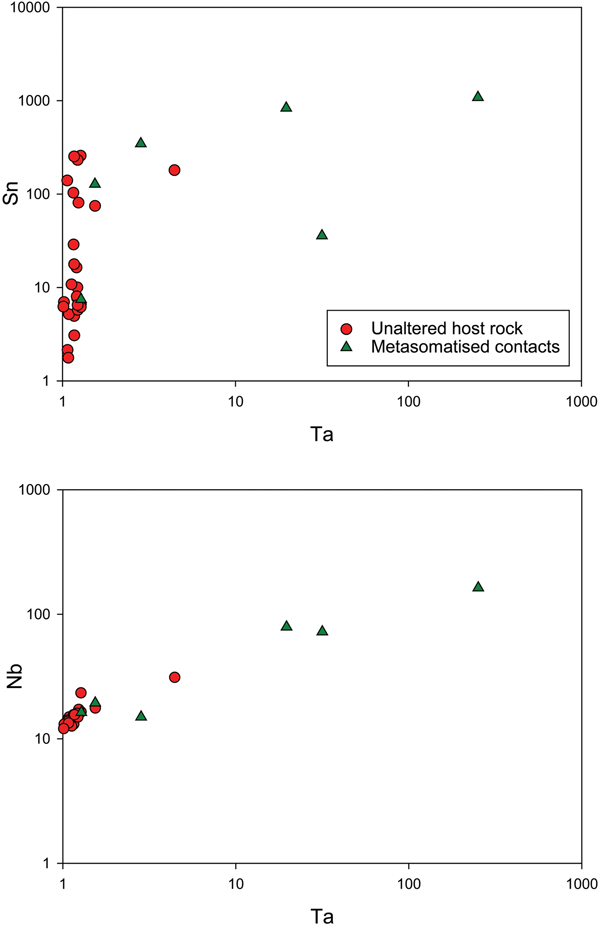
Other evidence that would suggest that Ta and Nb partition preferentially into an aqueous fluid phase is the presence of high concentrations of Ta and Nb in metasomatic, tourmalinised host-rock schist contact zones in pegmatites. Fuchsloch (Reference Fuchsloch, Nex and Kinnaird2018) and Fuchsloch et al. (Reference Fuchsloch, Nex and Kinnaird2018) report data of host-rock schists in contact with pegmatites, that show a high degree of tourmalinisation and metasomatism, which have significantly elevated values of Sn, Ta and Nb (Fig. 10). Out of six metasomatic contact schists, five are above that of general host-rock schists that show no metasomatic features and occur some distance away from pegmatites. Furthermore, the increases in the Ta concentrations of the metasomatic contacts show a correlation with increases in Sn and Nb indicating these elements are co-genetic with Ta (Fig. 10). Only one metasomatic schist showed lower Sn concentrations coupled with high Ta concentrations. In one case, the Ta content of the metasomatic schist is two orders of magnitude higher than schists which do not show metasomatic features (250 ppm Ta compared to 1–2 ppm, respectively). This metasomatic schist sample is so enriched in Ta it is comparable to economically mineralised pegmatites.
Fig. 10. Country-rock whole-rock data showing the Ta plotted against Sn and Nb in the upper and lower graphs respectively. The rock types include general host rocks which show no alteration and occur at variable distances to pegmatites and metasomatised, tourmalinised host-rock contacts with pegmatites. Plots are given in logarithmic scales due to orders of magnitude differences between the data.
If the physical mobility of the crystallising fluid, magmatic or aqueous, is considered, it would be more reasonable for an aqueous fluid to transport these elements and enrich country-rock contacts. This is particularly evident in zoned pegmatite bodies which crystallise inwards, essentially trapping the highly fractionated magma in the late stages of petrogenesis within itself. An aqueous fluid is likely to percolate through to country rocks which London (Reference London2008) suggests is the cause of massive tourmalinisation of country rocks as these fluids also carry boron.
In summary, until repeatable results can be obtained on the partition coefficients of Ta and Nb in various aqueous fluids at pegmatitic conditions, no factual hypothesis may be derived with respect to crystallisation of Ta–Nb-bearing phases in the late-stages of pegmatitic petrogenesis. Although some studies have begun to tackle this problem (e.g. Smirnov et al., Reference Smirnov, Thomas, Kamenetsky, Kozmenko and Large2012), these investigations did not measure the Ta contents of the aqueous fluid and the Ta-bearing experiments did not reach equilibrium. Moreover, country-rock contacts were not a detailed focus of Fuchsloch (Reference Fuchsloch2018) and therefore the dataset is limited to few samples which have not been studied in detail, for example, which minerals contain the Ta, Nb and Sn in metasomatised country rocks? A detailed investigation should be carried out on these country rocks in future which should involve a systematic sampling programme, whole-rock geochemistry, mineral chemistry and petrography. From an initial perspective, the Ta, Nb and Sn contents of country rock contacts and the intimate relationship between cassiterite, columbite-group minerals and tapiolite in greisen zones in pegmatites of the Cape Cross–Uis pegmatite belt is more consistent with crystallisation from an aqueous fluid during greisenisation.
Regional aspects
Fuchsloch et al. (Reference Fuchsloch, Nex and Kinnaird2018) showed that the different pegmatite types in the Cape Cross–Uis pegmatite belt are not only different in terms of mineralogy and host-rock but also have different fractionation signatures and degrees of fractionation. The garnet–tourmaline pegmatites show primitive fractionation signatures whereas the Nb–Ta–Sn type show intermediate fractionation signatures, while the Li pegmatites show evolved fractionation signatures. The authors showed that the spatial distribution of the different pegmatite types is random rather than displaying the regional zonation patterns observed in other belts by Černý (Reference Černý, Möller, Černý and Saupé1989). Fuchsloch et al. (Reference Fuchsloch, Nex and Kinnaird2018) attributed this random distribution as evidence that the pegmatites are not related to the granites in the classical parent–daughter relationship. When comparing the location of the pegmatites studied relative to the granites (Fig. 2) and their individual Ta–Nb- and Sn-oxide fractionation patterns (Fig. 7) there is a similar random distribution of pegmatites with varying degrees of fractionation. This supports the argument that the pegmatites in the Cape Cross–Uis pegmatite belt are not related to the granites in the typical parent–daughter scenario.
Melcher et al. (Reference Melcher, Graupner, Gäbler, Sitnikova, Henjes-Kunst, Oberthür, Gerdes and Dewaele2015) suggested that columbite-group minerals in the Uis pegmatites show concomitant fractionation trends in the columbite quadrilateral based on two of the pegmatites studied in the Cape Cross–Uis pegmatite belt. Contrary to this finding, we suggest that the dominant fractionation trend in the belt is subparallel to the Ta/(Ta + Nb) axis: increasing Ta# with little change in the Mn# (Fig. 8). This trend is typical of beryl-type pegmatites and similar to the Karibib pegmatites studied in Melcher et al. (Reference Melcher, Graupner, Gäbler, Sitnikova, Henjes-Kunst, Oberthür, Gerdes and Dewaele2015). The other pegmatite belts of the Damara Belt are not studied in detail in terms of Ta–Nb oxides, however, Melcher et al. (Reference Melcher, Graupner, Gäbler, Sitnikova, Henjes-Kunst, Oberthür, Gerdes and Dewaele2015), while building an African-scale database, showed that most Ta–Nb oxides are Mn rich and have typical lepidolite-type pegmatite fractionation patterns (e.g. Rubicon, Helicon, Mon Repos and Klein Rössing). The variation in Ta–Nb oxide composition in the Damara Belt may be due to the abundance of F in other pegmatite belts, leading to Mn enrichment (Wise et al. Reference Wise, Francis and Černý2012). An interesting case is that of the columbite-group minerals fractionation trend in garnet–tourmaline pegmatites, being the only pegmatite type that shows concomitant fractionation, where significant increases in the Mn# occur. Fuchsloch et al. (Reference Fuchsloch, Nex and Kinnaird2018) found that garnet–tourmaline pegmatites types have significantly higher abundances of rare-earth elements compared to other pegmatite types within the Cape Cross–Uis pegmatite belt. The authors suggested, that the garnet–tourmaline pegmatites may have a slight NYF pegmatite family affinity and perhaps, although not measured, contain a higher abundance of F compared to other pegmatite types and therefore it may be the cause of Mn-enrichment in columbite-group minerals from these pegmatites. Although Melcher et al. (Reference Melcher, Graupner, Gäbler, Sitnikova, Henjes-Kunst, Oberthür, Gerdes and Dewaele2015) disagree and suggest that there is little difference between the fractionation trends of NYF and LCT pegmatites in Ta–Nb oxides, future detailed studies of coexisting NYF and LCT pegmatites in the same orogenic belt, such as the Damara Belt, might provide some insight into the matter.
Conclusions
Columbite-group minerals and tapiolite fractionation trends, consistent with beryl-to-spodumene rare-element pegmatites, are dominantly controlled by increasing Ta# with little change in the Mn# resulting in a crystallisation sequence of columbite-(Fe) → tantalite-(Fe) → tapiolite. Tapiolite is generally a secondary mineral phase as indicated by its patchy zonation texture. The decrease in minor-element substitution with increasing Ta# in columbite-group minerals and tapiolite, suggests that as new phases began to crystallise in the magma chamber, they competed with columbite-group minerals and tapiolite for these minor elements, and thus their abundances decrease during crystallisation. Unusual bimodal columbite-group minerals fractionation trends and scattered columbite-group mineral data for specific samples were probably due to disequilibrium crystallisation which is supported by textural evidence such as changes in the thickness of oscillatory zones in oscillatory-zoned crystals.
Aqueous fluid vs. highly fractionated magmatic crystallisation of Ta–Nb and Sn oxides has been the subject of appreciable debate. Some authors would argue, based on experimental evidence, that Ta and Nb do not partition into an exsolved pegmatitic aqueous fluid during the late stages of pegmatitic evolution. However, experimental studies are limited and mostly not at pegmatitic conditions (low temperatures of crystallisation) with varying fluid compositions. On the basis of the significantly elevated Ta contents in metasomatised country rocks in contact with pegmatites, compared to low values in unaltered host rocks, we suggest that Ta may have partitioned into an aqueous fluid phase and had a significant effect on Ta–Nb mineralisation together with Sn mineralisation. Ultimately without more experimental evidence, only proxy evidence may be used, and we suggest that future studies on the partition coefficients of Ta into various aqueous fluids at pegmatitic compositions be conducted. Moreover, a more detailed investigation should be carried out on the Cape Cross–Uis host rocks as the current data is limited.
Fractionation levels in columbite-group minerals, tapiolite and cassiterite from specific pegmatites show an irregular spatial distribution relative to granites in the Cape Cross–Uis pegmatite belt. This supports the hypothesis of Fuchsloch et al. (Reference Fuchsloch, Nex and Kinnaird2018) that pegmatites were most likely to have been produced from anatexis. If a parent–daughter relationship existed between pegmatites and granites, a distinct zonation pattern surrounding the granitic bodies should be present, with the pegmatites furthest from granites showing the most evolved columbite-group mineral compositions.
Acknowledgements
We thank Deon Van Niekerk for the use and assistance on the Electron Microprobe at Rhodes University (Partially funded by NRF national Equipment Program grant UID 74464). John Spratt was instrumental in this study, confirming early cassiterite results and analysing individual tapiolite crystals at the Natural History Museum, London. We are grateful to the technical team at the University of the Witwatersrand who provided many tireless hours aiding and advising in the separation of accessory minerals. The funding provided by the CIMERA research centre was instrumental to this study, without whom, the project would not have been possible.
Supplementary material
To view supplementary material for this article, please visit https://doi.org/10.1180/mgm.2018.151