Introduction
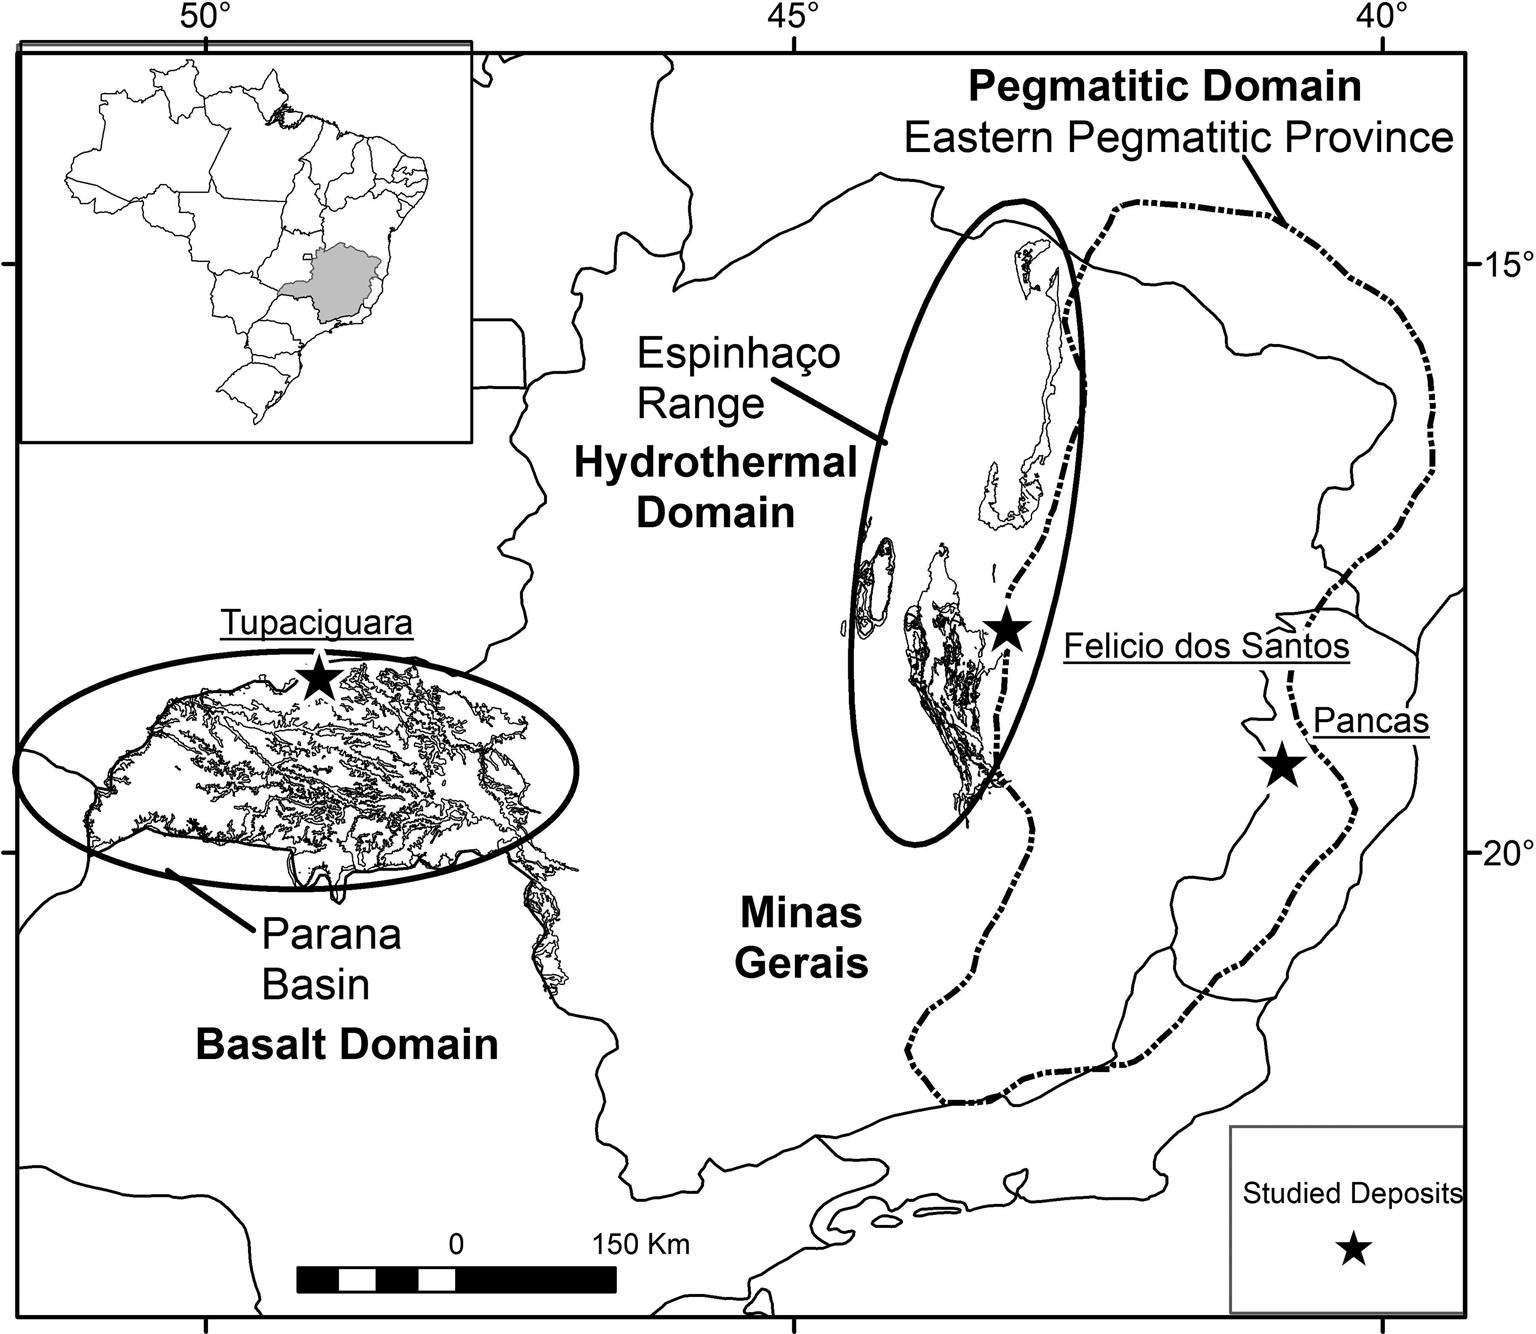
Amethyst, the violet variety of quartz, is a gemmological material that can be found in different geological environments. In Minas Gerais State, Brazil (Fig. 1), amethyst quartz deposits primarily occur: filling cavities in basaltic rocks (geodes) of the Triângulo Mineiro area; in hydrothermal veins associated with the geological units of the Espinhaço mountain range; and in granitic pegmatites from the Eastern Brazilian Pegmatite Province.

Fig. 1. Map of Minas Gerais State indicating the sample locations (black star): Tupaciguara (amethyst from basaltic rocks), Felício dos Santos (amethyst from metamorphic quartz veins); and Pancas (amethyst from granitic pegmatite). The basalt, hydrothermal and pegmatitic domains are shown. Based on Pinto and Silva (Reference Pinto and Silva2014).
A summary of the main environments of worldwide amethyst formation, their temperature ranges and types of fluids involved is given by Gilg (Reference Gilg, Balzer and Gilg2012). According to Gilg, amethyst can be formed in: miarolitic cavities of intrusive felsic rocks, at temperatures up to 300°C by gas-rich magmatic brines; in epithermal veins in felsic-to-intermediate volcanic terrains at temperatures between 160°C and 270°C, by low-salinity meteoric fluids; in low-temperature veins in gneiss, granite and ferruginous quartzite at temperatures below 150°C by fluids of variable salinity with low gas content; and in geodes hosted in basaltic volcanic rocks, by low-salinity connate fluids with low gas contents at maximum temperatures of 100°C.
Gilg et al. (Reference Gilg, Morteani, Kostitsyn, Preinfalk, Gatter and Strieder2003) and Commin-Fischer et al. (Reference Commin-Fischer, Berger, Polvé, Dubois, Sardini, Beaufort and Formoso2010) reported maximum trapping temperatures of 100°C and low-salinity fluids for amethyst hosted in basalt cavities at Rio Grande do Sul, Brazil. For amethyst related to Cretaceous granite in South Korea, Yang et al. (Reference Yang, Yun and Lee2001) discussed higher formation temperatures, between 280°C and 400°C, and average salinity of 4 eq. wt.% NaCl. Dumanska-Slowik et al. (Reference Dumanska-Slowik, Tobola, Jarmolowicz-Szulc, Naglik, Dylag and Szczerba2017) studied fluid inclusions trapped in amethyst associated with Lower Cambrian siltstone–sandstone, and report homogenisation temperatures between 210°C and 330°C and salinity values between 6 and 13 eq. wt.% NaCl. According to those authors, amethyst is formed by fluids hotter than for colourless quartz, which record homogenisation temperatures between 154°C and 219°C. This present work focuses on petrographic and microthermometric studies of fluid inclusions trapped in amethyst quartz from the three main genetic environments in Brazil, to better understand the conditions of crystallisation. The main techniques used are freezing and heating of fluid inclusions and Raman spectroscopy. We also attempt to distinguish amethyst types on the basis of their genesis and fluid composition.
Materials and methods
The samples selected are predominantly amethyst quartz from three distinct geological environments in the state of Minas Gerais (MG) and surrounding regions (Fig. 1; Table 1): cavities in basaltic rocks from the Serra Geral Formation, Tupaciguara municipality, in the Triângulo Mineiro area (MG) (Fig. 2a); metamorphic veins in metasedimentary rocks from the Macaúbas Group, Felício dos Santos municipality (MG) (Fig. 2b); and granitic pegmatite from the Eastern Brazilian Pegmatite Province, Pancas municipality, in the state of Espírito Santo (Fig. 3). Four doubly polished thin sections, cut parallel to the ‘c’ axis, were prepared to study the fluid inclusions in single crystals or amethyst crystal aggregates (Figs 2, 3). Thin sections were labelled T1 (amethyst crystal from Tupaciguara), FS1 (amethyst crystal from Felício dos Santos), FS2 (second amethyst crystal from Felício dos Santos) and P1 (amethyst crystal aggregate from Pancas).
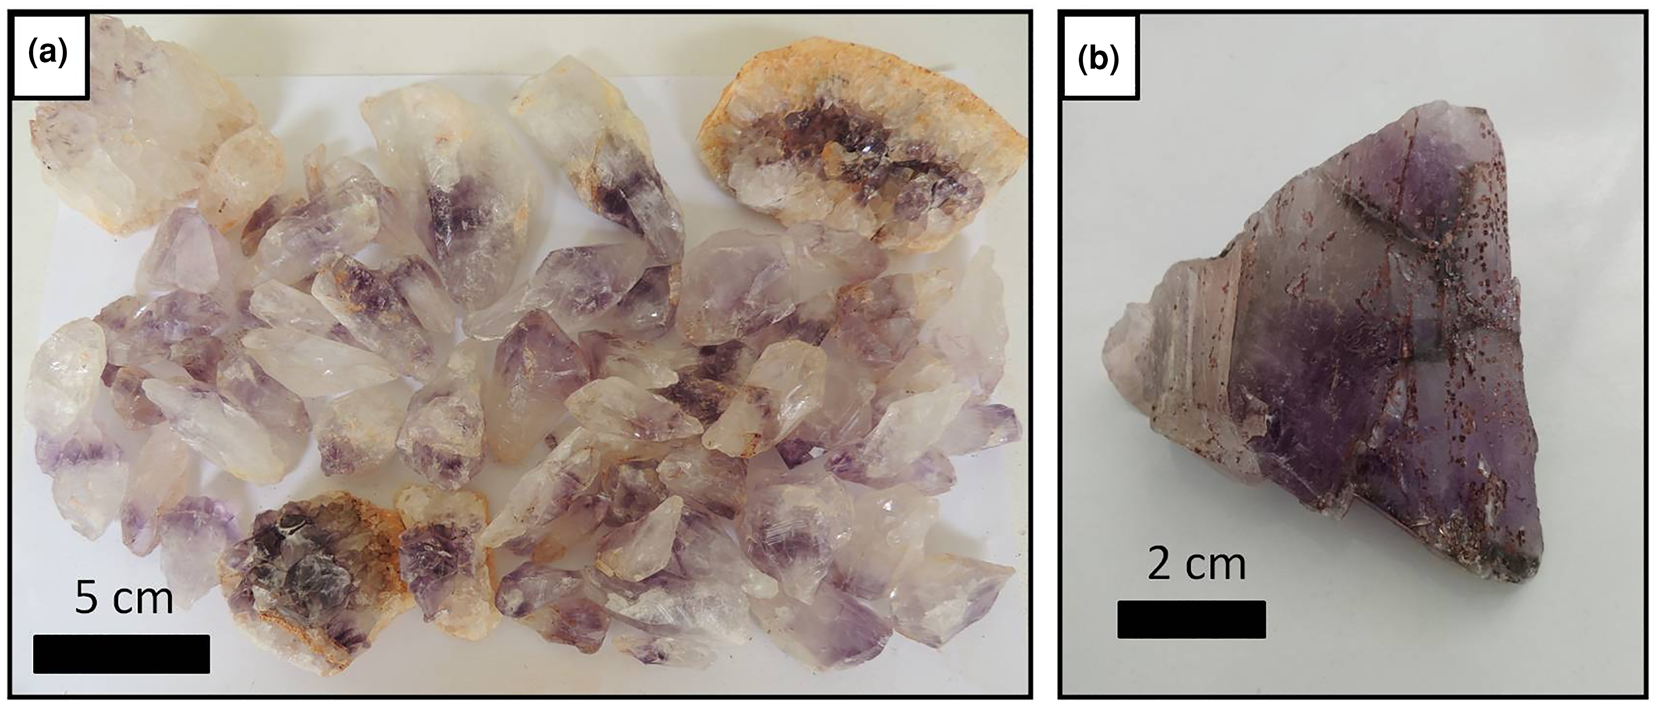
Fig. 2. Selected amethyst samples: (a) crystals from a basalt cavity in the Tupaciguara deposit; and (b) sample from a hydrothermal vein in the Felício dos Santos deposit.
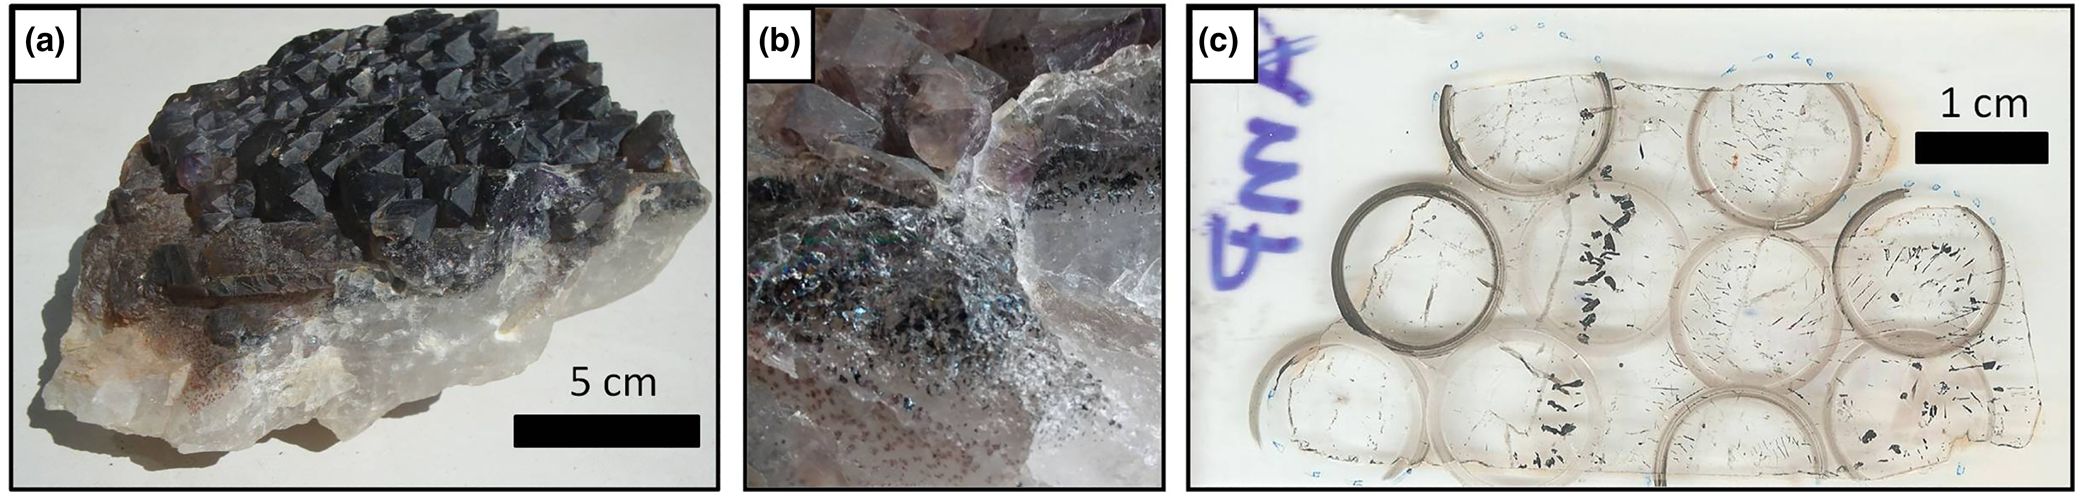
Fig. 3. (a) Amethyst crystal aggregate from a pegmatite (Pancas county); (b) detail of hematite solid inclusions in the same sample; and (c) thin section from this sample after making the cuts with a cutting wheel, delimiting the regions selected in the mapping stage.
Table 1. Location information for the three environments sampled.

Inclusions were mapped initially using a Leica optical microscope with an integrated Leica DFC290 camera, at the Manoel Teixeira da Costa Research Center/CPMTC-IGC-UFMG Metallogeny Laboratory, in order to locate, describe, classify and group the inclusions in assemblages (fluid-inclusion assemblages – FIA) according to Goldstein and Reynolds (Reference Goldstein and Reynolds1994) criteria. FIAs were classified as primary, pseudo-secondary or secondary based on Shepherd et al. (Reference Shepherd, Rankin and Alderton1985) and Bodnar (Reference Bodnar, Samson, Anderson A and Marshall2003).The selected regions were marked on the thin sections and removed using a cutting wheel (Fig. 3c), at the UFMG Microscopy Center, followed by immersion in acetone to remove the coverslip. Each piece (chip) was named C1, C2, C3…, and the assemblages measured on each chip C1FIA1, C1FIA2, etc.
The microthermometric studies were conducted on an automated Linkam THMSG600 heating/freezing stage with a temperature controller TMS93 coupled to a Leica petrographic microscope, at the CPMTC Metallogeny Laboratory, using Linksys 32 software to control and record the experiments. Freezing and heating experiments were conducted on two- or three-phase fluid inclusions trapped in FS1, FS2 and P1 amethyst samples to obtain clathrate melting (Tclath), CO2 melting (${\rm T}_{{\rm mC}{\rm O}_ 2}$ ), first ice melting (Te), last ice melting (TmIce), hydrohalite melting (TmHH), halite final dissolution (TmHal) and total homogenisation temperatures (homogenisation temperature of the liquid and vapour phases – Thtot). Homogenisation temperatures for aqueous carbonic inclusions were observed through the expansion of the CO2 phase, and for aqueous inclusions by homogenisation into a liquid phase.
The freezing tests reached –140°C, and the heating tests ~500°C. The stage was calibrated with synthetic CO2 and H2O inclusions provided by Linkam. Measurement accuracy is ± 0.1°C for negative temperatures and ±1°C for temperatures between 0–500°C. The temperature measurements of clathrate melting (Tclath), final ice melting (TmIce), hydrohalite melting (TmHH) and total homogenisation (homogenisation temperature of liquid and vapour phases – Thtot) obtained during the tests were entered into MacFlincor software (Brown and Hagemann, Reference Brown and Hagemann1995) for density and salinity calculations. For the single halite final dissolution temperature acquired, salinity was obtained by the equations of Bowers and Helgeson (Reference Bowers and Helgeson1983). The densities and salinities were calculated considering the equations for H2O–CO2–NaCl and H2O–NaCl–[KCl] systems by Bowers and Helgeson (Reference Bowers and Helgeson1983) and Bodnar and Vityk (Reference Bodnar, Vityk, de Vivo and Frezzotti1994), respectively.
In the absence of independent geothermometric data for the host rocks, it was not possible to calculate isochores and apply pressure corrections to homogenisation temperatures. As there is no evidence that satisfies the criteria for boiling (Ramboz et al., Reference Ramboz, Pichavant and Weisbrod1982), the measured homogenisation temperatures are considered as the minimum trapping temperatures. Additional Raman spectroscopy analyses were taken at the Raman Spectroscopy Laboratory (Metallurgy Department of the Engineering School/UFMG), in order to support data interpretation from the microthermometric studies, as presented by Frezzotti et al. (Reference Frezzotti, Tecce and Casagli2012). For Raman analysis a LabRam-HR 800 (Horiba Jobin Yvon) spectrograph was used, with a He–Ne laser (excitation at 632.8 nm, focused to a spot of 1–2 μm), and an Olympus BX41 microscope provided with a long distance lens of ×100. The collected back-scattered light was dispersed by a monochromator equipped with 600 gr/mm grating and detected by a LN2 cooled CCD system. The spectra ranged from 700 to at least 3700 cm–1 with a step size of 1.1 cm–1. The acquisition time ranged from 30 s to a maximum of one minute. To increase signal-to-noise ratio, spectra were acquired a minimum of ten times.
Geological context
Basalt cavity amethyst
Amethyst from basalt cavities occurs within the lava flows of the Paraná Basin, which can reach a thickness of 1700 m in an area of >900,000 km2 in Brazil, Uruguay, Paraguay and Argentina (Piccirillo and Melfi, Reference Piccirillo and Melfi1988; Frank et al., Reference Frank, Gomes and Formoso2009). In Minas Gerais, these flows occur exclusively in the Triângulo Mineiro region in the Serra Geral Formation (Fig. 4). In this type of mineralisation, amethyst occurs, in general, at the upper part of the central level of the lava flow, inside cavities that can also contain chalcedony, agate or hyaline quartz, in addition to zeolites, opal, calcite, gypsum and, more rarely, baryte (Juchem et al., Reference Juchem, Hofmeister and Brum1990; Juchem, Reference Juchem2013). The mineralised horizons are generally 1 to 5 m in thickness. The origin of the flows is related to the volcanic activity that occurred on the South American platform during the opening of the South Atlantic Ocean at ca. 135 Ma (Thiede and Vasconcelos, Reference Thiede and Vasconcelos2010; Dodd et al., Reference Dodd, Macniocaill and Muxworthy2015). In the Tupaciguara region, the basement rocks crop out to the north and east, and consist of Neoproterozoic granites and gneisses. To the south, sedimentary rocks of the Upper Cretaceous Bauru Group occur.
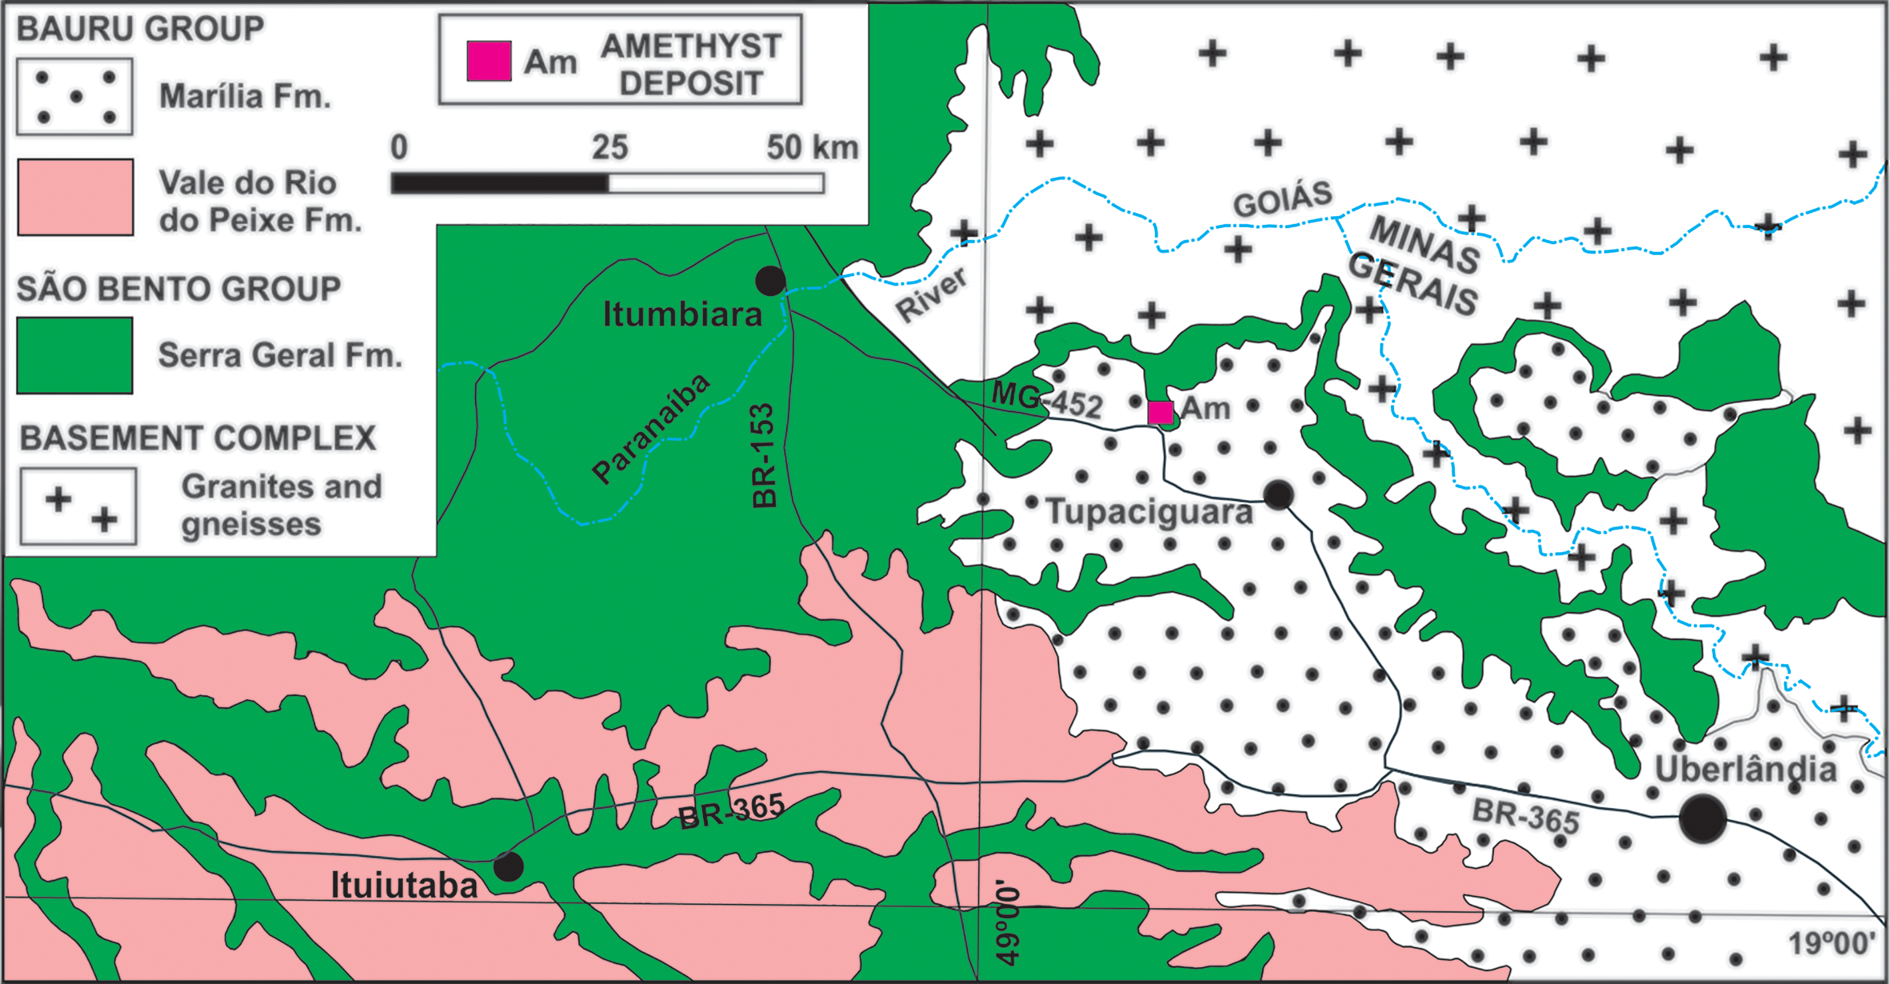
Fig. 4. Simplified geological context of Tupaciguara region. Based on Valente et al. (Reference Valente, Lacerda Filho, Rizzotto, Lopes, Romanini, Oliveira, Sachs, Silva, Batista, Schobbenhaus, Gonçalves, Santos, Abram, Leão Neto, Matos, Vidotti, Ramos and de Jesus2004).
The amethyst crystal selected originates from the Barreiro farm, Tupaciguara municipality, close to a highway (Table 1), where amethyst occurs in a regolith of weathered basalt (Fig. 5a). Crystals are found mainly in spherical to semi-spherical geodes, sometimes slightly elongated in one of the axes, and exhibit a centimetric-to-decimetric conical shape (Fig. 5b). The crystals are subhedral, have an elongated shape with a wider termination and show a light violet colour zoning, generally more intense from the centre to the apical portion of the crystal. Detailed petrography of the deposit host rocks is presented in Dias et al. (Reference Dias, Chaves, Juchem and Romano2019) and described as a hypocrystalline amygdaloidal basalt, with ophitic-to-subophitic texture. The main mineral assemblage is composed of plagioclase, clinopyroxene and glass, together with secondary iron oxides/hydroxides and smectite filling cavities or matrix interstices (Fig. 5c,d).
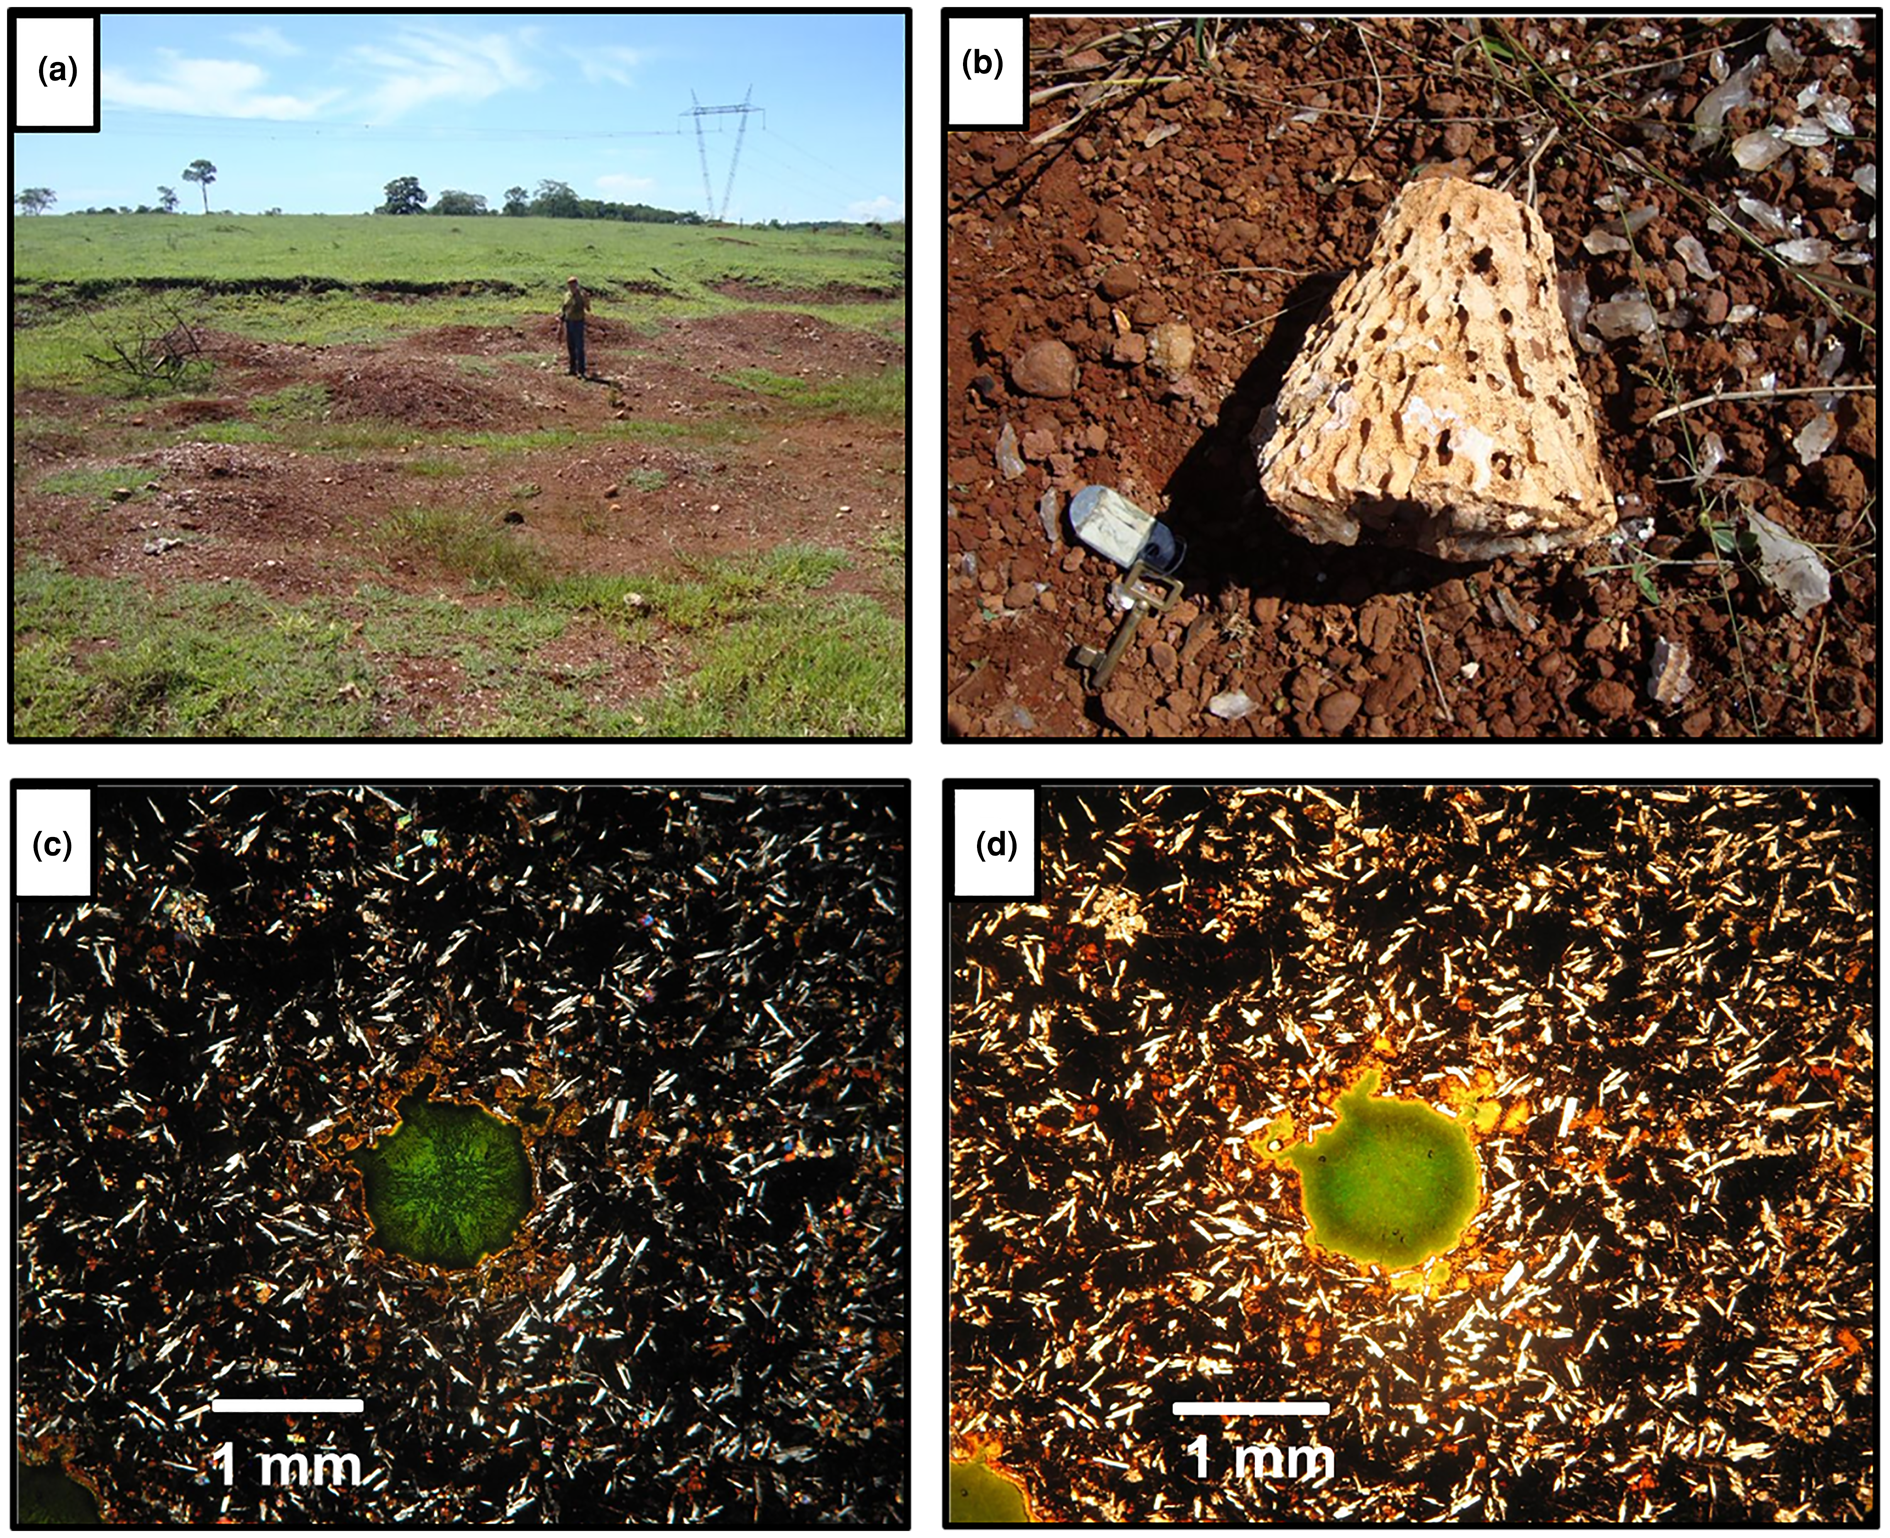
Fig. 5. (a) General view of the regolith from which amethyst crystals were recovered; (b) geode fragment typical for this locality, with conical shape; (c) general aspect of the host rock matrix, composed of plagioclase, clinopyroxene and glass, with smectite filling a cavity (crossed polarisers); and (d) same specimen in plane polarised light .
Hydrothermal vein amethyst
Hydrothermal quartz veins are generally formed by devolatilisation reactions in rocks during regional metamorphism (Yardley, Reference Yardley1983), when quartz precipitates from silica-rich solutions as a result of decompression. In Minas Gerais State this type of deposit is the source of the majority of amethyst production. The amethyst samples from hydrothermal veins were collected at the Sobrado Farm deposit, also known as ‘Lavra da Pedra Roxa’ (Purple Stone mine), located ~7 km southeast of Felício dos Santos municipality (Fig. 6). The deposit is located on the western flank of the Negra Range, to the east of Espinhaço mountains. There are numerous veins cutting the country rocks in the area, which are principally mica-quartz schists of the Neoproterozoic Capelinha Formation, Macaúbas Group (Tupinambá et al., Reference Tupinambá, Baars, Uhlein, Grossi-Sad and Knauer1996). The formation of the veins is related to the regional deformation and metamorphism of the Araçuaí Orogeny between 630–480 Ma, in the Brasiliano cycle (Almeida, Reference Almeida1977; Pedrosa-Soares et al. Reference Pedrosa-Soares2011).
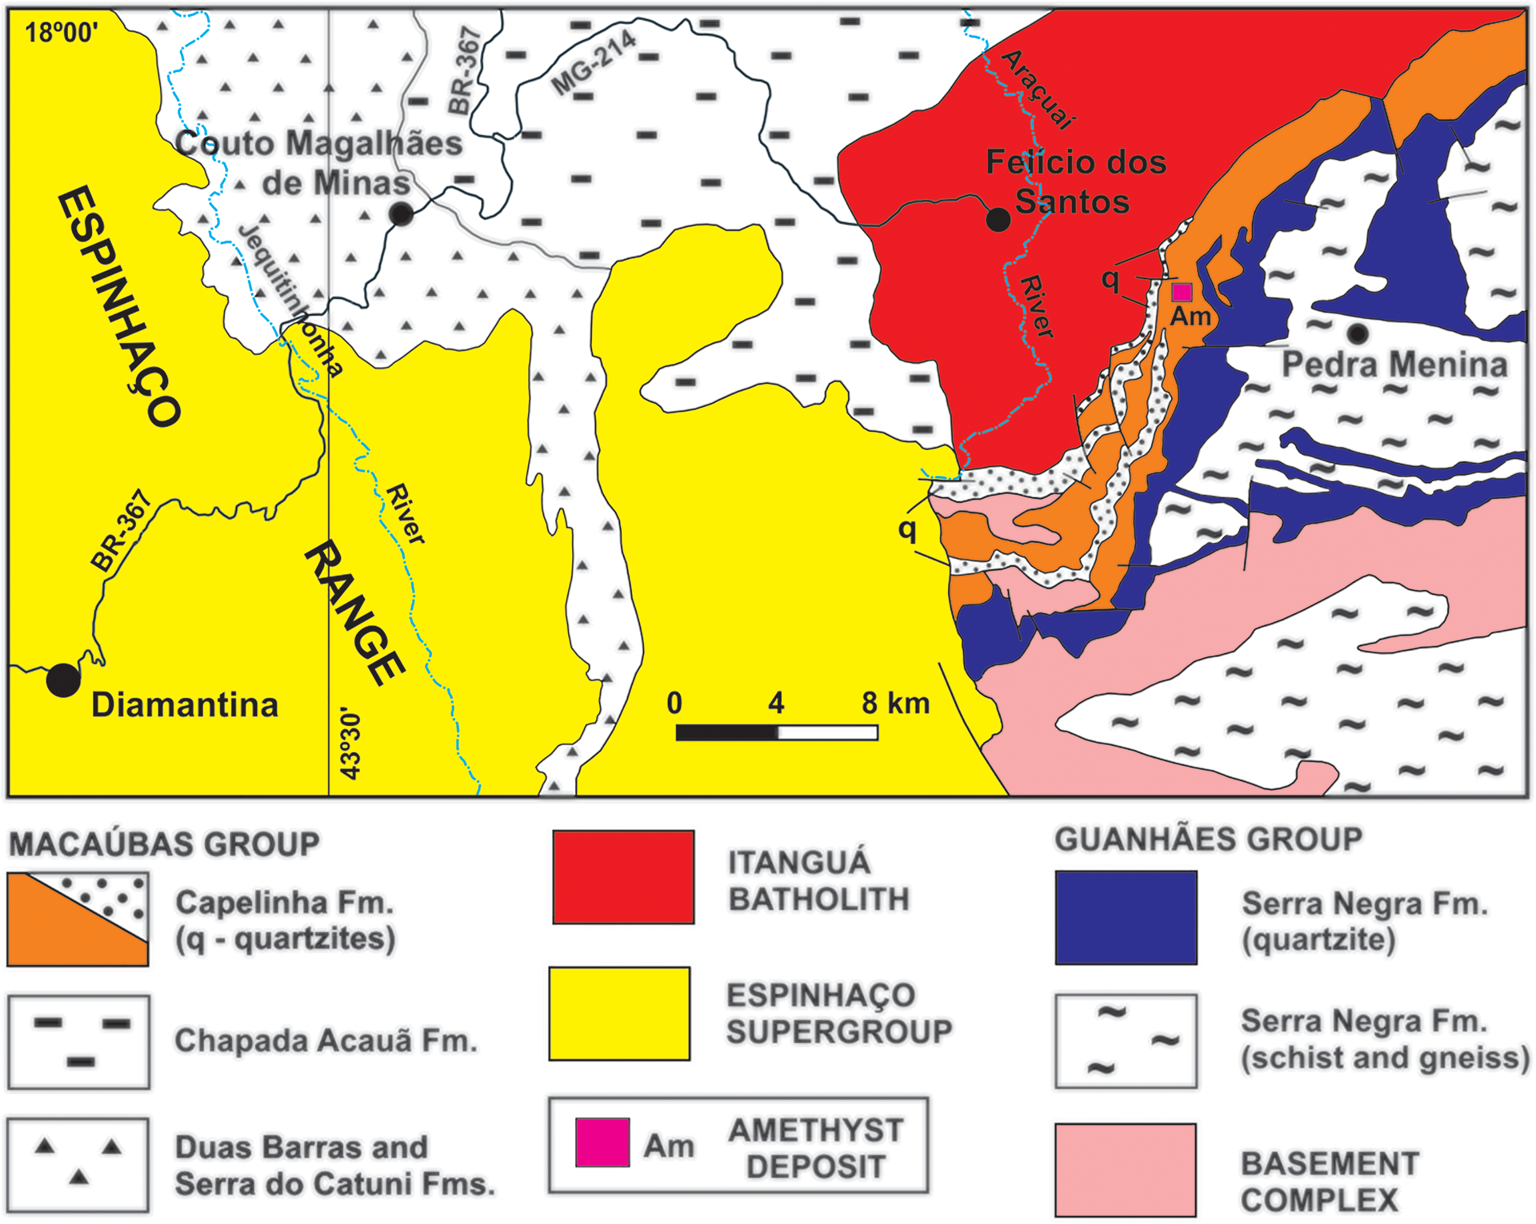
Fig. 6. Simplified geological context of Felício dos Santos region. Based on Tupinambá et al. (Reference Tupinambá, Baars, Uhlein, Grossi-Sad and Knauer2012) and Fogaça (Reference Fogaça2012).
The Felício dos Santos amethyst mineralisation forms decametric-to-metric lenticular bodies commonly associated with kaolin. The host mica-quartz schist is extensively weathered (Fig. 7a). Crystals grow over colourless or milky quartz with hematite, with the upper end exhibiting a dark violet hue (Figs 2b,7b). According to Chaves and Coutinho (Reference Chaves and Coutinho1992), the lenses are generally parallel to the host-rock foliation at N40°E/20°NW.
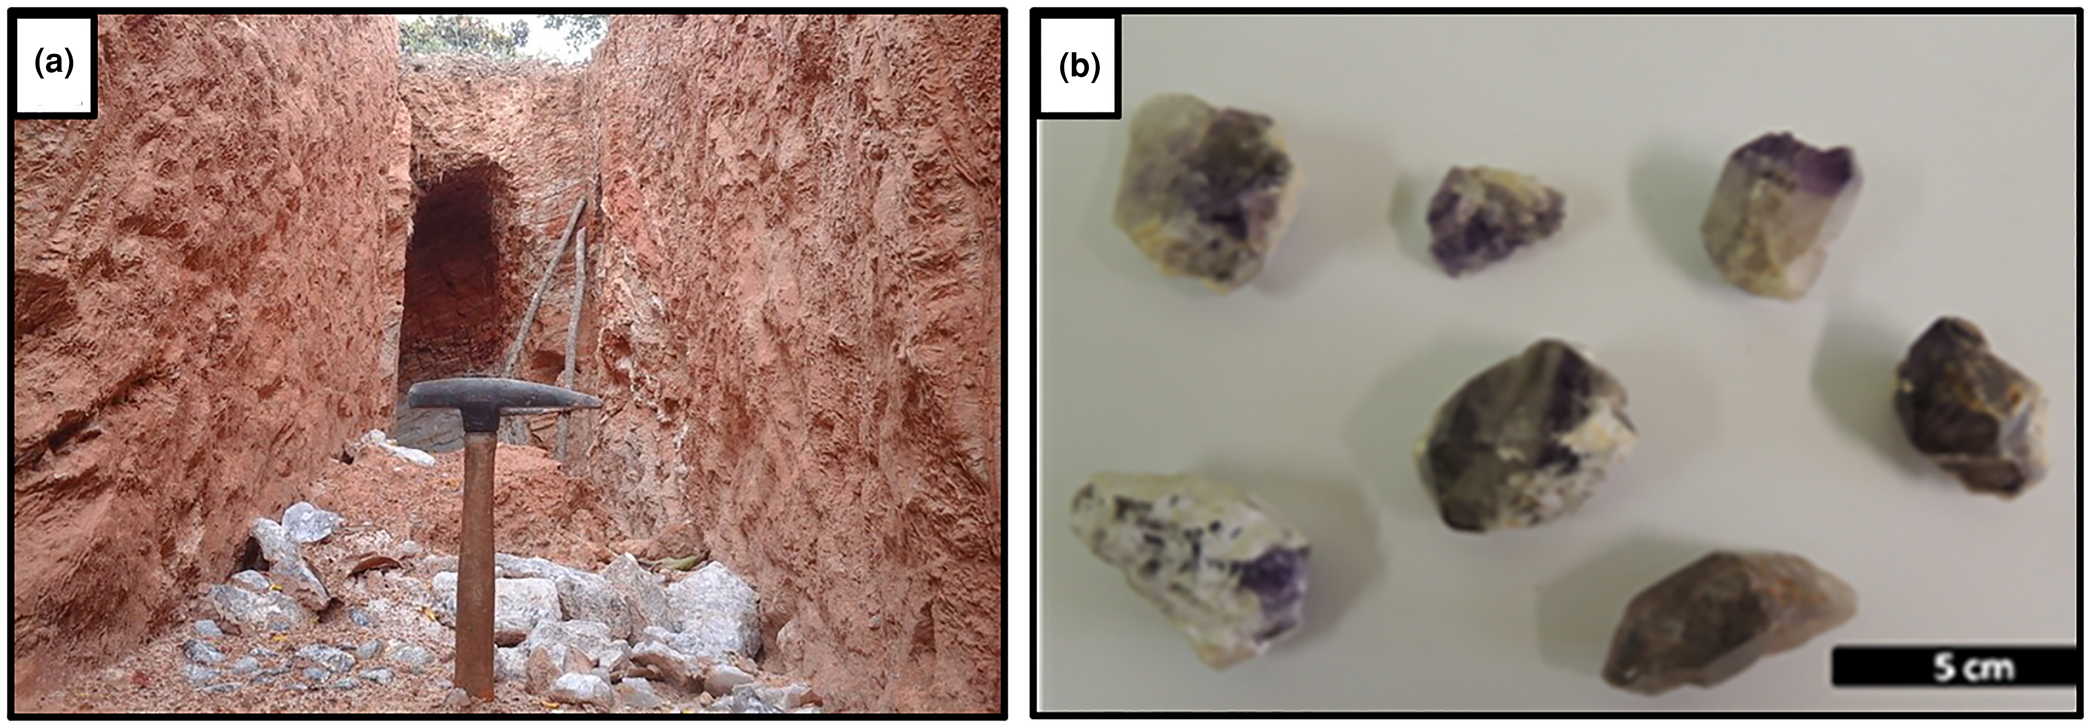
Fig. 7. (a) Recent excavations at Sobrado Farm, Felício dos Santos, in extensively weathered mica-quartz schist, with milky and hyaline quartz fragments; (b) amethyst samples associated with kaolin and milky or colourless quartz. The upper termination of the crystals has a dark violet colour.
Pegmatite amethyst
The pegmatite sample selected is from the Pancas municipality occurrence, in the state of Espírito Santo close to the border with Minas Gerais (Fig. 8). It is commonly difficult to certify the exact origin of these types of crystals, so this sample was selected from a known occurrence outside Minas Gerais. This region consists of granitic and gneissic rocks and is located in the Eastern Brazilian Pegmatite Province, which covers an area of ~150,000 km2. The pegmatite bodies are related to the granitic magmatism developed during the Araçuaí Orogeny (Pedrosa-Soares et al., Reference Pedrosa-Soares2011). Granitic rocks, including pegmatites, have ages ranging from the end of the Neoproterozoic to the Cambro–Ordovician and cover around one third of this region (Dardenne and Schobbenhaus, Reference Dardenne, Schobbenhaus, Bizzi, Schobbenhaus, Vidotti and Gonçalves2003; Pedrosa-Soares et al., Reference Pedrosa-Soares, Chaves and Scholz2009). Vieira et al. (Reference Vieira, Silva, Corrêa and Lopes2013) identified syn- to post-orogenic granitic intrusive rocks from Neoproterozoic and Cambrian suites around Pancas.

Fig. 8. Simplified geological context of the Pancas region. Based on Leite et al. (Reference Leite, Schobbenhaus, Gonçalves, Santos, Abram, Leão Neto, Matos, Vidotti, Ramos and de Jesus2004).
The Pancas amethyst occurrence is located at the Itajobi Farm, where post-collisional Carlos Chagas Batolith crops out. In this region, pegmatites are usually tabular, up to 2 m in thickness and poorly differentiated, with no apparent zoning. Aquamarine and chrysoberyl are the main products of the local mining activity, extracted from both altered pegmatites and secondary alluvial deposits. Amethyst, in addition to milky, hyaline, smoky and morion quartz varieties, occurs in cavities covered with druses in intensely weathered pegmatites, or associated with placer deposits. The samples collected from the cavities show massive hyaline quartz at the base, on which the amethyst crystals and several parallel lines of solid hematite inclusions have overgrown (Fig. 3).
Results
Mapping and classification of fluid inclusions
Basalt cavity amethyst – T1
Sample T1 presents only one-phase aqueous inclusions (Fig. 9), which do not allow homogenisation temperatures to be obtained from heating tests and consequently, will not be considered further. The fluid inclusions are rounded and generally elongated, with a larger dimension between 100 and <1 μm, arranged in trails and clouds inside the crystal (Fig. 9a) or filling healed fractures with necking-down features such as elongated shape, sharp edges and signs that the fluids inside the inclusion have leaked (Fig. 9b). They were classified as pseudo-secondary. Moreover, the absence of primary fluid inclusions could be explained by a post-crystallisation deformational event.
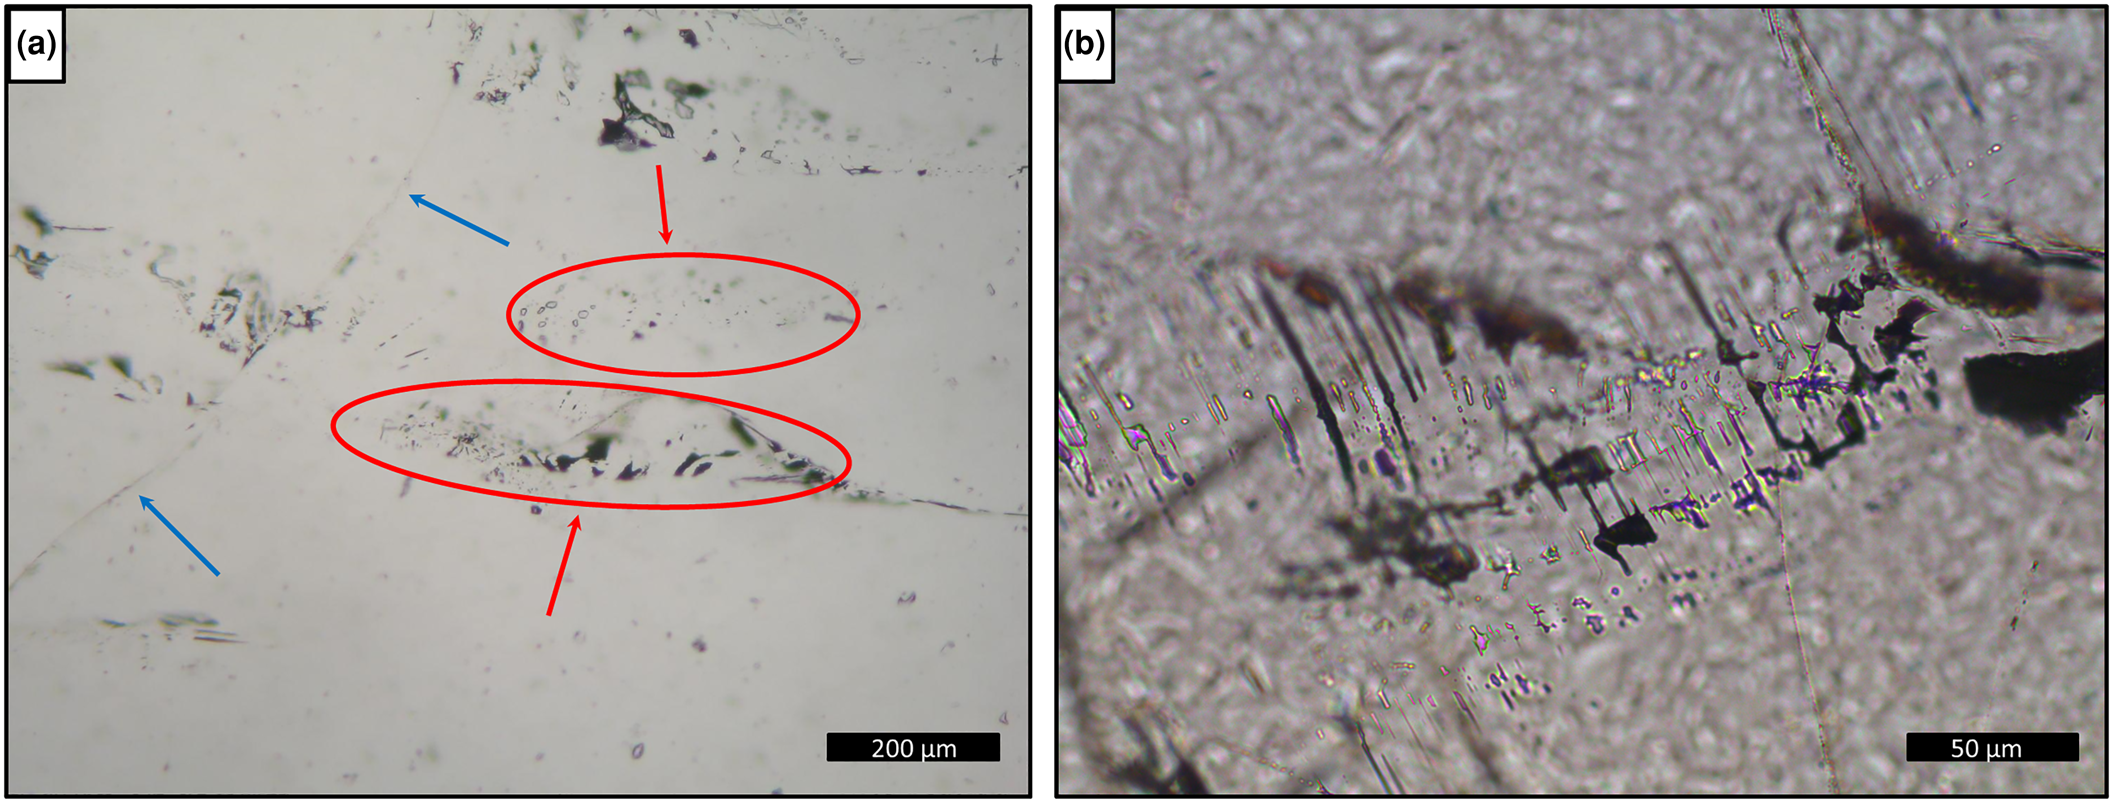
Fig. 9. Photomicrographies of fluid inclusions in basalt cavity amethyst, sample T1: (a) trails (blue arrows) and clouds (red arrows and ellipses) of one-phase inclusions inside the crystal; and (b) detail of elongated one-phase inclusions with necking-down features.
Hydrothermal vein amethyst – FS1 and FS2
Sample FS1 (Fig. 10) has both one-phase and two- or three-phase fluid inclusions. The thin section investigated was made from a single crystal. The approximate c axis direction is shown on Fig 10a. Several trails parallel to this direction were observed through the smallest magnification of the petrographic microscope (×2.5). Several other trails are observed perpendicular or oblique to the first ones, in addition to fractures without preferential direction. These are indicative of possible deformation processes after the mineral crystallisation. Most of the inclusions on these trails are not preserved, which could be explained by stretching and decrepitation of fluid inclusions during post-trapping deformation.
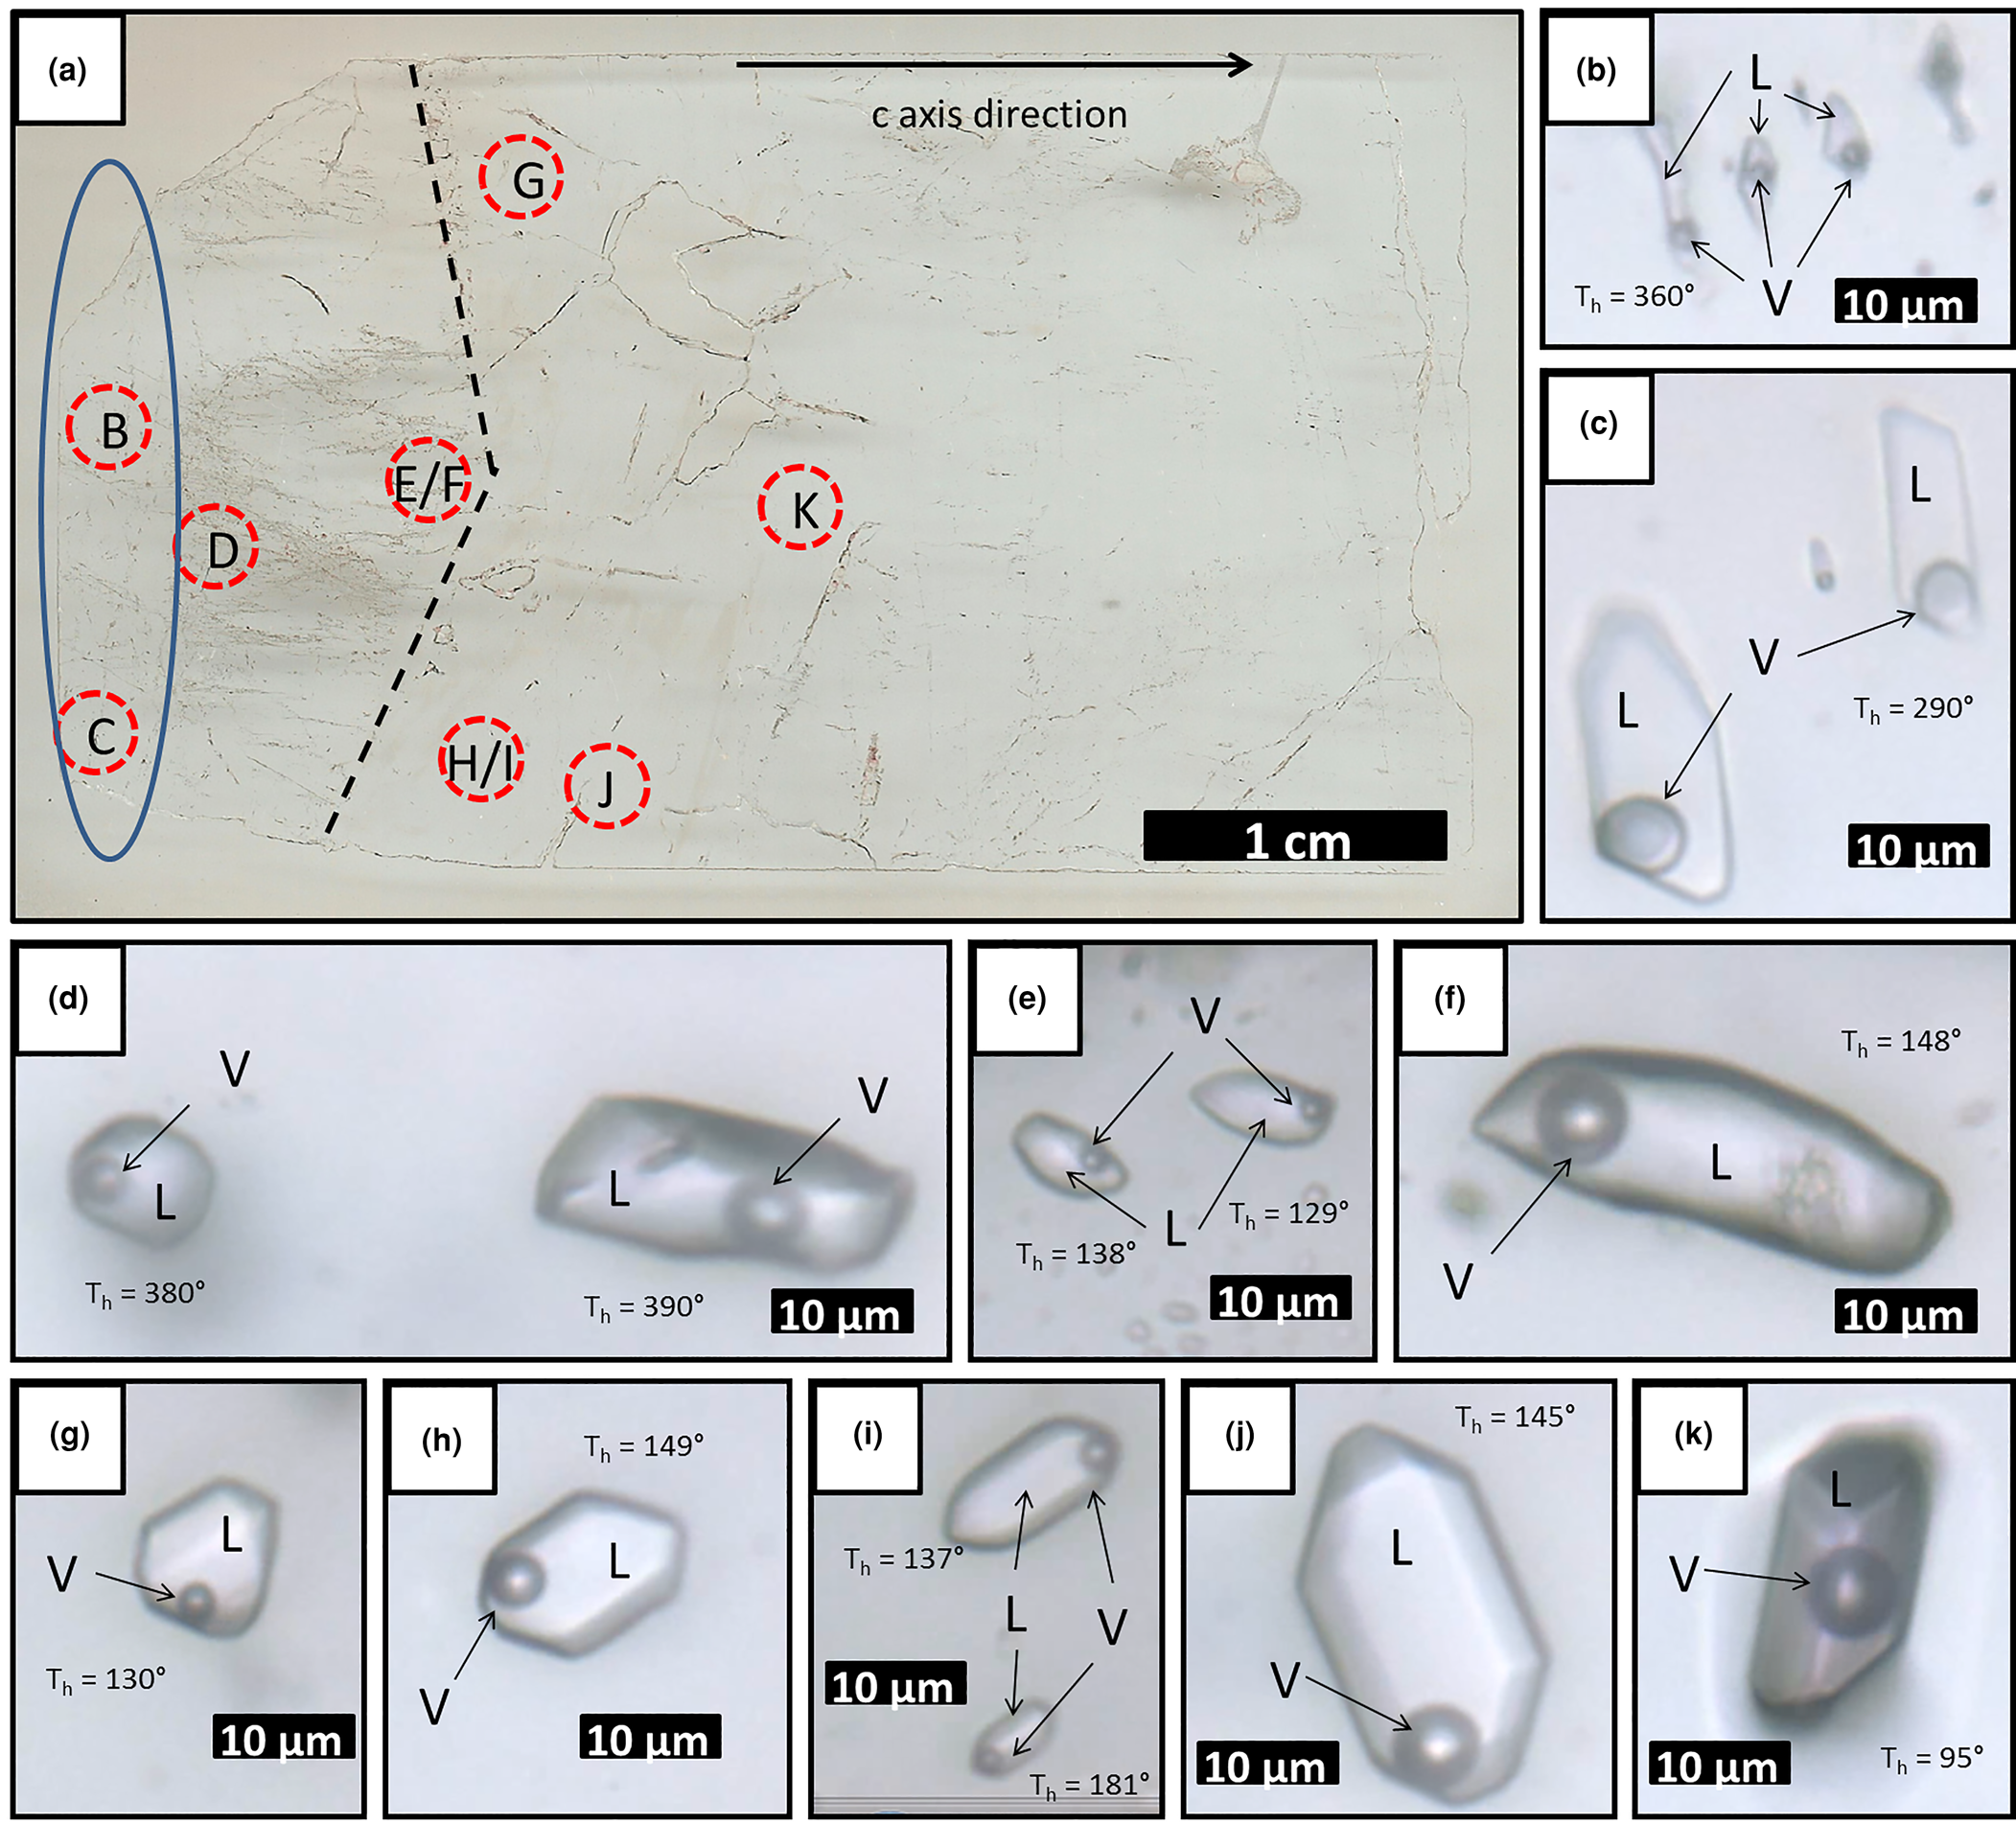
Fig. 10. (a) Scanned surface of hydrothermal vein sample FS1, showing location of photomicrographs B to K; (b–d) type II two-phase aqueous fluid inclusions (×100 zoom); (e–k) type III two-phase aqueous fluid inclusions (×100 zoom). Dashed line shows a growth zone; ellipse delimitates the region of occurrence of aqueous carbonic inclusions. L: aqueous liquid; V: water vapour; Th: total homogenisation temperature.
The main fluid inclusions within sample FS1 (Figs 10, 11) are classified as types I, II, III and IV. In this sample, type I inclusions are three-phase aqueous carbonic (water, liquid CO2 and vapour), with a variable CO2 volume ratio of 50–80% in relation to total inclusion volume. They are polygonal-to-elongated with the largest dimension reaching 50 μm, commonly with negative crystal shapes. Type I inclusions are distributed in planes, clusters or trails that are limited to the interior of the crystal, being classified as pseudo-secondary (Fig. 11).

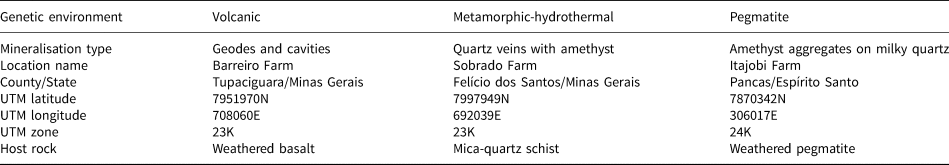
Fig. 11. Photomicrographies of type I three-phase aqueouscarbonic fluid inclusions trapped in amethyst quartz from hydrothermal vein sample FS1. ${\rm L}_{{\rm H}_2{\rm O}}$ : aqueous liquid; ${\rm L}_{{\rm C}{\rm O}_2}$
 : CO2 liquid; ${\rm V}_{{\rm C}{\rm O}_2}$
 : CO2 vapour; Th: total homogenisation temperature.
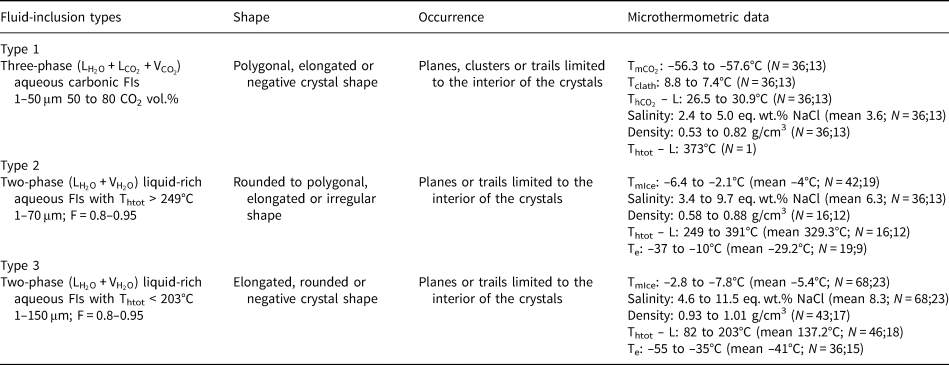
Most inclusions are two-phase aqueous fluid inclusions, with low vapour ratios of 5–20% in relation to total inclusion volume. Based on heating test results, these inclusions were differentiated as types II (high T, with homogenisation temperatures above 249°C) and III (low T, with homogenisation temperatures below 203°C). Type II inclusions are rounded to polygonal, elongated or irregular, and can be up to 70 μm in length. They are distributed in planes or trails that are limited to the interior of the crystal and are classified as pseudo-secondary. They only occur at the base of the crystal, before the growth line shown on Fig. 10a. Type III inclusions are rounded to polygonal, elongated or negative crystal shape, and can be up to 150 μm in length. They are distributed in planes or trails that are limited to the interior of the crystal and are also classified as pseudo-secondary. Unlike type II inclusions, they occur after, or close to, the growth line shown on Fig. 10a. Type IV inclusions are one-phase aqueous, rounded to elongated or irregular in shape, and up to 30 μm in length. They are preferentially distributed in trails cutting through the crystal or planes of different depths within it, and are classified as secondary.
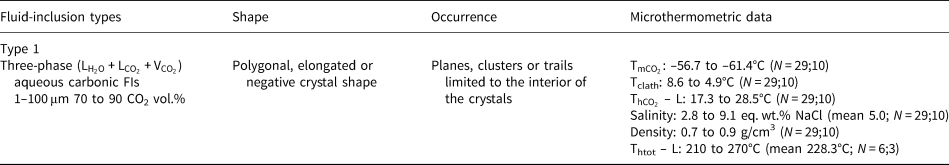
Fluid inclusions can locally show necking-down features, such as elongated shape, sharp edges and signs that the fluid inside the inclusion has leaked, which may suggest deformation after their trapping. These inclusion types were not considered. No inclusions were classified as primary because characteristics such as preserved inclusions in growth zones, or isolated inclusions were not easy to distinguish. The microthermometric measurements were performed only in types I, II and III inclusions, classified as pseudo-secondary that would be related to the crystallisation conditions of the amethyst. Sample FS2 contains both one-, two- and three-phase fluid inclusions, with dominant one-phase aqueous inclusions. The thin section studied was made from a single crystal (Fig. 12). The main types of fluid inclusions are described as types I, II and III. Type I inclusions are three-phase aqueous carbonic (water, liquid CO2 and vapour), with a high CO2 volume ratio of 70–90% of total inclusion volume. These are polygonal-to-elongated, commonly with a negative crystal shape, and can reach 100 μm in the largest dimension. Type I inclusions are distributed along planes, clusters or trails that are limited to the interior of the crystal, and are classified as pseudo-secondary (Fig. 13a–d).

Fig. 12. (a) Thin section sketch of hydrothermal vein sample FS2, with significant fractures and regions selected for cutting; (b) chip I after making the cuts with a cutting wheel, in the regions indicated in (a), showing FIAs measured; and (c) photomicrograph of hematite solid inclusions observed in this sample.

Fig. 13. (a) Hydrothermal vein sample FS2, showing part of chip I and blue mark where the chip was cut, FIA 5 deliniated on the right (×2.5 zoom); (b) type I three-phase aqueouscarbonic inclusions cloud – FIA 5, red dashed line marks the inclusion shown in (c) (×10 zoom); (c) FIA 5 inclusion in detail (×50 zoom); (d) FIA 5 inclusions in detail (×100 zoom); (e) FIA of type II two-phase aqueous inclusions crosscutting a FIA of type I very small aqueous carbonic inclusions (×10 zoom); and (f) clusters of type III one-phase aqueous inclusions and trails of types II and III inclusions.
Type II are two-phase aqueous fluid inclusions, with low vapour ratios of 5–10% of the total inclusion volume. Those inclusions are polygonal, elongated or irregular, and can be up to 70 μm in length. They are distributed in planes or trails that are limited to the interior of the crystal, being classified as pseudo-secondary (Fig. 8e). Type III inclusions are one-phase aqueous, rounded-to-elongated or irregular in shape, and up to 30 μm in length. They are distributed mostly in trails that cut through the crystal, or planes of different depths within it, and are classified as secondary (Fig. 13f).
The fluid inclusions of the three types described can also show necking-down features. Types II and III inclusions are generally small and phase changes are difficult to observe. Thus, the microthermometric measurements were performed only in the type I inclusions, classified as pseudo-secondary. Numerous hematite solid inclusions can be observed with the naked eye inside the crystals (Fig. 12c).
Pegmatite amethyst – P1
Fluid inclusions trapped in sample P1 (Fig. 14) occur as trails or clusters with different spatial orientations. The thin section studied was cut from a crystal aggregate with hyaline quartz at its base and amethyst at the top. An approximate c axis direction is shown on Fig 14a. The two types of quartz are separated by a rough band of hematite solid inclusions. Several other hematite inclusions are observed perpendicular to growth zones and most of the inclusions on these zones are not preserved.
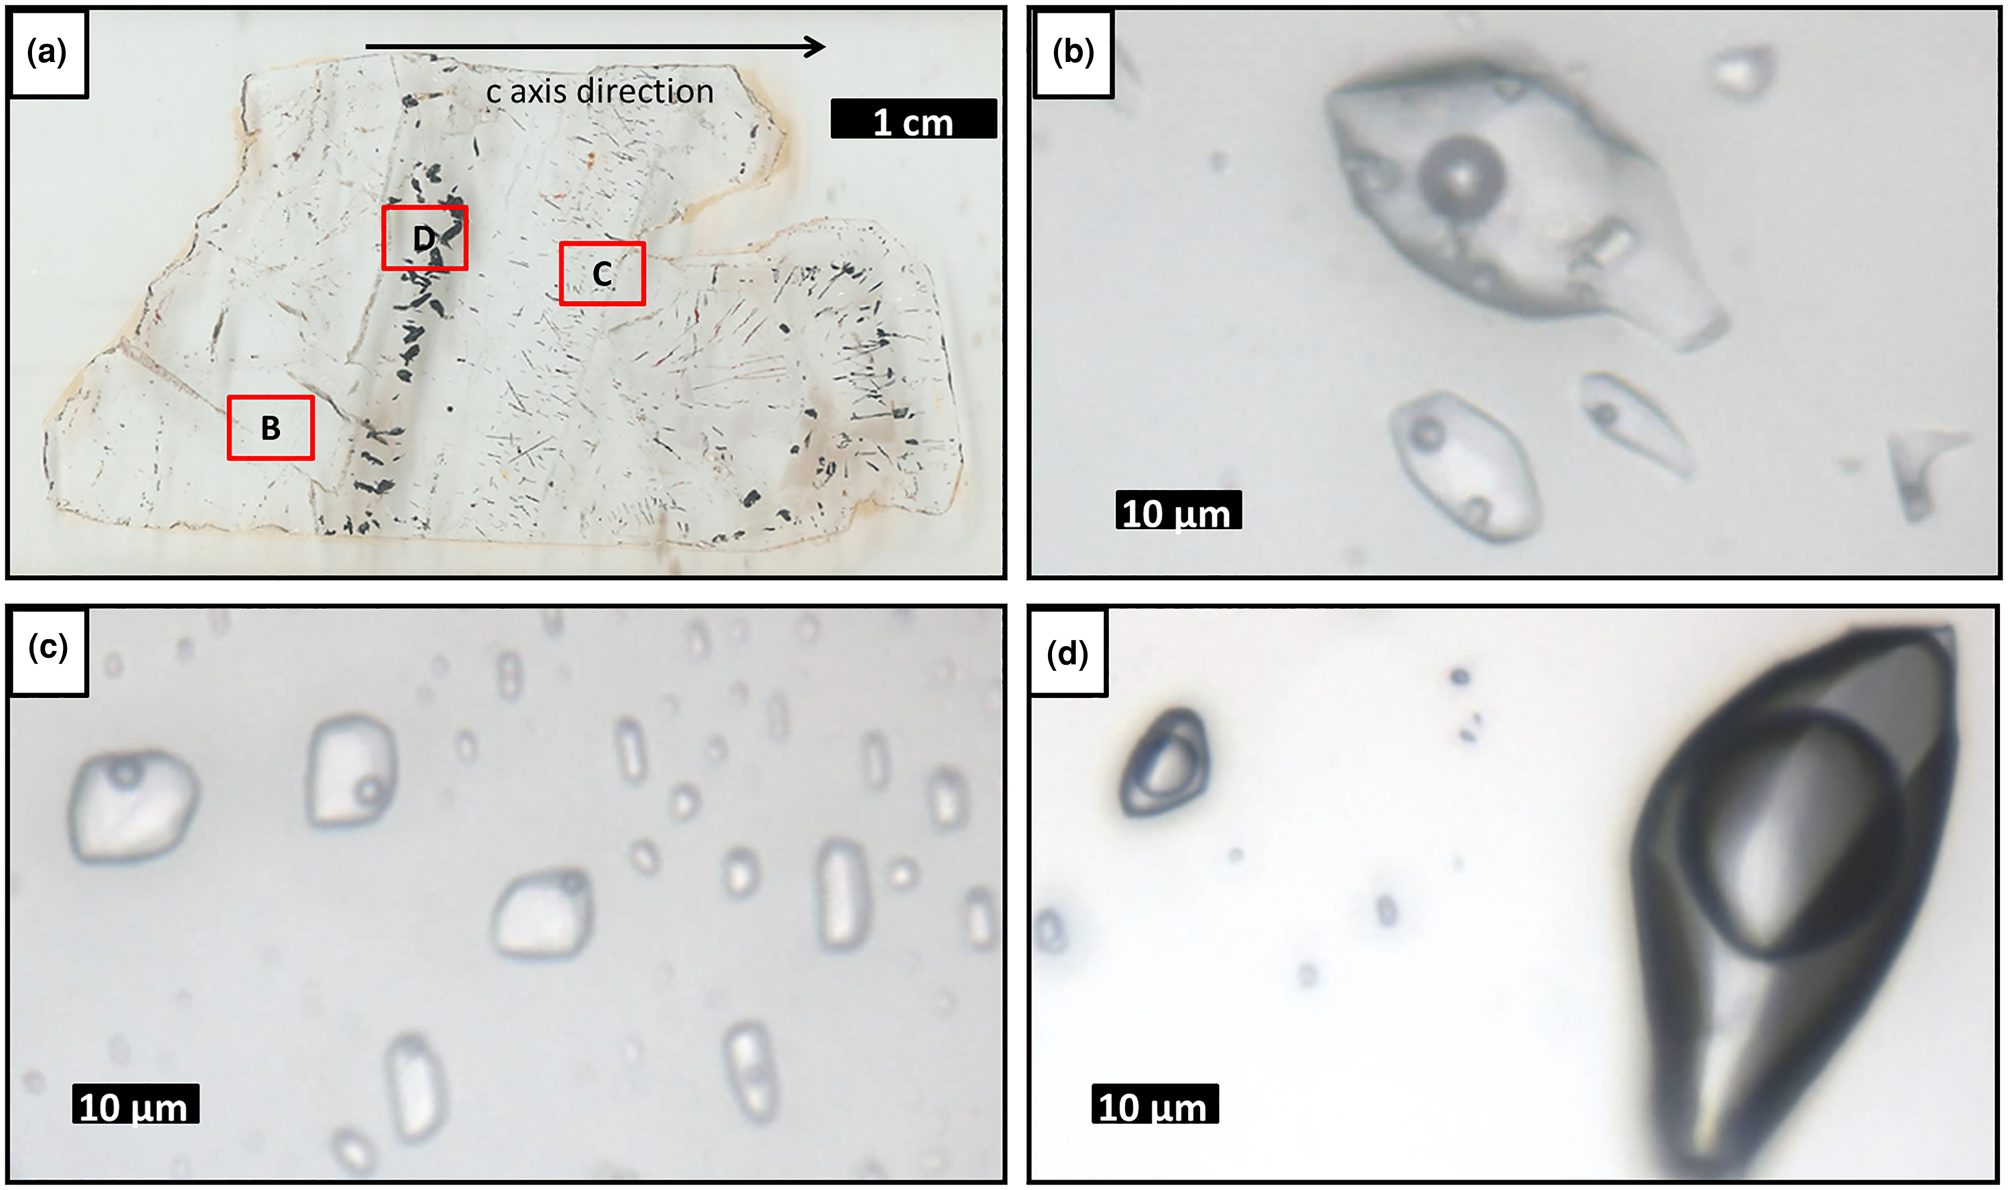
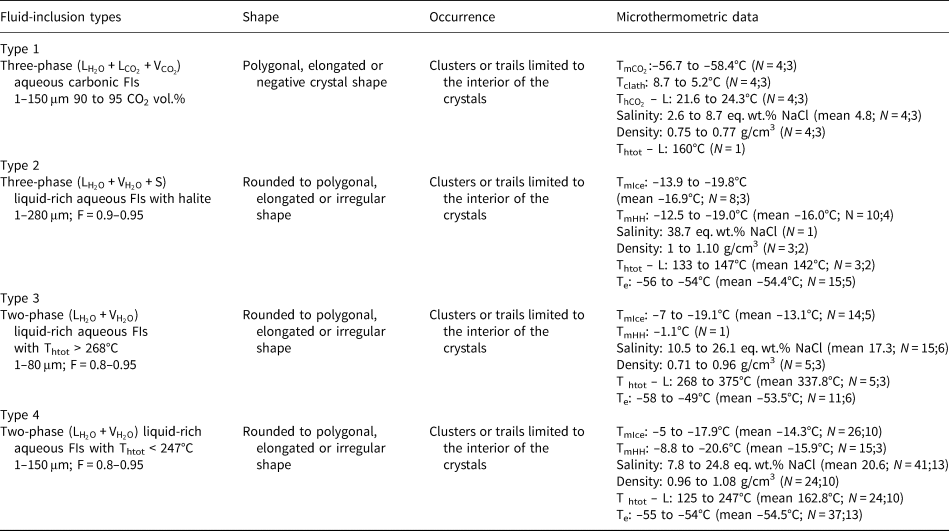
Fig. 14. (a) Pegmatite sample P1, showing location of (b), (c) and (d); (b) type II three-phase aqueous inclusions FIA; (c) type III two-phase aqueous inclusions FIA; and (d) type I three-phase aqueouscarbonic inclusions FIA.
The fluid inclusions are described as types I, II, III and IV. Type I inclusions are three-phase aqueous carbonic (water, liquid CO2 and vapour), with a CO2 volume ratio of 90–95% of the total inclusion volume. They are polygonal-to-elongated, commonly with negative crystal shapes, and can reach up to 150 μm. These are distributed in clouds or trails that are limited to the interior of the crystal, being classified as pseudo-secondary (Fig. 14d).
Type II are three-phase (liquid, vapour and solid) aqueous fluid inclusions with precipitated halite, showing a low vapour ratio of 5–10% in relation to the total inclusion volume. They have rounded-to-polygonal, elongated or irregular shapes, with sizes reaching up to 280 μm, although larger inclusions are almost always stretched. Type II inclusions are distributed in clusters or trails that are limited to the interior of the crystal, and are classified as pseudo-secondary (Fig. 14b). Two-phase aqueous (liquid and vapour) inclusions also occur. On the basis of heating test results, they were separated into types III (high T, with homogenisation temperatures above 268°C) and IV (low T, with homogenisation temperatures below 247°C). Both type III and type IV fluid inclusions have rounded-to-polygonal, elongated or irregular shapes. These are also distributed in clusters or trails that are limited to the interior of the crystal, being classified as pseudo-secondary (Fig. 14c).
Microthermometry of the fluid inclusions
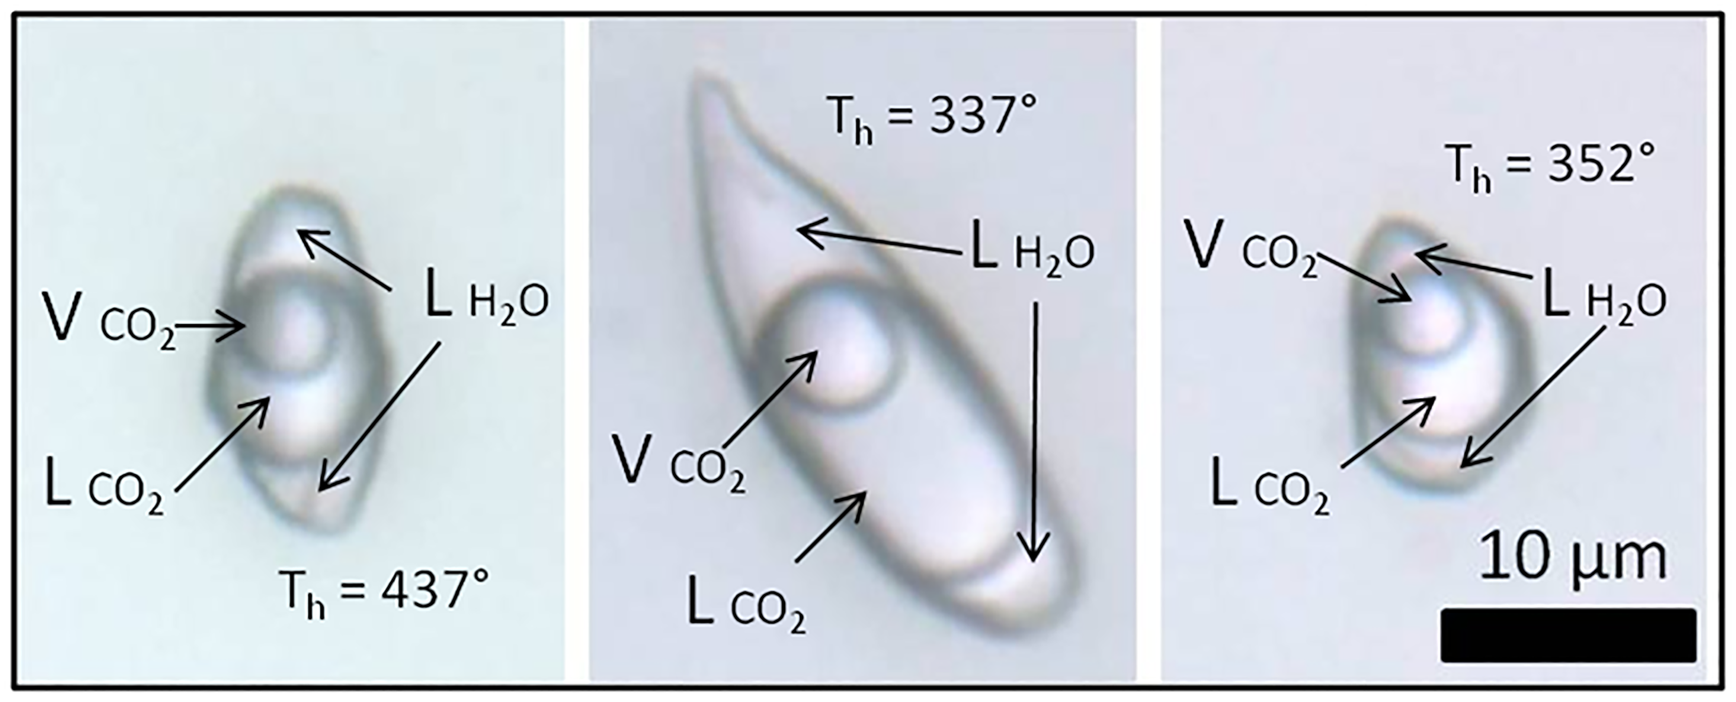
Data obtained from freezing and heating experiments are summarised on Tables 2, 3 and 4. It was difficult to determine the eutectic melting temperature (Te) in most of the observed inclusions, however, an estimation of the Te of H2O–NaCl (–21.2°C) was used to discriminate the presence of other cations in addition to Na in aqueous inclusions from both hydrothermal vein and pegmatite samples (Fig. 15a). Eutectic temperatures below –30°C were observed in samples FS1 (types II and III) and P1 (types II, III and IV), and below –50°C in samples FS1 (type III) and P1 (types II, III and IV), indicating the presence of cations such as Ca and Fe other than Na. Also, eutectic temperatures around –11°C observed in type II fluid inclusions from sample FS1 could indicate the presence of a H2O–KCl system composition.

Fig. 15. Histograms of: eutectic (Te); final ice melting (TmIce); clathrate melting (Tclath); and total homogenisation temperatures (Thtot) for the samples from hydrothermal vein (FS1 and FS2) and pegmatite (P1).
Table 2. Microthermometric results of pseudo-secondary fluid-inclusion assemblages in amethyst samples from Felício dos Santos’ hydrothermal vein (FS1).

L: liquid; V: vapour; F: degree of fill; N: number of inclusions measured; number of FIAs; ${\rm T}_{{\rm mC}{\rm O}_ 2}$ : CO2 melting temperature; Tclath: temperature of clathrate melting; ${\rm T}_{{\rm hC}{\rm O}_ 2}$
 – L: homogenisation temperature of CO2 phases to liquid; Te: temperature of first ice melting; TmIce: temperature of last ice melting; Thtot – L: homogenisation temperature to liquid phase.
Table 3. Microthermometric results of pseudo-secondary fluid-inclusion assemblages in amethyst samples from Felício dos Santos’ hydrothermal vein (FS2).

L: liquid; V: vapour; N: number of inclusions measured; number of FIAs; ${\rm T}_{{\rm mC}{\rm O}_ 2}$ : CO2 melting temperature; Tclath: temperature of clathrate melting; ${\rm T}_{{\rm hC}{\rm O}_ 2}$
 – L: homogenisation temperature of CO2 phases to liquid; Thtot – L: homogenisation temperature to liquid phase.
Table 4. Microthermometric results of pseudo-secondary fluid-inclusion assemblages in amethyst samples from Pancas pegmatite (P1).
L: liquid; V: vapour; F: degree of fill; N: number of inclusions measured; number of FIAs; ${\rm T}_{{\rm mC}{\rm O}_ 2}$ :CO2 melting temperature; Tclath: temperature of clathrate melting; ${\rm T}_{{\rm hC}{\rm O}_ 2}$
 – L: homogenisation temperature of CO2 phases to liquid; Te: temperature of first ice melting; TmIce: temperature of last ice melting; TmHH: temperature of hydrohalite melting; Thtot – L: homogenisation temperature to liquid phase.
A homogenisation temperature was only observed in some aqueous carbonic inclusions, as the separation between aqueous and carbonic phases seem to remain until the end of heating tests and most inclusions decrepitated during other tests. Consequently, few homogenisation temperatures could be determined for these types of inclusions. Due to the decrepitation of many fluid inclusions during the heating tests, only 99 homogenisation temperature measurements were obtained, most of them in aqueous inclusions (Fig. 15d).
Hydrothermal vein amethyst – FS1 and FS2
In sample FS1, type I inclusions show salinity values varying from 2.4 to 5.0 eq. wt.% NaCl. Only one homogenisation temperature of 373°C was observed (Table 2) through expansion of the CO2 phase (Table 2). Salinities were obtained from clathrate melting temperatures. For type II inclusions, the salinities were obtained from ice melting temperatures and vary in a wider range between 3.4 and 9.7 eq. wt.% NaCl. Homogenisation temperatures, observed through homogenisation into the liquid phase, vary between 249°C and 391°C (Fig. 15d, Table 2). Salinity values for type III inclusions were also obtained from ice melting temperatures, and range between 4.6 and 11.5 eq. wt.% NaCl. Homogenisation to a liquid phase was observed at temperatures ranging from 82°C to 203°C. For type I inclusions within sample FS2, the salinities obtained from clathrate melting temperatures are between 2.8 and 9.1 eq. wt.% NaCl, with homogenisation temperatures varying between 210°C and 270°C (Fig. 15d, Table 3) observed through expansion of the CO2 phase.
Pegmatite amethyst – P1
Type I inclusions have salinities between 2.6 and 8.7 eq. wt.% NaCl, obtained from clathrate melting temperatures. Only one homogenisation temperature of 160°C (Table 4) was observed through expansion of the CO2 phase. For type II inclusions, only one salinity value of 38.71 eq. wt.% NaCl was obtained, through observation of the halite final dissolution temperature. Other inclusions do not show dissolution of solid phases until greater than 400°C. Partial homogenisation temperatures (homogenisation of liquid and vapour phases) vary between 133°C and 147°C (Fig. 15d, Table 4) and were observed through homogenisation into a liquid phase. Type III inclusions show salinities varying in a wider range from 10.5 to 26.1% eq. wt.% NaCl, obtained from ice or hydrohalite melting temperatures, and homogenisation temperatures between 268°C and 375°C (Fig. 15, Table 4) observed through homogenisation into a liquid phase.
Raman spectroscopy of the fluid inclusions
Hydrothermal vein amethyst – FS2
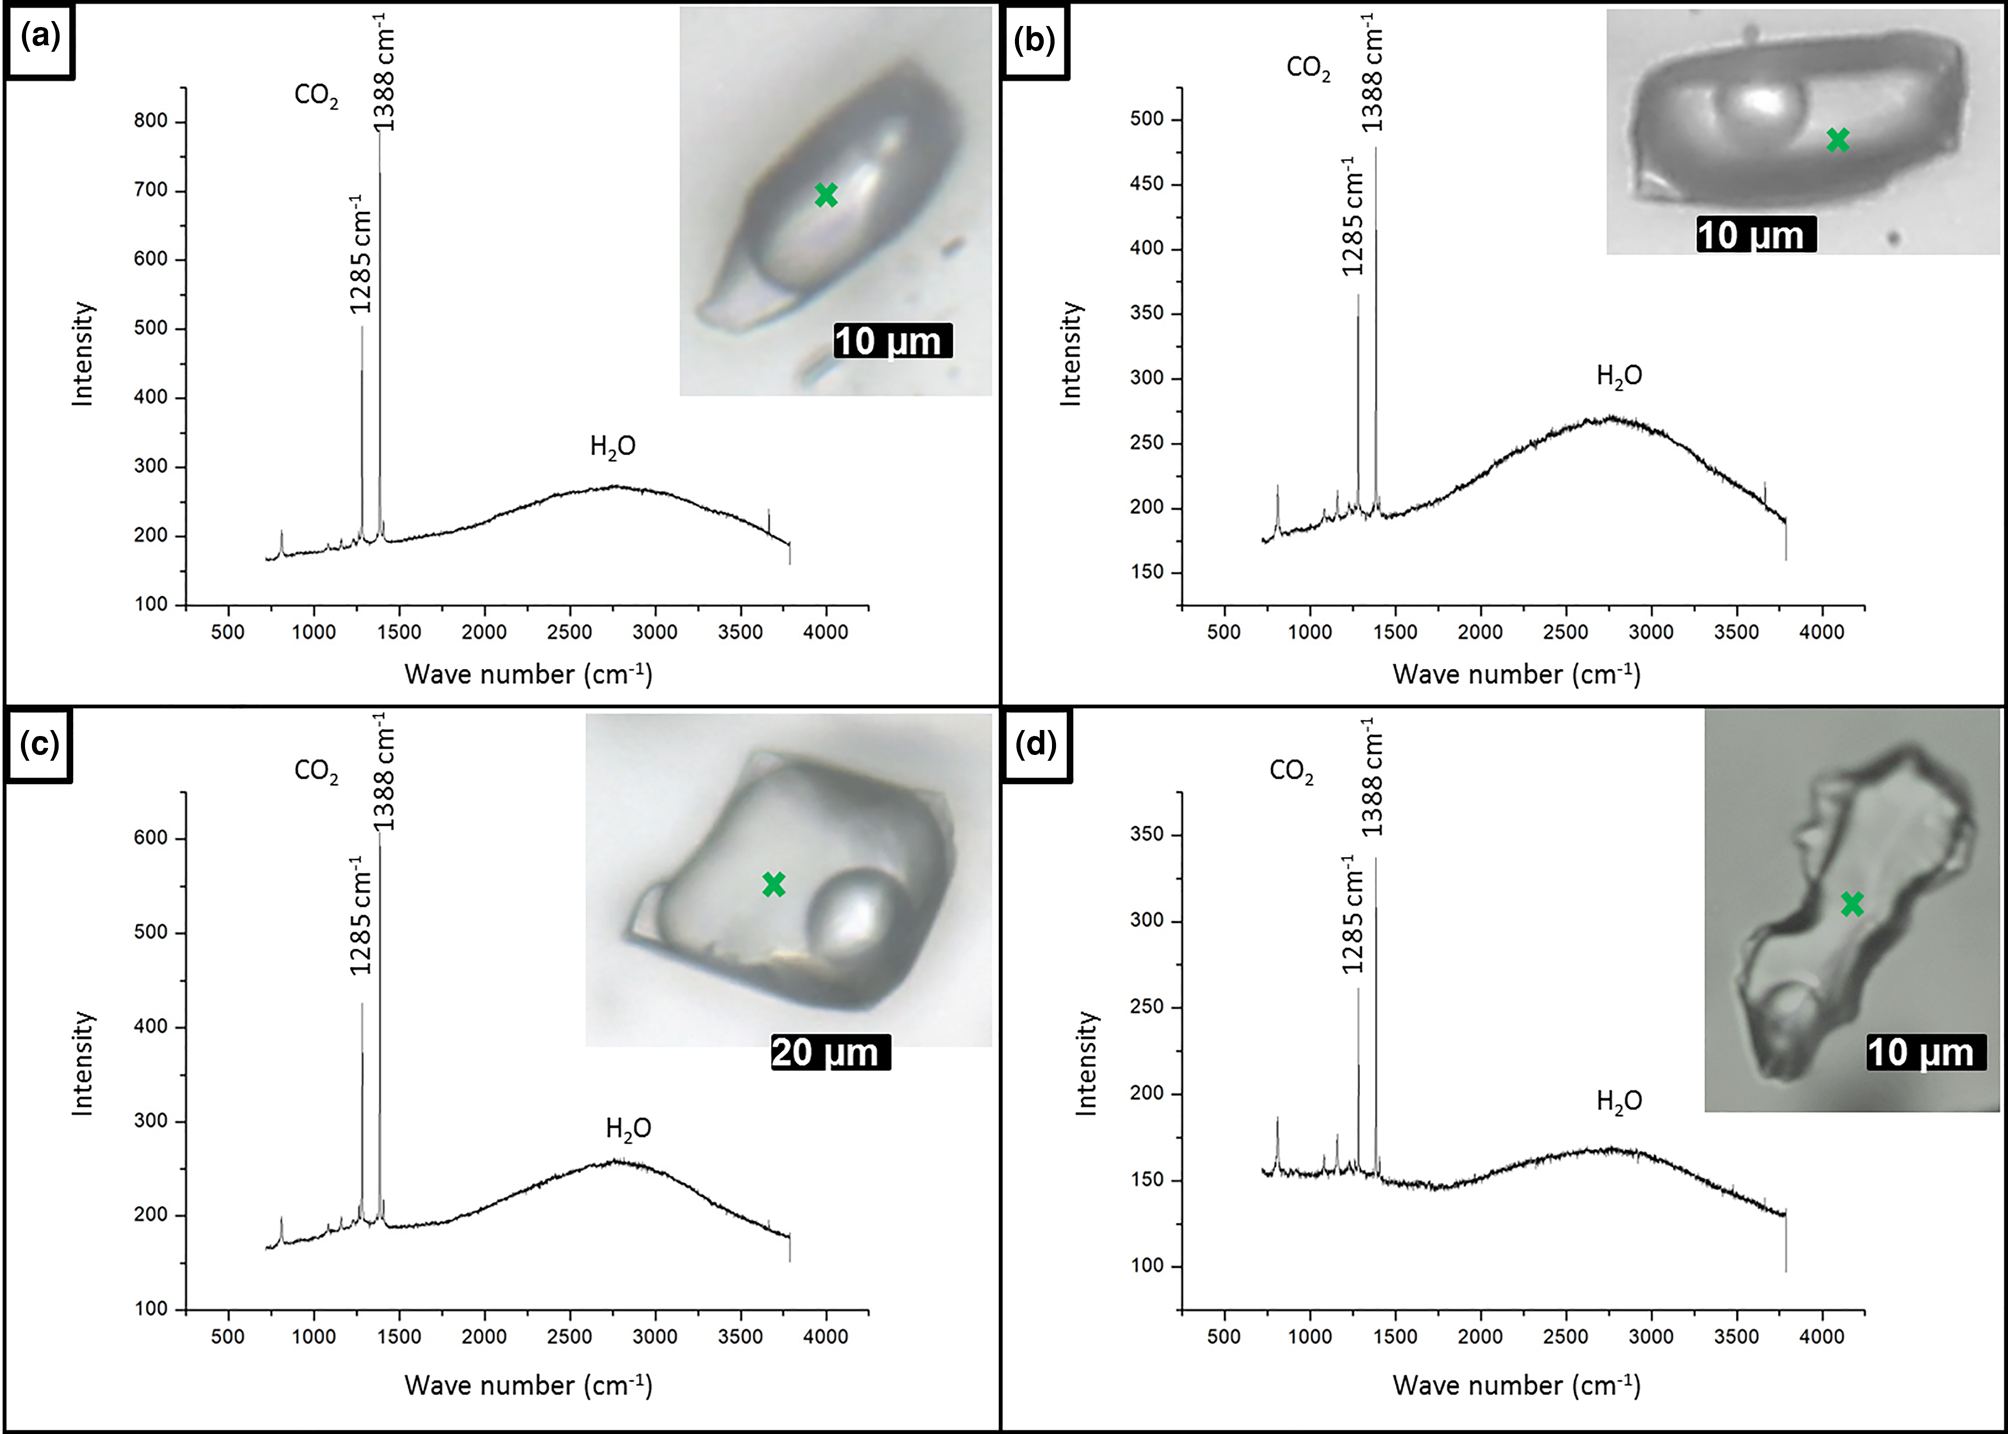
As the measured CO2 melting temperatures are below the expected value of –56.6°C (between –56.3°C and –61.4°C, with average value of –57.3°C), the presence of different gases dissolved within the carbonic phase is suggested, e.g. CH4, as it could result in lower CO2 melting temperatures. In order to run Raman spectroscopic analyses, the sample FS2 was chosen because of its high content of aqueous carbonic inclusions. Carbonic inclusions of larger size were selected to aid laser positioning. The spectra shown in Fig. 16 confirms the presence of gaseous CO2 with the peaks at 1285 and 1388 cm–1 (stretching vibrations), but do not show the main CH4 peak at 2917 cm–1 (Frezzotti et al. Reference Frezzotti, Tecce and Casagli2012). Therefore, it was considered that carbonic phases are composed of pure CO2 for further calculations. Bands other than 1285 and 1388 cm–1 were also present in quartz Raman spectra, and were assigned to the fluid-inclusions host mineral.

Fig. 16. Raman analyses of type I aqueous carbonic inclusions from sample FS2 chip I: (a) FIA 1; (b) FIA 5; (c) FIA 6; and (d) FIA 6a. Green crosses mark approximate analysis spots.
Discussion
Mapping of the basalt cavity amethyst sample (T1) revealed mostly one-phase aqueous fluid inclusions suggesting a low-temperature formation environment for this type of amethyst. This is corroborated by the data of Juchem (Reference Juchem1999), who described samples of amethyst from volcanic rocks of Rio Grande do Sul State. Fluid-inclusion data from Gilg et al. (Reference Gilg, Morteani, Kostitsyn, Preinfalk, Gatter and Strieder2003, Reference Gilg, Balzer and Gilg2012), also from amethyst in basaltic geodes from Rio Grande do Sul, indicate temperatures below 100°C during filling of the geodes, similarly to the results presented by Commin-Fischer et al. (Reference Commin-Fischer, Berger, Polvé, Dubois, Sardini, Beaufort and Formoso2010). These authors have described the crystallisation of amethyst in this type of environment with low-salinity fluids, between 2 and 8 eq. wt.% NaCl.
Samples from the hydrothermal veins (FS1 and FS2) show salinities varying between 2.4 and 12.5 wt.%, representing low-to-moderate salinity fluids. At least two generations of fluids can be considered. The first, containing both aqueous and carbonic phases, have minimum trapping temperatures between 249°C and 391°C. Lower eutectic temperatures observed in aqueous inclusions with higher homogenisation temperatures indicate other cations such as Fe in addition to Na. The carbonic composition of the system H2O–CO2–NaCl, which was confirmed by Raman spectroscopy analyses, suggests a metamorphic and/or magmatic source for the fluids. Metamorphic fluids would be originated by regional metamorphism associated with the Araçuaí Orogeny, whereas magmatic fluids would be derived from granitic magmatism generated during the same orogenic process. However, further studies such as oxygen stable isotope analysis are necessary to assess the fluid origin. The second generation of lower-temperature fluids shows minimum trapping temperatures varying from 82°C to 203°C. Fluid inclusions of this group record lower eutectic temperatures that indicate the presence of Ca and Fe cations in addition to Na. Amethyst from pegmatite (P1) contains fluid inclusions with variable, though mostly high, salinities of 2.6–38.7 eq. wt.% NaCl. Most salinity values lie between 15 and 25 eq. wt.% NaCl, reflecting an elevated salt content in pegmatitic fluids. These represent residual fluids from the solidification of a magmatic intrusion, generally rich in volatiles, incompatible elements and anions such as Cl– and F– (London and Kontak, Reference London and Kontak2012). We have interpreted the presence of two generations of fluids for this environment. The first is represented by aqueous fluid inclusions with minimum trapping temperatures ranging from 268°C to 375°C. Estimated eutectic temperatures mainly below –50°C indicate the presence of Ca cations in addition to Na. Minimum trapping temperatures correspond possibly to temperatures of late- to post-pegmatitic hydrothermal stages established by Fersmann (1931, in London, Reference London2008). The second fluid generation contains both aqueous and carbonic phases, and records minimum trapping temperatures between 125°C and 247°C. Salinity values of ~38 wt.% eq. NaCl (or even higher) are recorded in three-phase aqueous fluid inclusions with minimum trapping temperatures between 133°C and 147°C. These inclusions have eutectic temperatures around –55°C, also indicating the presence of Ca in the system. The carbonic composition of the system H2O–CO2–NaCl also indicates a magmatic source for the fluids.
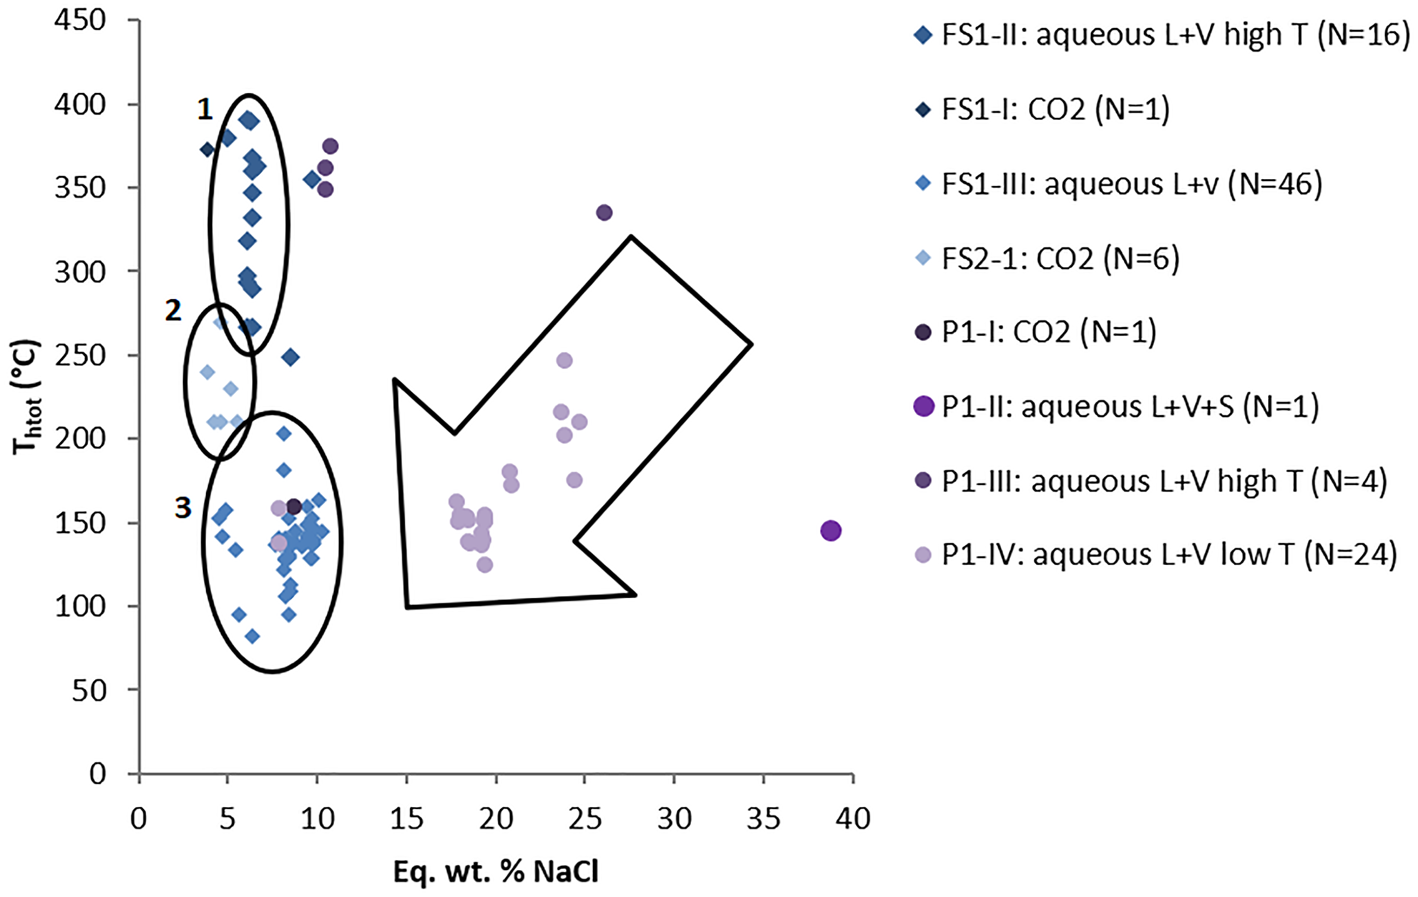
Values of salinity and homogenisation temperatures for both pegmatite and hydrothermal vein samples are plotted on a binary diagram shown on Fig. 17. Sample FS1 displays decreasing homogenisation temperatures, which are delimitated by elipse 1 (high-T aqueous inclusions) and elipse 3 (low-T aqueous inclusions) in Fig. 17, whereas sample FS2 shows a narrower range of homogenisation temperatures, delimitated by ellipse 2 (medium T aqueous carbonic inclusions). In general, samples from hydrothermal veins have a large variation of homogenisation temperatures (82–391°C) with salinity values varying in a narrower range (2.4–11.5 eq. wt.% NaCl); which might represent cooling of the system. Pegmatite sample P1 shows more scattered values with decreasing salinities and homogenisation temperatures, which are mostly located inside the large arrow in Fig. 17. Such a trend could suggest both cooling of the fluid and mixing with fluids of lower temperature and salinity.

Fig. 17. Binary diagram of salinity versus homogenisation temperatures. FS1: Felício dos Santos hydrothermal vein – sample 1; FS2: Felício dos Santos hydrothermal vein – sample 2; P1: Pancas pegmatite sample. Ellipses delimitate FIAs of samples from the hydrothermal vein (Felício dos Santos); arrow delimitates most samples from the pegmatite (Pancas).
Fluid-inclusion studies in hydrothermal quartz associated with gemmological vein-type titanite mineralisation in the Capelinha region (Chaves et al., Reference Chaves, Tolentino, Dias and Romano2017), ~90 km from Felício dos Santos, also contain low-salinity fluids (between 0.4 and 2.8 wt.% NaCl), and have minimum trapping temperatures between 300°C and 450°C. Both these hydrothermal vein mineralisations are hosted by metavolcanic schists of the Capelinha Formation, which were further affected by the Araçuaí Orogeny (630–480 Ma). We might relate the hydrothermal fluids responsible for both mineralisations to the same source. According to Chaves et al. (Reference Chaves, Tolentino, Dias and Romano2017), the hydrothermal mineralising event of titanite has occurred at ~490 Ma. This age is related to the orogen collapse (Pedrosa-Soares et al. Reference Pedrosa-Soares2011) and might also correspond to the age of amethyst crystallisation in hydrothermal veins at Felício dos Santos.
With respect to the solid inclusions of hematite present in amethyst from both hydrothermal vein and pegmatite environments, it is suggested that the mineralising fluid was Fe rich and thus possibly magmatic. According to Juchem (Reference Juchem1999), goethite [FeO(OH)] is the most common solid inclusion in amethyst from Rio Grande do Sul, indicating that the fluid that resulted in amethyst crystallisation in volcanic rock cavities was also Fe rich. As is well known, amethyst colour is related to the presence of trivalent iron impurities within the crystal structure (e.g. Lehmann and Moore, Reference Lehmann and Moore1966; Dennen and Puckett, Reference Dennen and Puckett1972; Cohen and Hassan, Reference Cohen and Hassan1974; Cox, Reference Cox1977; Cohen, Reference Cohen1985; Fischer et al., Reference Fischer, Krambrock, Pinheiro and Juchem1999; Dedushenko et al., Reference Dedushenko, Makhina, Mar'in, Mukhanov and Perfiliev2004; Scholz et al., Reference Scholz, Chaves, Krambrock, Pinheiro, Barreto, Menezes, Götze and Möckel2012).
Concluding remarks
Considering the geological environments investigated for amethyst growth, it can be concluded that pegmatite and hydrothermal deposits formed over a wide range of temperatures, from 82°C to 391°C, whereas amethyst from basalt cavities grew at lower temperatures, probably <100°C, according to previous studies (e.g. Juchem, Reference Juchem1999; Gilg et al. Reference Gilg, Morteani, Kostitsyn, Preinfalk, Gatter and Strieder2003; Commin-Fischer et al. Reference Commin-Fischer, Berger, Polvé, Dubois, Sardini, Beaufort and Formoso2010). High salinity values in fluid inclusions from the pegmatite sample correspond to the elevated salt content in residual fluids forming the pegmatites. Samples from hydrothermal veins show low-to-moderate salinity values ranging between 2.4 to 11.5 eq. wt.% NaCl. The presence of inclusions with H2O–CO2–NaCl composition in both hydrothermal vein and pegmatite samples suggests a metamorphic or magmatic source for the fluids. Hematite solid inclusions observed in amethyst from both hydrothermal vein and pegmatite environments indicate that the mineralising fluid was Fe rich and hence possibly magmatic.
Acknowledgements
This study was partially financed by the Coordenação de Aperfeiçoamento de Pessoal de Nível Superior – Brasil (CAPES) – Finance Code 001, by the concession of a grant during part of the first author's PhD studies at the Geology Department/UFMG. The authors are grateful to the Raman Spectroscopy Laboratory of the Metallurgy Department/Engineering School/UFMG, in the name of Professor Maria Sylvia Silva Dantas who carried out Raman analyses, and for the UFMG Microscopy Center, where thin sections were cut. We also thank the retired IG/USP physician Rosa Maria da Silveira Bello and the geologist Lucilia Aparecida Ramos de Oliveira for valuable comments on the manuscript.