


Introduction
Agates are very common banded or variegated chalcedony with admixtures of other silica phases accompanied by other minerals e.g. calcite, and can be found in various localities around the world. However, gemstones with fire phenomena are quite rare in Nature and there have been many uncertainties about their origin and the cause of the effect. Fire agates have been found only in Mexico (Aguascalientes, Chihuahua, Jalisco and San Luis Potosi) and in the southern states of the USA (California, Arizona, Nevada and New Mexico). They were first discovered in the cracks and voids of felsic volcanic rocks (rhyolites) in Arizona and California in the 1940's, and promptly became highly valued decorative stones (Newman, Reference Newman2014). The uniqueness of fire agate is not only the result of optical phenomena observed on the surface of the stones but also the rarity of its occurrence. McMackin (Reference McMackin1974) and Hughes (Reference Hughes1975) were the first to try to determine the origin of the fire phenomenon in the agates. According to McMackin (Reference McMackin1974), the optical effect was the result of reflection and interference of white light on the dispersed pigments of goethite and limonite in the silica matrix. Hughes (Reference Hughes1975) in turn, compared this fire phenomenon with the effect of iridescence observed in precious opals, which depends on the specific internal structures composed of light-diffracting spheres. Moreover, the author noted that the growth rate and size of chalcedony individuals of agates were influenced by the temperature of the mineral-forming fluids. As a consequence, the rhythm of silica layers formation was disturbed, and aggregates of bubbles created, which under the influence of white light could be the cause of the observed optical effects on the surface of the gemstones.
Jones (Reference Jones2012), in common with Hughes (Reference Hughes1975), discussed the structural similarity and genesis of fire phenomena in opals and agates. This author also suggested that the presence of slightly wedged inclusions of Fe compounds could be responsible for the origin of the specific hues of red, green, orange and purple colours of this effect in agates. Schumann (Reference Schumann2000) found that fire agate was a layered chalcedony containing inclusions of iron hydroxides that were the centres of reflection and interference of white light. Żaba (Reference Żaba2003) considers fire agates to be a very rare variety of silica with a kidney-like structure, where the chalcedony forms thin layers containing abundant iron oxides. He noted similar effects of iridescence in the golden, golden–green, golden–brown, green, blue or purple rainbow obsidian famous from the USA (Oregon, California, Wyoming and Nevada), Mexico, Peru and Iceland, caused by magnetite inclusions. The remarks presented by Żaba (Reference Żaba2003) are in good agreement with the opinion of Newman (Reference Newman2014), who, when describing fire agates from the Deer Creek mine in Arizona (USA), indicated the presence of two structural elements in these gems, i.e. chalcedony and a film of iron hydroxides covering a bubbly surface, which were responsible for an iridescent or ‘fire’ effect.
In this paper, fire agates from Deer Creek in Arizona, one of the leading areas which produces gem-quality stones, are studied in detail to discuss their nature and the origin of optical phenomena. Microscopic observations of the agates were made to identify silica polymorphs and mineral inclusions, as well as to describe the microtextures and morphology of individuals. These data were obtained using stereoscopic, polarising and scanning electron microscopes (SEM), supported by Raman micro-spectroscopy (RS). Micro X-ray fluorescence (μXRF) with energy-dispersive X-ray spectroscopy (EDS) was applied to detect the distribution of some elements in selected areas of the fire agates. The degree of silica crystallinity (CI index vide Murata and Norman, Reference Murata and Norman1976), size of crystallites and mogánite content in fire agates were determined with powder X-ray diffraction (PXRD). Simultaneous thermal analysis (STA) such as thermogravimetry (TG), differential thermogravimetry (DTG) and differential thermal analysis (DTA) coupled with quadrupole mass spectrometry (QMS), were made to measure the water content and other liquid or gaseous compounds contained in inclusions in the fire agate. All the analytical data presented in this contribution provides extra knowledge concerning the reconstruction of possible processes leading to the formation of fire agate worldwide.
Geological setting
The Deer Creek Fire Agate mine is located on the eastern slope of the Galiuro Mountains (1490 m). The mountain range extends in the NNW direction (Fig. 1a,b). It is part of the Mexican Plateau, within the physiographic province of the Basin and Range (Brown, Reference Brown1993). The Galiuro Mountains are called the ‘Sky Island mountain range’ (Mohlenbrock, Reference Mohlenbrock2006), because their peaks reach up to significant heights (1061–2336 m) above the surrounding plains and deserts. The mountains border the Sulfur Springs Valley at the south-east, the Aravaipa Canyon at the north and north-east, and the San Pedro Valley in the west. It covers the area ~560,000 m2, of which 309,000 m2 (~55%) belongs to the Galiuro Wilderness zone in the Coronado National Memorial Park (Brown, Reference Brown1993).
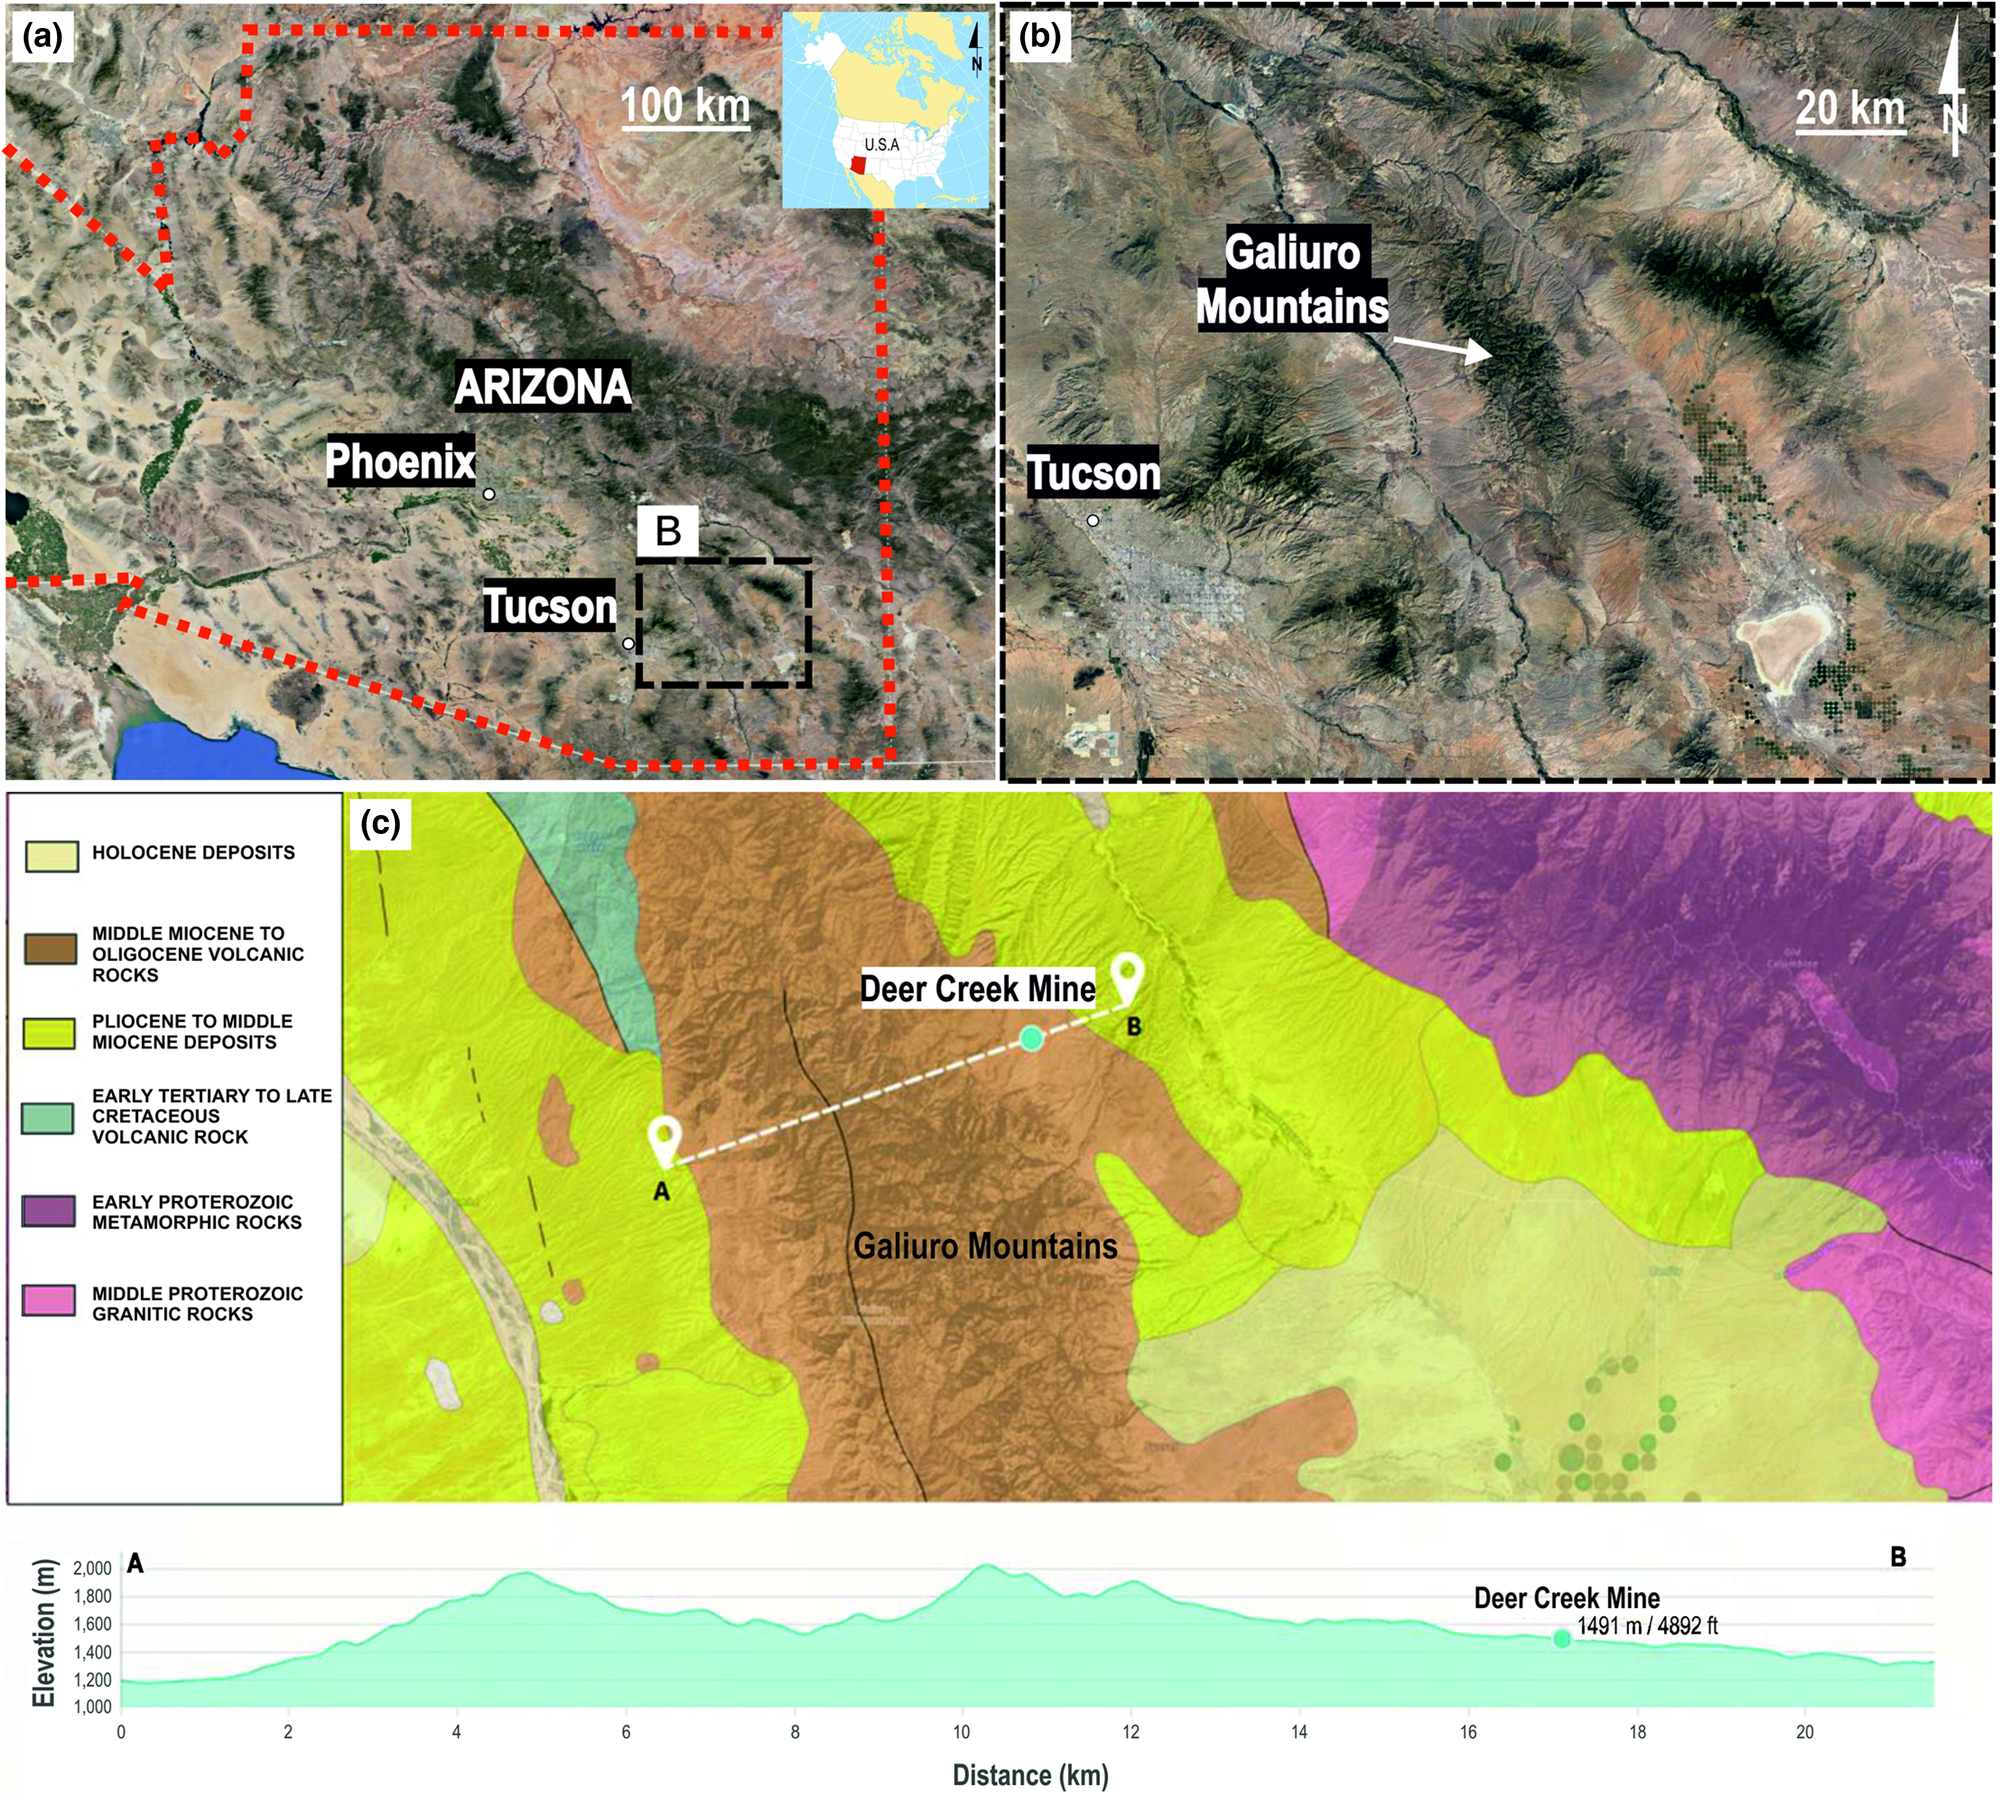
Fig. 1. (a, b) Locality map of the Deer Creek in the Galiuro Mountains of Arizona State; (c) simplified geological map of the area with the Galiuro Mountain cross-section including the Deer Creek mine, modified after Horton (Reference Horton, San Juan and Stoeser2017).
In the Galiuro massif Miocene andesites and rhyolites overlie the complex of Paleogene and Upper Cretaceous volcanic rocks, granites, Palaeozoic quartzites, and Precambrian schists, granites and quartzites (Brown, Reference Brown1993; Horton et al., Reference Horton, San Juan and Stoeser2017). Fire agates are found in the Peach Springs Tuff and Apache Leap Tuff geological units built from the Middle Eocene to Miocene (Bartonian–Tortonian, 41.3–7.25 Ma vide Horton et al., Reference Horton, San Juan and Stoeser2017) volcanic rocks such as basalts, andesites, dacites, rhyolites and their tuffs (Fig. 1c). Layered sequences of felsites of large thickness form characteristic ‘cliffs’ within the mountain ranges such as at Mohave County, Superstition, Kofa, Eagletail, Galiuro and Chiricahua. These are built of tuff and ashes such as the Peach Springs tuff in north-western Arizona, and Apache Leap tuff east of Phoenix. In south-eastern Arizona, volcanic rocks are 20–30 Ma in age, while in the central and western parts they are 15–25 Ma. Late Eocene rocks (11–38 Ma) are also included in this unit near the New Mexico border, in central-eastern Arizona (Horton et al., Reference Horton, San Juan and Stoeser2017).
Sampling and analytical techniques
Six representative samples of agates collected from one block, and showing the fire effect optical phenomenon were investigated in this study using optical microscopy, SEM, PXRD, simultaneous thermal analyses, Raman micro-spectroscopy and X-ray fluorescence.
Microscopy
Thin sections (0.03 mm) were examined in transmitted light using stereoscopic and polarising microscopes (Olympus BX 51 and BA310POL, with a magnification ranging from 40× to 400×). The camera was supported with the Panasis program (Huvitz, Republic of Korea) to take photomicrographs.
Secondary Electron (SE) observations of micro-morphological agate features and back-scattered electron (BSE) analyses were performed on polished sections using the HITACHI S-4700 field emission gun SEM, equipped with the cold cathode and energy-dispersive spectroscopy (EDS NORAN Vantage). The system operated at 20 kV accelerating voltage in a high-vacuum mode, take-off angle 30.5°. The polished sections were coated with carbon.
Powder X-ray diffraction
Six agate samples were first crushed with a small steel hammer, and then powdered in an Abih mortar and sieved to obtain grain sizes <0.5 mm. A fixed mass of the sieved powder was held in a suspension of methanol and further ground in liquid medium using a McCrone mill to obtain grains of 5 μm, which are sufficient for measurements of accurate PXRD intensities (cf Bish and Reynolds, Reference Bish, Reynolds, Bish and Post1989).
The standard PXRD analyses of fire agates were carried out using a Rigaku SmartLab 9kW X-ray diffractometer (Neu-Isenburg, Tokyo, Japan) with the curved crystal graphite-monochromatised CuKα radiation, to identify silica phases and check the purity of analytical material. XRD patterns were recorded in the range 2–75°2θ with step size of 0.05°, counting time 1 s/step, operating voltage 45 kV and current 200 mA. The side-loading method was used for all X-ray measurements.
The average crystallinity index (CI) of silica was calculated as defined by Murata and Norman (Reference Murata and Norman1976), and using euhedral quartz from Jegłowa mine (Lower Silesia, Poland) as an internal standard pattern. CI was estimated from relative intensities of the quintuplet peaks recorded in the separate scans over the range of 66–70°2θ with a step size of 0.01°2θ and scan speed of 10 s/step, and using the strong intensity of the (212) macrocrystalline quartz reflection as a standard so with a scale = 10.
 $$ {\rm CI} = \displaystyle{{a{\rm \;}\lpar {{\rm counts\;at\;peak\;}212{\rm \;to\;trough}} \rpar } \over {b{\rm \;}\lpar {{\rm counts\;at\;peak\;}212\;{\rm to}\;{\rm background}} \rpar \;}}\;\cdot F\cdot 10 $$
 $$ \!\!{\rm where}\;F = \;\displaystyle{b \over a}\;\;{\rm of\ standard\ quartz}\;\lpar {{\rm Murata\ and\ Norman}\comma \;1976} \rpar . $$
The crystallite size (Cs(101)) perpendicular to the (101) plane has been calculated using the Scherrer equation:
 $${\rm Cs\lpar 101\rpar } = \displaystyle{{K{\rm \lambda }} \over {\cos {\rm \theta }\surd {\rm \beta }{\rm q}^2-{\rm \beta }\rm s^2}}$$
following the procedure proposed by Moxon and Carpenter (Reference Moxon and Carpenter2009). The crystallite size estimation was based on the main (101) quartz reflection at 26.64°2θ as recorded in a separate scan over the range 17° < 2θ < 30° with a step size of 0.01°2θ and scan speed of 10 s/step. The full width at half maximum (FWHM) of the (101) peak (βq) was measured along with FWHM of Si at 28.44°2θ (βs) for instrument broadening corrections. The shape factor, K, was taken as unity and λ is the wavelength of CuKα radiation.
The estimation of mogánite content was adopted from the work of Moxon and Carpenter (Reference Moxon and Carpenter2009). The diffraction patterns were collected over the range 17° < 2θ < 30° to include the strongest mogánite peaks at ~20° and α-quartz peak at 20.84° using the step size of 0.01 and scan rate of 10 s/step. The mogánite and quartz peaks areas were determined by fitting Lorentzian-Gauss functions using the advanced fitting Tool in Omnic software (Thermo Scientific™). The mogánite content has been taken as the proportion (in %) of peak area mogánite/total peak area coming from the silica phases.
Simultaneous thermal analyses
The thermal experiments were undertaken to estimate the water content of fire agates and reconstruct the composition of primary fluids. As Moxon (Reference Moxon2017) demonstrated that because of the larger sizes of agate grains a larger amount of silanol water was retained during heating experiments, the powdered samples of six fire agates were prepared by repeated crushing and grinding in a McCrone mill to obtain grain sizes of 5 μm. Before the determination of water content in fire agates with the STA method, all samples were analysed by PXRD to check their purity. The identification of fluid composition in fire agates was done using coarse-grained powdered samples with sizes between 0.5 to 1.0 mm obtained from crushing in the Abih mortar. Before the measurements the powders underwent acclimatisation in a desiccator at a temperature of 22°C and 55% relative humidity for 14 days.
The STA were carried out with an STA 449 F3 Jupiter (Netzsch). 30-mg powdered, acclimatised samples of fire agates were heated from 25 to 1400°C in an alumina crucible, at 10°C/min in flowing (40 ml min−1) synthetic air. The analysis of the evolved gas was carried out using a Netzsch QMS 403C Aëolos QMS.
Raman microspectroscopy
Raman spectra were recorded on clean cleavage surfaces of the fire agate specimens using a Thermo Scientific DXR Raman microscope featuring 10×, 50× and 100× magnification objectives. The samples were excited with a 532 nm laser with power from 10 to 20 mW; exposure time was 3 s, the number of exposures was 10, and the laser focus diameter was ~2–1 μm. The spectra were corrected for background by the sextic polynomial method using Omnic software.
X-ray fluorescence
Energy-dispersive micro X-ray fluorescence spectrometry (ED-XRF) analysis was performed using an M4 TORNADO (Bruker) spectrometer. Element distribution maps were obtained from the selected area of 5.74 mm × 2.21 mm within a polished fire agate specimen. The excitation current (Rh anode) was 600 μA at 50 kV. The analyses were carried out in a vacuum of 20 mbar, the distance between the two measurement points was 15 μm, at a speed of 5 ms/pixel. The SDD detector that collects the fluorescent signal has an active area of 30 mm2 and a spectral resolution of 145 eV. Element concentrations were computed by the fundamental parameters method, concentrations were integrated across homogenous areas selected from elemental maps.
Results
Macro- and microscopic observations
Fire agates have irregular forms, with varying sizes up to a maximum of 10 cm (Fig. 2a). In general, they represent vein agates, very rarely filling nodules of the host rocks. All of them have a very thin, dark rim, max. up to 5 mm thick, forming a transition zone between the host rock and agate's matrix. Agates are locally fractured and filled with brown-coloured pigment probably composed of opaque ore compounds. Occasionally, fine inclusions of a white colour and irregular shape can be also found in the silica matrix. The best pieces, when cut and rolled, display flashes of bluish, reddish, orange and green on their waxy surface (Fig. 2b). The characteristic iridescent rainbow colours are observed only in these fragments of agates, where silica is present as characteristic bubble-like, nodular and botryoidal forms typical of colloform texture.

Fig. 2. Fire agates from the Deer Creek mine: (a) raw specimen, A– agate, H– host rock; (b) polished specimen.
In plane-polarised light microscopy, the agate-bearing host rock exhibits features typical of volcanic rocks, i.e. the presence of phenocrysts and groundmass. The rock has a hypo-crystalline, porphyric and fluidal texture. The phenocrysts are composed mostly of zoned plagioclase and subordinate clinopyroxene and opaque minerals. The completely recrystallised groundmass is composed of microcrystalline feldspar, pyroxene and opaque ore minerals. The textural features and mineralogical composition are typical of pyroxene andesite. The fissures and pockets of these volcanic rocks are filled with silica mineralisation of massy and fibrous chalcedony (Fig. 3a–d) forming thin, alternate white and black layers with zebra-like appearance (cf. Dumańska-Słowik et al., Reference Dumańska-Słowik, Powolny, Sikorska-Jaworowska, Gaweł, Kogut and Poloński2018) in polarised, transmitted light. The length-fast chalcedony interlayered with length-slow chalcedony (Flörke et al., Reference Flörke, Graetsch, Martin, Röller and Wirth1991) and micro-quartz form numerous concentric, rhythmic bands (Fig. 3c). Quartz forms groups of parallel and elongated crystals arranged perpendicular to the vein wall with typical appearance as ‘teeth’ in a comb (comb microtexture – see Dong et al., Reference Dong, Morrison and Jaireth1995). The opaque and dark brown inclusions are enriched in the fibrous chalcedony bands and arranged along the agate banding (Fig. 3b). The colloform texture found as semi-spherical, botryoidal forms seen on the surface of fire agate is also observed locally petrographically (Fig. 3d). Rarely, small individual spheres of chalcedony highlighted by ore-bearing impurities also reveal a characteristic moss microtexture (Fig. 3d, cf. Dong et al, Reference Dong, Morrison and Jaireth1995). Locally some aggregates of microcrystalline quartz crystals with irregular and interpenetrating grain boundaries, characteristic of jigsaw (mosaic) texture (Moncada et al., Reference Moncada, Mutchler, Nieto, Reynolds, Rimstidt and Bodnar2012) are also found in fire agates (Fig. 3d).

Fig. 3. Micrographs of different areas in the fire agate samples (all figures with polars crossed): (a) fibrous chalcedony forming layers with zebra-like appearance; (b) alternating rhythmic bands of chalcedony with micro-quartz forming comb-like microtexture; (c) opaque, and dark brown inclusions (indicated by white arrow) disseminated along chalcedony bands; (d) semi-spherical, botryoidal forms of chalcedony with characteristic colloform (cCha) and moss (mCha) microtextures; note also the presence of jigsaw puzzle quartz (jQz) with interpenetrating grain boundaries.
The morphological features of fire agates with characteristic colloform texture were well documented during secondary electron (SE) observations (Fig. 4a–d). The characteristic bubbles of silica revealed a typical layered structure, and are composed of at least a few zones differing in the morphology of individuals and distribution and amounts of ore phases. One of them exhibits a characteristic ribbed texture (Fig. 4c–d) with a very fine, randomly scattered pigment of numerous Fe and Ti compounds. This zone is covered by a smooth and compact silica layer. The outermost part of the bubble, significantly depleted in ore minerals, is a brittle layer locally being peeled off (Fig. 4b). The transitional zones between the silica layers are distinct and sharp. Agate hosted inclusions are mainly represented by numerous Fe compounds (2–5 μm in size) and minute compounds of Ti and Zn, together with variable amounts of well-crystallised apatite (Fig. 4e,f).

Fig. 4. SEM images: (a) fire agate with characteristic colloform texture; (b) single bubbles covered with brittle layer locally being peeled off; (c) cross section of the silica bubble with internal ribbed texture; (d) randomly scattered pigment of numerous Fe and Ti compounds in internal agate layer; (e) minute compounds of Ti, Zn and Fe oxides/hydroxides; and (f) euhedral apatite inclusion in agate.
Powder X-ray diffraction
The recorded standard PXRD patterns revealed the presence of low quartz and mogánite with an admixture of opal-C in the fire agates. Three samples (nos 2, 3 and 6) are also contaminated with non-silica species, i.e. zeolite-group minerals (Fig. 5).

Fig. 5. Standard PXRD patterns of fire agates samples (F-A1–FA-6) in the region 5–55°2θ. Symbols: Q – low quartz (chalcedony), M – mogánite, C – opal C, Z – zeolite group mineral,
The silica crystallinity (CI) index, calculated from reflections found in the range of 67–69°2θ in the XRD pattern (cf. Murata and Norman, Reference Murata and Norman1976), was determined to be in the range of 0.1–1.5 (Table 1, Fig. 6). The crystallite sizes based on the main (101) quartz reflection of fire agates were calculated to be in the range 43.8–52.2 nm (Table 1). The mogánite content in fire agate was calculated to be in the range 5.1–8.8% (Table 1, Fig. 7).

Fig. 6. XRPD patterns of fire agate samples (F-A1–FA-6) recorded in the region of 66–70°2θ used for calculation of CI index from the equations 1 and 2 (Murata and Norman, Reference Murata and Norman1976). The intensity of XRPD pattern from standard quartz was reduced by a factor of 3 for better visualisation of all data.

Fig. 7. The original XRPD diffractograms fitted with the mogánite peaks at ~20°2θ (solid grey line).
Table 1. The variation of crystallite size (Cs(101)), crystallinity index (CI), and contents of mogánite and volatile components in fire agate samples (FA1–FA6).

S.D. – standard deviation
Simultaneous thermal analyses (TG, DTG, DTA, QMS)
Quadrupole mass spectrometer (QMS) analyses of fire agates showed the presence of only two volatile components, i.e. H2O and CO2 (Fig. 8). In the temperature range of 200–650°C, as indicated by the signal of the mass spectrometer for mass number 18, there is a release of water. The removal of water takes place in two stages, i.e. in the temperature range of 200–400 and 400–650°C, which are attributed to tightly bound water and some silanol water (Si–OH), respectively (Moxon and Ríos, Reference Moxon and Ríos2004; Constantina and Moxon, Reference Constantina and Moxon2010; Moxon, Reference Moxon2017). The release of CO2, is proved by the signal of the mass spectrometer for mass number 44 at the temperature range of 200–650°C. This effect overlaps with the release of water from fire agate. Hence, the determination of the precise amount of water in agate is impossible in this case. The total mass loss resulted from all volatile components of fire agates falls in the range 0.38–1.44 wt.%. Carbon dioxide detected in fire agates could be derived both from trapped fluids (liquid or gaseous CO2) and/or hydrocarbon compounds (liquid or solid).

Fig. 8. TG –QMS curves of fire agate samples having no traces of zeolite (FA-1, FA-4, FA-5); The image shows the loss of sample mass connected with the release of water and carbon dioxide in the range from 100–1000°C. TG – solid line, QMS signal from water – broken line, QMS signal from carbon dioxide – dotted line.
Raman micro-spectroscopy (RS)
Fire agates consist mainly of low quartz, proved by marker bands at 465, 209 and 131 cm–1 and subordinately mogánite with a diagnostic band at 502 cm–1 (Kingma and Hemley, Reference Kingma and Hemley1994; Götze et al., Reference Götze, Nasdala, Kleeberg and Wenzel1998; Dumańska-Słowik et al., Reference Dumańska-Słowik, Natkaniec-Nowak, Wesełucha-Birczyńska, Gaweł, Lankosz and Wróbel2013). Mogánite mainly occurs within dark coloured zones (Fig. 9, Table 2). The intensity of the mogánite line is from one-eighth to one-fifth of the intensity of the 465 cm–1 band, diagnostic of low quartz. Within the silica matrix numerous small one-phase and two-phase (vapour-liquid) fluid inclusions were found. The numerous solid inclusions are represented by black, tabular Ti and Fe oxides. The presence of anatase is demonstrated with its sharp band at 144 cm–1 and broad bands at 638, 515 and 395 cm–1 (Fig. 10a, Table 2). They are assigned to Eg and B1g, A1g, and B1g phonon modes, respectively (Hardcastle, Reference Hardcastle2011). Rutile manifests its occurrence in fire agate by two diagnostic bands at 608 and 439 cm–1 (Fig. 10b, Table 2) attributed to A1g and Eg modes, respectively (Swamy et al., Reference Swamy, Muddle and Dai2006). The weak and broad band at ~230 cm–1 could be a second-order scattering feature of rutile (Swamy et al., Reference Swamy, Muddle and Dai2006). Fe oxides are proved by broad bands occurring in the regions of 600–800 and 1300–1500 cm–1, though the latter band could be also due to silica bands (Hanesch, Reference Hanesch2009). The intensive, strongly asymmetric broad band found in the region of 600–800 cm–1 is probably due to the overlap of two bands at 665 and 730 cm–1 attributed to symmetric stretching vibrations of Fe–O (A1g mode) in maghemite (Legodi and de Waal, Reference Legodi and de Waal2006). The other weak bands characteristic of maghemite are found at 357 and 390 cm–1 (Fig. 10c, Table 2) due to Fe–O symmetric stretching and asymmetric bending vibrations (Hanesch, Reference Hanesch2009). Other black-coloured inclusions found in the agate matrix exhibit a broad, intensive band at 665 cm–1 (Fig. 10d, Table 2) probably due to Fe–O vibrations in magnetite (Legodi and de Waal, Reference Legodi and de Waal2006).

Fig. 9. Raman spectra collected from various regions of fire agate demonstrated the presence of low quartz with mogánite (points no 1, 4 and 5).

Fig. 10. Photomicrographs of: (a) anatase with its Raman spectrum in the range 900–100 cm–1 (reflective light, objective 100×, 532 nm excitation); (b) rutile with its Raman spectrum in the range 900–100 cm–1 (reflective light, objective 100×, 532 nm excitation); (c) maghemite with its Raman spectrum in the range 1900–100 cm–1 (reflective light, objective 50×, 532 nm excitation); and (d) magnetite with its Raman spectrum in the range 1000–200 cm–1 (reflective light, objective 50×, 532 nm excitation).
Table 2. Solid phases identified within fire agates with their Raman bands positions and assignments.

sym. – symmetric; antisym. – antisymmetric; str. – stretching; bend. – bending.
Micro XRF spectroscopy
The distribution of Fe, Ti, Mn and Ca between individual alternating silica zones of fire agate was presented in a two-dimensional map (Fig. 11). The highest abundance of trace elements is observed in macroscopically dark, brown zones. The relatively highest amount of Fe was observed with the coexistence of Ti. The distribution of Mn and Ca is also connected with brown coloured regions of fire agate. The white coloured domains of agate are nearly devoid of any minor elements (Table 3).

Fig. 11. False colour distribution maps for Fe, Ti, Mn and Ca obtained by XRF of a fragment of fire agate together with a photo of the analysed sample (thin plate).
Table 3. Representative major-element composition of brown coloured and white coloured regions (see Fig. 11) of fire agate obtained from ED-XRF.

b.d.l. – below detection limit
Discussion
The fire agates from Deer Creek mine in Arizona occurring in the fissures of volcanic rocks (andesites) were formed as a result of episodes of faulting and fracturing processes in this region (Brown, Reference Brown1993). They are mainly red–brown in colour and form small, irregular aggregates, which adopt the size and shape of fissures in the host rocks. Only some agates from this locality exhibit the fire effect, particularly observable after polishing. The individual zones of these gemstones are mainly composed of length-fast and length-slow chalcedony with an admixture of mogánite, quartz and opal-C. The significant presence of mogánite (av. 6.6%) with some traces of opal-C suggests these primary silica phases probably did not have enough time to recrystallise into more stable, low quartz (Heaney, Reference Heaney1995) after it had been deposited within the cavities of the Miocene-Oligocene volcanic host rocks. This hypothesis is supported by observations of Moxon and Ríos (Reference Moxon and Ríos2004), who showed that the mogánite content of agate generally decreased with age during the first 400 Ma. Moreover, Constantina and Moxon (Reference Constantina and Moxon2010) demonstrated that the amount of defect-site water also decreases with increasing age, conversely to free, molecular water, the content of which seems to be independent of the age of agates host rocks (Moxon and Ríos, Reference Moxon and Ríos2004). Subsequently, Moxon (Reference Moxon2017) verified these results, and demonstrated the linear decrease in mobile water content within agates over the first 60 Ma, a cessation for the next 200 Ma, and minimal drop over the next 800 Ma.
However, a correlation of defect-site water amounts with the age of agate, cannot be made for the fire agate from Deer Creek mine, as it was impossible to determine the precise content of tightly bound water with STA due to the overlap of the effects connected with release of water and carbon dioxide at similar temperature conditions. Nevertheless, the reaction between the water released from silanol groups (defect-site water) and mogánite is essential for the formation of quartz crystallites. As noticed by Moxon (Reference Moxon2017), over time silanol water dissolves the more soluble mogánite leading to silica recrystallisation as low quartz in agate. The young age of fire agates from Deer Creek (assumed as the age of their host rocks) is also reflected in the size of low quartz crystallites being calculated as mean 48 nm (~0.05 μm), which seems to be one of the smallest values reported in the literature. Moxon and Rios (Reference Moxon and Ríos2004) found a globulite size from 0.2 μm in the youngest agates (38 Ma) to ~2.0 μm in the oldest agates (? 412 Ma), proving that size of crystallites increases with increasing age.
The fire effect in the shade of red, blue, orange and green is observed only in these parts of agates from Deer Creek when silica phases form nodular or bubble-like aggregates, typical of the colloform texture identified in epithermal veins (Dong et al., Reference Dong, Morrison and Jaireth1995). Hence, it is assumed these characteristic morphological forms seem to be the centres of diffraction and interference of white light, and are responsible for the creation of fire effects in these gemstones.
In fire agate, silica forming characteristic spherical forms exhibit a very low average CI, calculated at 0.7, which is diagnostic for poorly ordered chalcedony (Murata and Norman, Reference Murata and Norman1976). This is supported by the observations of Moxon and Rios (Reference Moxon and Ríos2004) who demonstrated that agates hosted by younger rocks contain greater proportions of amorphous and strongly disordered silica than those found in older hosts, and with abundant recrystallisation microtextures. In fire agates, the identified microtextures such as colloform, comb and moss, represent typical primary silica growth textures. These originated by direct precipitation from hydrothermal solutions. The numerous thin bands and sharp boundaries between individual layers indicate the formation of fire agate from discrete siliceous influxes. The jigsaw texture is interpreted to result from recrystallisation of amorphous silica or massive chalcedony (Dong et al., Reference Dong, Morrison and Jaireth1995). Fournier (Reference Fournier1985) suggested that the occurrence of this microtexture indicated recrystallisation processes at temperatures higher than 180°C.
Each bubble forming fire agate is composed of a few zones indicating the characteristic layered nature of these gemstones. The external zone of each bubble, partly peeling off, seems to be the most damageable element of fire agate structure. Only some of these layers are abundantly impregnated with microscopic size inclusions of magnetite, maghemite, anatase, rutile, and complex compounds of Fe–Zn, Fe–Ti, and Mn, which together with specific microstructural features of silica are the most probable cause of the brown colouration of fire agates from this locality. The frequent presence of iron, and other transitional elements within bands is the reason for yellow and red colouration of agates found in various parts of the world (Götze et al., Reference Götze, Nasdala, Kempe, Libowitzky, Rericha and Vennemann2012). However, the size and type of these inclusions (oxides/hydroxides), the grain size of silica crystallites and porosity can affect the shades of this colouration. The dark brown and black colours are usually caused by microscopic inclusions of Mn oxides, bituminous matter, and Fe- and Ti oxides (Dumańska-Słowik et al., Reference Dumańska-Słowik, Natkaniec-Nowak, Kotarba, Sikorska, Rzymetka, Loboda and Gaweł2008; Götze et al., Reference Götze, Nasdala, Kempe, Libowitzky, Rericha and Vennemann2012). In fire agate from Deer Creek, an organic substance cannot be excluded as an extra chromophore, because traces of CO2 were detected with STA.
The abundance of iron and titanium compounds in fire agate could indicate a cyclic supply of Fe and Ti in silica-bearing mineralising fluids. Götze et al. (Reference Götze, Möckel, Kempe, Kapitonov and Vennemann2009) noticed the accumulation of minute iron compounds along the banding of the chalcedony layers that follow ‘self-purification’ of chalcedony during its crystallisation. Throughout the course of this process, Fe was rejected from the silica, moved with the crystallisation front, and accumulated as single Fe oxide within the chalcedony matrix (Götze et al., Reference Götze, Möckel, Kempe, Kapitonov and Vennemann2009). Moreover, the results obtained from our work indicated a silica source for fire agate formation from aqueous solution with a significant role of CO2. Moreover, the formation of zeolites is typical for the alteration fluids in basic volcanic rocks.
The distinctive colloform texture, seen in fire agates both in hand samples as well as by petrographic observations, is interpreted as a primary growth texture formed during deposition of amorphous silica (Dong et al., Reference Dong, Morrison and Jaireth1995). Henley and Hughes (Reference Henley and Hughes2000) noticed that this texture was generated during a rapid opening of fractures within host rocks, which produced rapid pressure drop and cooling as a consequence. Hence, it is very probable that in Deer Creek mine the deposition of chalcedonic silica in fractures of volcanic rocks was proceeding during rapid pressure and low-temperature conditions. Moreover, the hydraulic fracturing associated with pressure drop may cause the fluid to boil. In such conditions the temperature decreases due to the large heat of vaporisation of water, which means that originally silica-undersaturated fluid becomes oversaturated. This leads to the precipitation of amorphous silica with a colloform texture (Moncada, Reference Moncada2008). Hence, fire agates from Deer Creek can be interpreted as an indicator of boiling episodes in the epithermal environment in this region.
Conclusions
Waxy lustre, brown colour, fire effect and botryoidal (colloform) texture are diagnostic features for the fire agate from Deer Creek in Arizona. The integrated studies by polarising microscopy, SEM, X-ray fluorescence, PXRD, and Raman micro-spectroscopy showed that fire agate has a multi-layered bubble-like structure, which together with abundant tiny metal inclusions found only in some layers cause the characteristic rainbow fire effect observed on the surface. Fire agate is mainly composed of length-fast and length-slow chalcedony with the admixture of other SiO2 phases such as micro-quartz, mogánite, and opal-C. Microscopic inclusions of magnetite, maghemite, rutile, and anatase with traces of Mn compounds as well as microstructural features of fire agate are the colouring agents of the silica from this locality. No traces of any Fe hydroxides, as suggested by McMackin (Reference McMackin1974) and Schumann (Reference Schumann2000) were found in fire agate from Deer Creek. The deposition of silica along faults, bedding plane fractures, and voids of volcanic rocks slowly built up numerous thin layers from epithermal aqueous solutions enriched periodically in iron, titanium, manganese and carbon dioxide. The significant presence of unstable phases such as mogánite, opal-C, and the predominance primary growth microtextures over recrystallisation ones, as well as small crystallite size are typical of young agates, aged less than 50 Ma.
Acknowledgements
We are grateful to Ryszard Krukowski, the owner of the Deer Creek Mine in Arizona, for providing fire agate samples for study. The anonymous Reviewers and Roger Mitchell, the Principal Editor, are acknowledged for their comments and suggestions, which helped to improve the manuscript. The work was financially supported by AGH University of Science and Technology, research grant no. 16.16.140.315 and the Pedagogical University in Krakow, grant no. BS/452/G/2018 and Earth Science Institute, Slovak Academy of Sciences, grant no ITMS:26220120064 and ITMS:26210120013.


