Introduction
Hydrotalcite, ideally [Mg6Al2(OH)16](CO3)(H2O)4, is the archetype of the hydrotalcite-supergroup minerals, which are also known as natural layered double hydroxides (LDHs). This supergroup now includes more than 40 structurally and chemically related species (Mills et al., Reference Mills, Christy, Génin, Kameda and Colombo2012a). The mineral hydrotalcite has been known since 1842, when it was first described by Hochstetter (Reference Hochstetter1842) in material from the Dypingdal serpentine–magnesite deposit in Snarum, Modum, Buskerud, Norway (Mills et al., Reference Mills, Christy and Schmitt2016). As well as existing as minerals, LDHs are often prepared synthetically, owing to their wide range of useful properties (Evans and Slade, Reference Evans, Slade, Duan and Evans2006).
Crystal structures of the hydrotalcite-supergroup minerals consist of positively charged brucite-type layers with octahedral sites occupied by M 2+ and M 3+ cations; in the currently known minerals, species-defining M 2+ are Mg, Fe, Mn, Ni, Cu, Ca and Zn while M 3+ are Al, Fe, Mn, Co and Cr. The octahedral layers alternate with negatively charged interlayers occupied by (CO3)2−, Cl−, (SO4)2−, [Sb(OH)6], OH− ions and H2O molecules. Hydrotalcite-group members have M 2+:M 3+ = 3:1 and contain interlayer species such as carbonate or hydroxyl groups or chlorine (Mills et al., Reference Mills, Christy, Génin, Kameda and Colombo2012a). The general formula of the hydrotalcite-group minerals can be written as [M 62+M 23+(OH)16]q+(Xn −)q/n·4H2O, where M 2+ and M 3+ are cations and X is an anion.
The first X-ray crystallographic data on a hydrotalcite-supergroup minerals were reported for pyroaurite, [Mg6Fe23+(OH)16](CO3)(H2O)4 (Fe3+-analogue of hydrotalcite), which was found in two polytypic modifications: 3R (a = 3.089 and c = 23.23 Å) and 2H (a = 3.097 and c = 15.56 Å) (Aminoff and Broomé, Reference Aminoff and Broomé1931). The polytypism of hydrotalcite was investigated by Frondel (Reference Frondel1941), who determined the following unit-cell parameters for this mineral: a = 6.13 and c = 46.15 Å for the rhombohedral form, and a = 6.12 and c = 15.34 Å for the hexagonal form. The doubling of the a parameter for both polytypes and the doubling of the c parameter for the rhombohedral modification was justified by the need to obtain an integral atom content in the unit cell and not by the observation of any superstructure reflections (Taylor, Reference Taylor1973). Later single-crystal structure refinement of ‘hydrotalcite’ was reported by Allmann and Jepsen (Reference Allmann and Jepsen1969) on a specimen from Moravia (Czech Republic), with the formula [Mg4Al2(OH)12](CO3)(H2O)3. However, in the current nomenclature scheme (Mills et al., Reference Mills, Christy, Génin, Kameda and Colombo2012a), this corresponds to quintinite, which differs from hydrotalcite in the M 2+:M 3+ ratio (2:1 rather than 3:1). In general, quintinite and its synthetic analogues are very commonly reported as ‘hydrotalcite’ or ‘hydrotalcite-like phase’ in the literature. For example, the widely cited paper by Bellotto et al. (Reference Bellotto, Rebours, Clause, Lynch, Bazin and Elkaim1996) reports the Rietveld structure refinement of quintinite, and not hydrotalcite, as the title suggests. This historic and widespread inconsistency results in some confusion into the structural systematics of a large family of LDH minerals, with ramifications for the methods of LDH synthesis. It also raises a number of questions on the relative abundance of quintinite and hydrotalcite in nature, their structural characterisation and diagnostic features.
Our ongoing examination of material from many localities indicates that many specimens traditionally labelled as ‘hydrotalcite’ in fact correspond to quintinite. There are, in Russia alone, samples from the Kovdor alkaline-ultrabasic complex, Kola Peninsula (Krivovichev et al., Reference Krivovichev, Yakovenchuk, Zhitova, Zolotarev, Pakhomovsky and Ivanyuk2010a,Reference Krivovichev, Yakovenchuk, Zhitova, Zolotarev, Pakhomovsky and Ivanyukb; Zhitova et al., Reference Zhitova, Yakovenchuk, Krivovichev, Zolotarev, Pakhomovsky and Ivanyuk2010, Reference Zhitova, Krivovichev, Yakovenchuk, Ivanyuk, Pakhomovsky and Mikhailova2018a), the Bazhenovskoe chrysotile–asbestos deposit (Krivovichev et al., Reference Krivovichev, Antonov, Zhitova, Zolotarev, Krivovichev and Yakovenchuk2012), and the Mariinskoe emerald and beryllium deposit, Ural Emerald Mines (Zhitova et al., Reference Zhitova, Popov, Krivovichev, Zaitsev and Vlasenko2018b), both in the Middle Urals.
Recently, the neotype specimen of hydrotalcite from Snarum was established by Mills et al. (Reference Mills, Christy and Schmitt2016), who confirmed, using powder X-ray diffraction (XRD) data and electron-microprobe analyses, that this is a real hydrotalcite (M 2+:M 3+ = 3:1) represented by intimate intergrowths of three-layer (rhombohedral, 3R) and two-layer (hexagonal, 2H) polytypes. The predominant phase in the neotype is the 3R polytype (69%) with a = 3.05(1) Å and c = 23.36(1) = 3 × 7.79 Å, whereas a 2H polytype is subordinate (31%) with a = 3.07(1) Å and c = 15.62(5) = 2 × 7.81 Å (Mills et al., Reference Mills, Christy and Schmitt2016). Powder XRD data, including Rietveld refinement results, for synthetic Mg–Al–CO3 LDHs were reported by Bellotto et al. (Reference Bellotto, Rebours, Clause, Lynch, Bazin and Elkaim1996), Sharma et al. (Reference Sharma, Tyagi and Jasra2008), Cocheci et al. (Reference Cocheci, Barvinschi, Pode, Popovici and Seftel2010), Liao et al. (Reference Liao, Zhao and Xia2012) and Wang et al. (Reference Wang, Bai, Zhao, Chai, Guo and Zhang2013). Besides ‘classical’ 3R and 2H polytypes, an exotic 6R modification was described for hydrotalcite based on powder XRD patterns (Stanimirova, Reference Stanimirova2001).
A challenge with the structure refinement of hydrotalcite, in particular, and LDHs in general, arises from the rarity of crystals suitable for single-crystal XRD. While studying hydrotalcite samples from different sources (see below), we were able to select samples with satisfactory quality for single-crystal data collection and structure refinement.
In the previous four papers of the current series we discussed polytypism of quintinite focusing on the ordering of the M 2+ and M 3+ cations (Krivovichev et al., Reference Krivovichev, Yakovenchuk, Zhitova, Zolotarev, Pakhomovsky and Ivanyuk2010a,Reference Krivovichev, Yakovenchuk, Zhitova, Zolotarev, Pakhomovsky and Ivanyukb; Zhitova et al., Reference Zhitova, Yakovenchuk, Krivovichev, Zolotarev, Pakhomovsky and Ivanyuk2010, Reference Zhitova, Krivovichev, Yakovenchuk, Ivanyuk, Pakhomovsky and Mikhailova2018a). The present paper is intended to provide new mineralogical and crystal chemical information on hydrotalcite itself, including the first single-crystal structure data for the mineral.
Occurrence and sample description
In our collection of hydrotalcite-group minerals, hydrotalcite itself, i.e. the mineral corresponding to the simplified formula [Mg6Al2(OH)16](CO3)(H2O)4, was found in material from six localities. There are, as follows:
(1) Dypingdal serpentine–magnesite deposit, Snarum, Modum, Buskerud, Norway: samples #105371 and #158518 (Fig. 1a) from the collections of the Smithsonian National Museum of Natural History (NMNH), Washington, DC, USA; and #52071 from the systematic collection of the Fersman Mineralogical Museum of the Russian Academy of Sciences, Moscow, Russia (FMM). Details on the geological setting of hydrotalcite from Snarum are given by Mills et al. (Reference Mills, Christy and Schmitt2016). The material studied is represented by aggregates of pearly-white curved, corrugated scales forming nests in a green–yellow serpentine with hematite.
(2) Zelentsovskaya pit in Nazyamskie Mts., Zlatoust district, Southern Urals, Russia: #80947 from FMM and #10532 (Fig. 1c) from the collection of one of the authors (IVP). The detailed description of geological setting for ‘manasseite’ from altered skarns of the Zelentsovskaya pit was provided by Ivanov and Aizikovich (Reference Ivanov and Aizikovich1980). Hydrotalcite is found in pseudomorphs after spinel and chondrodite associated with clinochlore, calcite and magnetite. It forms beige to pale pink coarse-lamellar aggregates.
(3) Praskovie-Evgenievskaya pit in Shishimskie Mts., Zlatoust district, Southern Urals, Russia: #10604 from the IVP collection. The skarn mineralization of the Praskovie-Evgenievskaya pit, like the Zelentsovskaya pit, is located in the contact zone between dolomite marble and gabbro. Hydrotalcite occurs as massive, monomineralic pale beige scaly aggregates, forming nests up 10 cm across.
(4) Komsomol'skii Mine, Talnakh Cu-Ni deposit, Norilsk district, Krasnoyarsk Kray, Siberia Russia: #9699 from the IVP collection (Fig. 1b). Hydrotalcite is found in cavities in the axial part of a calcite veinlet cross-cutting a chalcopyrite–pyrrhotite orebody. The mineral forms transparent, colourless tabular hexagonal crystals up to 1 mm across on calcite and is associated with valleriite.
(5) St. Lawrence, New York, USA. The sample studied (sample #79578 from the NMNH collection) consisted of aggregates of white to slightly golden, curved corrugated scales (Fig. 1a).
(6) Kirovskii apatite mine, Mt. Kukisvumchorr, Khibiny alkaline complex, Kola peninsula, Russia: #Kir4940 from the IVP collection. Hydrotalcite and quintinite forming parallel intergrowths, occur in cavities of a calcite veinlet with phlogopite cross-cutting ijolite–urtite. The complex crystals consisting of these hydrotalcite-group minerals are pinkish tablets up to 3 mm across typically combined in rose-like clusters or crusts.
Fig. 1. Images of hydrotalcite samples: (a) photo, field of view = 1 cm × 0.7 cm, (b) BSE image of unpolished grain, sample #9699 and (c) BSE image of polished grain, sample #10532.
Experimental methods
Chemical composition
The chemical composition of all samples was determined with a scanning electron microscope S3400N (Geomodel Center, St. Petersburg State University, Russia) equipped with an AzTec analyser Energy 350 operating in energy dispersive spectroscopy (EDS) mode at 20 kV, 1.5 nA and with a 5 µm spot size. The standards used for quantification were: MgO (Mg), Al2O3 (Al), FeS2 (Fe), Cr metal (Cr) and Mn metal (Mn). Quintinite of known chemical composition was also used as a standard. The average chemical data obtained for samples are given in Table 1.
Table 1. Chemical composition of hydrotalcite1.
1Chemical composition of sample Kir4940 cannot be provided because it is an intergrowth of quintinite and hydrotalcite; 2unpolished carbon-coated cleavage surface (Fig. 1).
**Calculated by charge balance; ***calculated by stoichiometry; n.d. – not determined.
The infrared (IR) spectra of the hydrotalcite samples were recorded using a Bruker Vertex IR spectrometer (XRD Resource Centre, St. Petersburg State University). The measurements were taken at room temperature using the KBr technique.
The water content was measured for samples 105371 and 10532 by differential scanning calorimetry (DSC) coupled with thermogravimetric analysis (TGA). The experiment was performed using a DSC/TGA Netzsch STA 449 F3 instrument (XRD Resource Centre, St. Petersburg State University), measuring from 30–1200°C with a ramp rate of 10°C min−1 and gas flow of 20 ml min−1 by heating the samples under Ar–Ar atmospheres.
Single-crystal XRD data
Crystals from samples: (1) 9699, Kir4940; and (2) 10604 were studied at RT. The measurements were carried out by means of a: (1) Bruker Kappa Apex Duo (MoKα) diffractometer operated at 45 kV and 0.6 mA (microfocus source); and (2) Bruker Smart Apex (MoKα) diffractometer operated at 50 kV and 40 mA (Table 2), respectively (both in the XRD Centre, St. Petersburg State University). Another crystal selected from specimen 9699, and labelled below as 9699 LT, and sample 80947 were studied by means of Bruker APEX-II CCD diffractometer (Durham University, UK); the measurements were carried out at T = 120 and 93 K, respectively (Table 2). All instruments are equipped with CCD detectors. The intensity data were reduced and corrected for Lorentz, polarisation and background effects using the Bruker software APEX2 (Bruker-AXS, 2014). A semi-empirical absorption correction based upon the intensities of equivalent reflections was applied (SADABS, Sheldrick, Reference Sheldrick2015). The unit-cell parameters (Table 2) were refined by the least-squares methods. The SHELXTL program package was used for the structure solution and refinement (Sheldrick, Reference Sheldrick2015). Crystal data, parameters of data collection and refinement details are given in Table 2.
Table 2. Crystal data, data collection information and structure refinement details for hydrotalcite.
Powder XRD data
Initially, the homogeneity of all samples was checked by means of a desktop diffractometer Bruker D2 Phaser with a Bragg–Brentano geometry operated at 30 kV and 10 mA, and equipped with a LYNXEYE detector (CuKα and CoKα). The data collection was carried out under the following conditions: step scan size = 0.02°, counting time = 1 s and 2θ range = 5–65°. The study revealed a significant preferred orientation of hydrotalcite crystals; however, it allowed for the detection of possible splitting of basal reflections due to the coexistence of visually inseparable phases with different d values.
A more thorough powder XRD study was carried out by means of a Rigaku R-AXIS Rapid II single-crystal diffractometer equipped with a cylindrical image plate detector using Debye-Scherrer geometry (d = 127.4 mm; CoKα). The data were converted using the osc2xrd program (Britvin et al., Reference Britvin, Dolivo-Dobrovolsky and Krzhizhanovskaya2017).
Results
Chemical composition
All samples contain Mg and Al as species-defining cations, whereas Mn, Fe and Cr are minor observed components; Fe is considered as Fe3+ in accord with Mills et al. (Reference Mills, Christy and Schmitt2016). The empirical formula was calculated on the basis of Mg + Al + Fe + Mn + Cr = 8 apfu. The carbonate content was calculated based on charge balance. The amount of OH groups was taken as 2 per 1 cation based on stoichiometry. The H2O content was measured by DSC and TG analyses and is in agreement with the H2O content in the ideal chemical formula of hydrotalcite-group minerals (i.e. 0.5 H2O per 1 cation, see below).
The representative IR spectrum recorded for sample 10532 is shown in Fig. 2. The spectrum contains the following bands: 3537 (Mg/Al–OH), 3200–2700sh (H2O interacting with interlayer carbonate), 1655 (H2O), 1370 (CO3), 920–910sh (Al–OH), 858 (CO3 or/and OH), 720–710sh (Al–OH), 664 (Mg–OH), 556 (M–O, M–O–M and O–M–O) and 447 (M–O, M–O–M and O–M–O) (Hernandez-Moreno et al., Reference Hernandez-Moreno, Ulibarri, Rendon and Serna1985; Moroz and Arkhipenko, Reference Moroz and Arkhipenko1991; Kloprogge et al., Reference Kloprogge, Wharton, Hickey and Frost2002; Kloprogge, Reference Kloprogge2005; Frost et al., Reference Frost, Spratt and Palmer2009).
Fig. 2. The infrared spectrum of hydrotalcite, sample 10532.
The DCS and TGA curves (Fig. 3) were interpreted as follows: (1) 30–70°C loss of absorbed and/or adsorbed water; (2) 70–210°C loss of interlayer H2O with corresponding mass loss of 11.8% that coincides with ideal stoichiometry, i.e. an H2O molecule per 2 cations; and (3) the second strong effect and a mass loss at 365–430°C are attributed to dehydroxylation and decarbonation of hydrotalcite (Kanezaki, Reference Kanezaki1998; Frost et al., Reference Frost, Martens, Ding and Kloprogge2003; Panikorovsky et al., Reference Panikorovskii, Zhitova, Krivovichev, Zolotarev, Britivn, Yakovenchuk and Krzhizhanovskaya2015).
Fig. 3. DCS (blue) and TGA (green) curves of hydrotalcite, sample 105371.
Single-crystal XRD data
The data obtained for the samples 9699 [at room temperature (RT) and T = 120 K (LT)] and Kir4940 were indexed in the rhombohedral unit cell, space group R3 (Table 2). Their diffraction patterns contain only reflections that correspond to the systematic absences condition –h + k + l = 3n. The positions of atoms in the metal hydroxide layer were determined in the space group R3. The test for a higher symmetry, applying the PLATON program (Speck, Reference Speck2003), indicated the space group R ![]() $ {\bar 3} $m. The hydrogen and interlayer atoms were added to the refinement after structure transformation to the space group R
$ {\bar 3} $m. The hydrogen and interlayer atoms were added to the refinement after structure transformation to the space group R ![]() $ {\bar 3} $m. The diffraction data (Fig. 4) obtained for single crystals from samples 10532, 10604 and 80947 [T = 93 K] were indexed in the hexagonal space group P63/mmc, unit-cell parameters are given in Table 2. The appearance of weak inconsistent reflections observed in Fig. 4c is due to the single-crystal imperfections. Atom coordinates, site occupancies and displacement parameters are given for 3R and 2H polytypes in Tables 3 and 4. Selected interatomic distances are provided in Table 5. The crystallographic information files have been deposited with the Principal Editor of Mineralogical Magazine and are available as Supplementary material (see below).
$ {\bar 3} $m. The diffraction data (Fig. 4) obtained for single crystals from samples 10532, 10604 and 80947 [T = 93 K] were indexed in the hexagonal space group P63/mmc, unit-cell parameters are given in Table 2. The appearance of weak inconsistent reflections observed in Fig. 4c is due to the single-crystal imperfections. Atom coordinates, site occupancies and displacement parameters are given for 3R and 2H polytypes in Tables 3 and 4. Selected interatomic distances are provided in Table 5. The crystallographic information files have been deposited with the Principal Editor of Mineralogical Magazine and are available as Supplementary material (see below).
Fig. 4. The hk0 and h0l sections of reciprocal diffraction space obtained for hydrotalcite-3R (a and b) and hydrotaclite-2H (c and d).
Table 3. Atom coordinates, site occupancies, equivalent isotropic displacement parameters for all atoms and anisotropic displacement parameters for atoms in octahedral layer (Å2) for hydrotalcite-3R.
* Fixed during refinement
Table 4. Atom coordinates, site occupancies, equivalent isotropic displacement parameters for all atoms (Å2) and anisotropic displacement parameters for atoms in octahedral layer for hydrotalcite-2H.
* Fixed during refinement
Table 5. Selected bond lengths (Å) in the structure of hydrotalcite-3R and hydrotalcite-2H
*The C–O distance is fixed at 1.21(5) Å
**The O–H distance is fixed at 0.82(2) Å
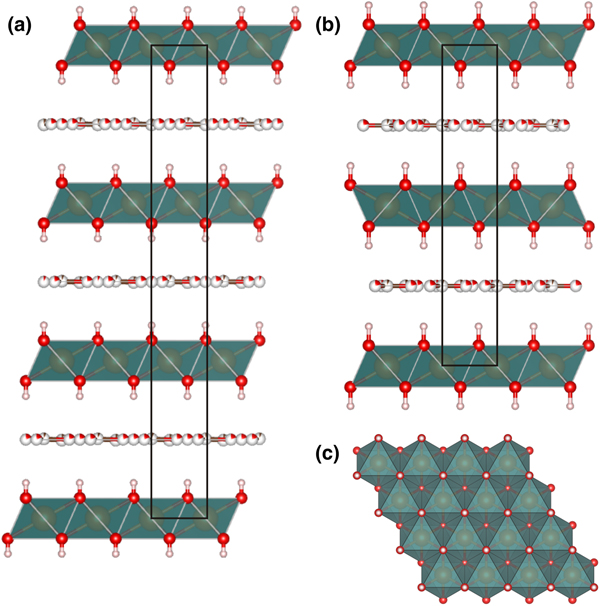
Crystal structures of both rhombohedral and hexagonal hydrotalcite polytypes (Fig. 5) consist of metal hydroxide layers. The long-range average crystal structures as determined by single-crystal XRD contain one M1 site statistically occupied by Mg and Al and impurity elements (Fe) with M 2+:M 3+ ≈ 3:1 (Table 1). Rhombohedral and hexagonal modifications differ from one another by stacking sequences of metal hydroxide layers, having 3-layer and 2-layer periodicity, respectively (Fig. 5). For both hydrotalcite-3R and 2H, anisotropic displacement parameters were refined for the O and M sites in the octahedral layer; for the rest of the atoms (H of octahedral layer and interlayer C and O atoms) only isotropic displacement parameters were refined. The occupancies of the M and O sites in the octahedral layer were determined as close to 100% in all samples and were fixed at 1.02 for M1 (0.75 Mg + 0.25 Al, refined using the scattering curve of Mg) and 1.0 for O in agreement with ideal chemical formula. The position of H atoms in the metal hydroxide layer is fixed by symmetry in the x and y coordinates (Tables 3, 4) and may vary only along z, the O–H distances were restrained at 0.82(2) Å for all samples (Table 5).
Fig. 5. Crystal structures of 3R (a) and 2H (b) hydrotalcite polytypes along stacking and (110) projection of metal hydroxide layer (c).
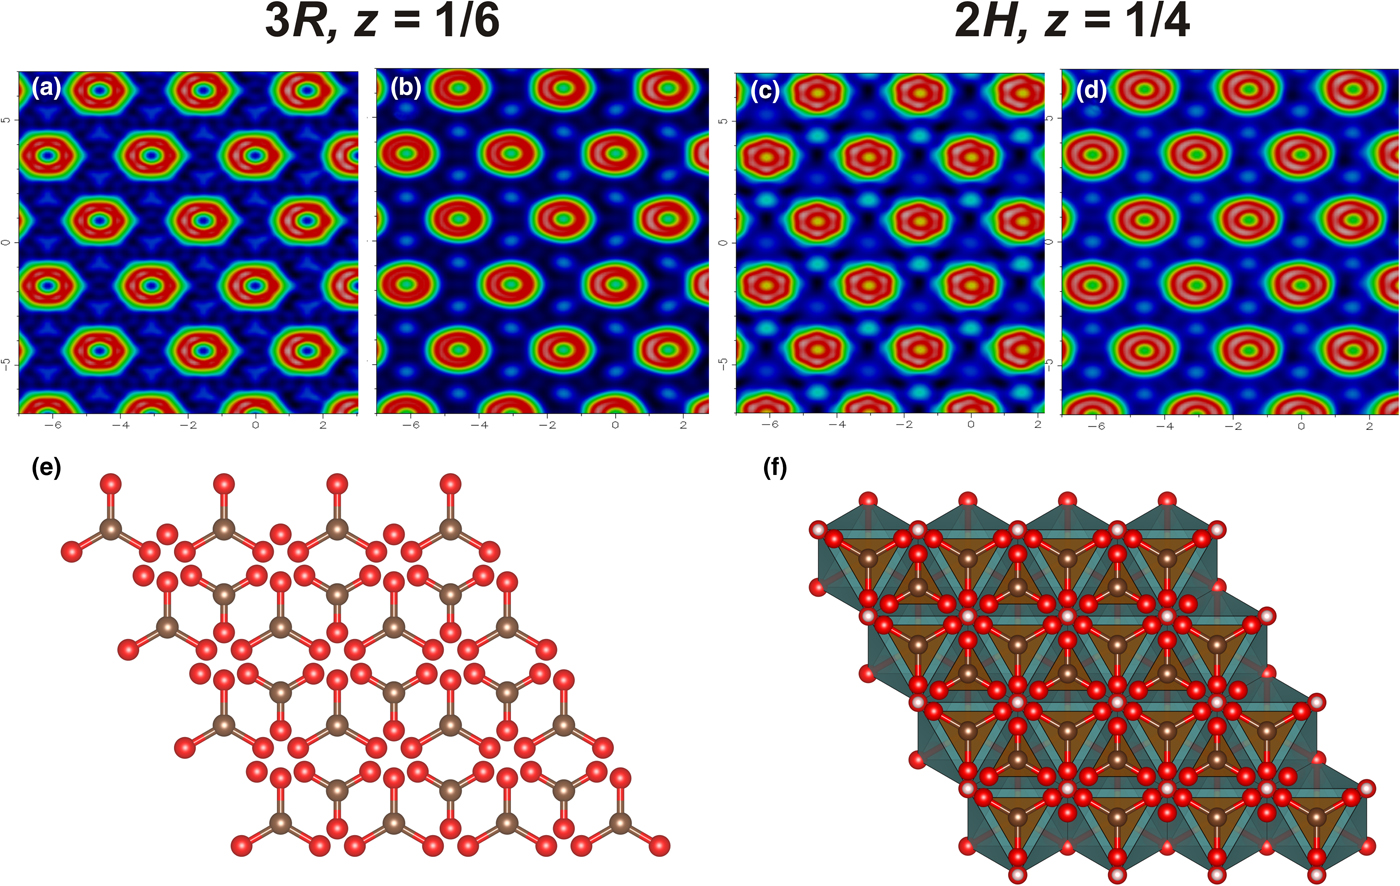
The residual electron density maps at the interlayer level are shown in Fig. 6. The map contains toroidal rings that refer to the interlayer O atoms with C atoms located in between. In the interlayer, positions of carbonate groups (carbon and oxygen) were determined, whereas positions of H2O molecules could not be localised. Due to the smearing of electron density, the interlayer species are difficult to refine. For the sample 10604, the C2–O3 distance was softly restrained to be 1.21(5) Å, whereas in other samples reliable C–O distances were obtained without restraints (Table 5). The absence of significant changes between the electron density maps obtained at room and low temperatures (Fig. 6) indicates the statistical nature of disorder of the interlayer atoms.
Fig. 6. The electron-density maps at the interlayer level: hydrotalcite-3R at room temperature (a) and at 120 K (b); hydrotalcite-2H at room temperature (c), and at 93 K (d) and the topology of interlayer (e) and mutual arrangement of octahedral layer and interlayer (f).
Powder XRD data
Powder XRD experiments performed in a Bragg-Brentano geometry reveal splitting of basal reflections (003, 006, 009) for sample Kir4940 indicating coexistence of two phases: one with d 003 = 7.76 Å and another with d 003 = 7.56 Å (Fig. 7). Our previous investigations indicated a characteristic hydrotalcite d value of 7.80 Å and typical quintinite d value of 7.56 Å (due to the difference in the M 2+:M 3+ ratio [Zhitova et al., Reference Zhitova, Krivovichev, Pekov, Yakovenchuk and Pakhomovsky2016]). Therefore, the main phase with d 003 = 7.76 Å is hydrotalcite, whereas the second phase with d 003 = 7.56 Å is quintinite. The rest of the samples were considered as having only M 2+:M 3+ ≈ 3:1 because they contained one set of basal reflections with d ≈ 7.80 Å only. The powder XRD pattern recorded for Kir4940 by means of the Rigaku R-AXIS Rapid II diffractometer (from a smaller sample) exhibits only hydrotalcite reflections, d ≈ 7.80 Å.
Fig. 7. Powder XRD pattern of sample Kir4940 (CuKα), Bragg–Brentano geometry: coexistence of hydrotalcite (d 003 = 7.76 Å) and quintinite (d 003 = 7.56 Å).
The indexing of the powder XRD patterns recorded for seven hydrotalcite samples using randomised material is shown in Fig. 8. As indicated by the reflection positions in Fig. 8a,b, some reflections overlap for the 3R and 2H polytypes. Characteristic reflections that can be used for separation of 3R and 2H phases are located in the 2θ range of 40–60°. The experimentally obtained diffraction patterns (Fig. 8) show the presence of only the 3R polytype in Kir4940; only the 2H polytype in 10532 and 10604; a mixture of 3R and 2H polytypes with a predominance of 3R in 158518, 79578, and 52071 and with a predominance of 2H in 105371.
Fig. 8. Powder XRD patterns of hydrotalcites (CoKα): (a) reflections for 2H polytype; (b) reflections for 3R polytype; (c–i) experimental diffractograms, sample numbers are shown on the right side. Reflections of 3R and 2H are marked as black and grey, respectively. Reflections of 2H are observed but not marked for (d) due to very low intensity. The 102* reflection of 3R is in fact an overlap of 009 and 102, when 2H is presented this also overlap with 006.
Discussion
Hydrotalcite localities and distribution of 3R and 2H polytypes
The present work confirms the unambiguous presence of hydrotalcite in Snarum (3R and 2H), Zelentsovskaya pit (2H), Praskovie–Evgenievskaya pit (2H), Talnakh (3R), St. Lawrence (3R and 2H), and Khibiny (3R). Our data on sample 10532 from the Zelentsovskaya pit are in good agreement with the previous studies of hydrotalcite (formerly ‘manasseite’) from the same locality by Ivanov and Aizikovich (Reference Ivanov and Aizikovich1980). These authors reported this material to be hydrotalcite-2H with d = 7.77 Å. The crystal chemical characteristics, i.e. polytype identification and d ≈ 7.80 Å for hydrotalcite from Snarum obtained in this work coincide with those reported previously by Mumpton et al. (Reference Mumpton, Jaffe and Thompson1965), Paush et al. (Reference Paush, Lohse, Schurmann and Allmann1986) and Mills et al. (Reference Mills, Christy and Schmitt2016). On the basis of the literature data for hydrotalcite (Frondel, Reference Frondel1941), pyroaurite (Aminoff and Broomé, Reference Aminoff and Broomé1931; Frondel, Reference Frondel1941; Ingram and Taylor, Reference Ingram and Taylor1967; Allmann, Reference Allmann1968) and stichtite (Mills et al., Reference Mills, Whitfield, Wilson, Woodhouse, Dipple, Raudsepp and Francis2011; Zhitova et al., Reference Zhitova, Pekov, Chukanov, Yapaskurt and Bocharov2019), one can expect intimate intergrowths of 3R and 2H polytypes for these minerals as the most typical case. However, our data show that hydrotalcite samples represented by pure 3R or 2H polytype are also common, and the single-polytype samples demonstrate more perfect crystals. Moreover, our study indicates the existence of only ‘classical’ 3R and 2H polytypes of hydrotalcite, i.e. with no long-range ordering of cations within the octahedral layers or anions in the interlayer that would produce a superstructure detectable by XRD.
For hydrotalcite-supergroup members with M 2+:M 3+ = 3:1 and their synthetic analogues, the existence of polytypes comprising doubled and tripled unit-cell parameters (as discussed in the Introduction) in comparison to the ‘classical’ 2H and 3R polytypes (i.e. a 6R polytype) should be rationalised and confirmed by particular crystal chemical reasons such as cation/anion ordering, stacking sequences, and mutual arrangement of layer and interlayer species, whereas simple adoption of data from powder-diffraction databases may result in the incorrect indexing of the powder XRD pattern. Thus, correct indexing of powder diffraction patterns and identification of structure for hydrotalcite and isotypic minerals and synthetic compounds requires careful consideration of possible superlattice reflections, peak intensities and their rationalisation.
Unit-cell metrics of hydrotalcite and quintinite
It is worth noting that the crystal structures of hydrotalcite-3R and quintinite-3R are topologically identical, as well as the crystal structures of hydrotalcite-2H and quintinite-2H. The crystallographic difference between hydrotalcite and quintinite is evidenced in the unit-cell dimensions. The range of polytypes shown by both hydrotalcite- and quinitine-group minerals means that a polytype cannot serve as an indicator of the group to which a mineral belongs. In principle, the compositionally distinct hydrotalcite and quintinite minerals can be distinguished by the dimensions of their subcells, specifically the distance a’ between two adjacent cations in the octahedral layer (M–M), which is equal to the a parameter if there is no long-range order in the layers, and the layer spacing d 00n of an n-layer polytype. The reported values for quintinite are: a’ = 3.02–3.06 Å and d ≈ 7.56 Å (Allmann and Jepsen, Reference Allmann and Jepsen1969; Arakcheeva et al., Reference Arakcheeva, Pushcharovskii, Atencio and Lubman1996; Chao and Gault, Reference Chao and Gault1997; Krivovichev et al., Reference Krivovichev, Yakovenchuk, Zhitova, Zolotarev, Pakhomovsky and Ivanyuk2010a,Reference Krivovichev, Yakovenchuk, Zhitova, Zolotarev, Pakhomovsky and Ivanyukb; Zhitova et al., Reference Zhitova, Yakovenchuk, Krivovichev, Zolotarev, Pakhomovsky and Ivanyuk2010, Reference Zhitova, Krivovichev, Yakovenchuk, Ivanyuk, Pakhomovsky and Mikhailova2018a,Reference Zhitova, Popov, Krivovichev, Zaitsev and Vlasenkob). The reported values for hydrotalcite are: a’ = 3.05–3.07 Å and d ≈ 7.80 Å (Mills et al., Reference Mills, Christy and Schmitt2016; Zhitova et al., Reference Zhitova, Krivovichev, Pekov, Yakovenchuk and Pakhomovsky2016 and references therein). Thus, due to the overlap of a’ for quintinite and hydrotalcite (that may be even stronger for different compositions) only the d value (neither polytype nor a’) can serve as a diagnostic crystallographic feature for distinguishing hydrotalcite from quintinite (Zhitova et al., Reference Zhitova, Krivovichev, Pekov, Yakovenchuk and Pakhomovsky2016).
Metal hydroxide layer: M2+:M3+ ratios and superstructures
Based on the assumption that hydrotalcite-supergroup members with M 2+:M 3+ = 2:1 and 3:1 are more common in nature than samples with other ratios, Hofmeister and von Platen (Reference Hofmeister and Von Platen1992) proposed the presence of a long-range cation ordering within metal hydroxide layers that dictates the ratio preference (Evans and Slade, Reference Evans, Slade, Duan and Evans2006). The theoretical schemes (Fig. 9) of ordered cation patterns imply, in accord with Hofmeister and von Platen (Reference Hofmeister and Von Platen1992): (1) 2 × 2 (hexagonal) or ![]() $ {\sqrt 3} $ × 2 (orthorhombic) superstructure for hydrotalcite; and (2)
$ {\sqrt 3} $ × 2 (orthorhombic) superstructure for hydrotalcite; and (2) ![]() $ {\sqrt 3} $ ×
$ {\sqrt 3} $ × ![]() $ {\sqrt 3} $ in-plane superstructure for quintinite.
$ {\sqrt 3} $ in-plane superstructure for quintinite.
Fig. 9. The (110) projection of metal hydroxide layer: (a) ![]() $ {\sqrt 3} $ ×
$ {\sqrt 3} $ × ![]() $ {\sqrt 3} $ superstructure in quintinite (M 2+:M 3+ = 2:1); (b) theoretical 2 × 2 superstructure in hydrotalcite (M 2+:M 3+ = 3:1); and (c) theoretical
$ {\sqrt 3} $ superstructure in quintinite (M 2+:M 3+ = 2:1); (b) theoretical 2 × 2 superstructure in hydrotalcite (M 2+:M 3+ = 3:1); and (c) theoretical ![]() $ {\sqrt 3} $ × 2 superstructure in hydrotalcite (M 2+:M 3+ = 3:1).
$ {\sqrt 3} $ × 2 superstructure in hydrotalcite (M 2+:M 3+ = 3:1).
Richardson (Reference Richardson2013) re-examined the different ways of M 3+ distribution that may occur in metal hydroxide layers from a theoretical point of view and validated all three superstructures as crystal-chemically possible. We should note that for the correct understanding of the discussion given below we need to distinguish the following types of atomic order and disorder: type (i) three-dimensional long-range order which results in additional (superstructure) Bragg reflections; type (ii) two-dimensional long-range order or three-dimensional short-range order, which at best result in extended rods or sheets of diffuse scattering in reciprocal space, but may not result in any diffraction evidences; and type (iii) true disorder at the unit cell scale.
It is noteworthy that the ordering of M 2+ and M 3+ cations according to the ![]() $ {\sqrt 3} $ ×
$ {\sqrt 3} $ × ![]() $ {\sqrt 3} $ superstructure was experimentally registered by single-crystal XRD study for numerous samples of hydrotalcite-supergroup minerals with M 2+:M 3+ = 2:1, including quintinite (Table 6). The
$ {\sqrt 3} $ superstructure was experimentally registered by single-crystal XRD study for numerous samples of hydrotalcite-supergroup minerals with M 2+:M 3+ = 2:1, including quintinite (Table 6). The ![]() $ {\sqrt 3} $ ×
$ {\sqrt 3} $ × ![]() $ {\sqrt 3} $ superstructure was also proved for a number of synthetic LDHs by the detection of superstructure reflections in the powder XRD patterns (Sissoko et al., Reference Sissoko, Iyagba, Sahai and Biloen1985; Britto et al., Reference Britto, Thomas, Kamath and Kannan2008; Britto and Kamath, Reference Britto and Kamath2009; Marappa and Kamath, Reference Marappa and Kamath2015). In contrast, neither the 2 × 2 nor the
$ {\sqrt 3} $ superstructure was also proved for a number of synthetic LDHs by the detection of superstructure reflections in the powder XRD patterns (Sissoko et al., Reference Sissoko, Iyagba, Sahai and Biloen1985; Britto et al., Reference Britto, Thomas, Kamath and Kannan2008; Britto and Kamath, Reference Britto and Kamath2009; Marappa and Kamath, Reference Marappa and Kamath2015). In contrast, neither the 2 × 2 nor the ![]() $ {\sqrt 3} $ × 2 superstructure have been confirmed for hydrotalcite-supergroup members by single-crystal or powder XRD. In the present study, we have found no reflections that could give a hint on the presence of the M 2+–M 3+ ordering. However, the absence of such superstructure reflections cannot uniquely serve as an evidence for the absence of a local superstructure (two-dimensional long-range order or three-dimensional short-range order). This is because the cation ordering within a single metal hydroxide layer may be lost in the third dimension due to the irregular localisation (and thus registration) of the M 3+ cations in adjacent layers (as a result of weak bonding). The quite common alternative explanation that the M 2+–M 3+ ordering cannot be observed due to the similar scattering power of Mg and Al is disproved by the experimental observation of scattering from long-range Mg–Al ordering for three polytypes of quintinite (Table 6). Below we provide a short review of the previous studies of the M 2+–M 3+ ordering for hydrotalcite-group minerals and their synthetic analogues by different techniques.
$ {\sqrt 3} $ × 2 superstructure have been confirmed for hydrotalcite-supergroup members by single-crystal or powder XRD. In the present study, we have found no reflections that could give a hint on the presence of the M 2+–M 3+ ordering. However, the absence of such superstructure reflections cannot uniquely serve as an evidence for the absence of a local superstructure (two-dimensional long-range order or three-dimensional short-range order). This is because the cation ordering within a single metal hydroxide layer may be lost in the third dimension due to the irregular localisation (and thus registration) of the M 3+ cations in adjacent layers (as a result of weak bonding). The quite common alternative explanation that the M 2+–M 3+ ordering cannot be observed due to the similar scattering power of Mg and Al is disproved by the experimental observation of scattering from long-range Mg–Al ordering for three polytypes of quintinite (Table 6). Below we provide a short review of the previous studies of the M 2+–M 3+ ordering for hydrotalcite-group minerals and their synthetic analogues by different techniques.
Table 6. Hydrotalcite-supergroup minerals comprising ![]() $\sqrt 3 \times \sqrt 3 $ superstructure due to long-range ordering of M 2+ and M 3+ (M 2+:M 3+ = 2:1) within the metal hydroxide layer.
$\sqrt 3 \times \sqrt 3 $ superstructure due to long-range ordering of M 2+ and M 3+ (M 2+:M 3+ = 2:1) within the metal hydroxide layer.
* Numbers are rounded for the sake of simplicity.
[1] Krivovichev et al. (Reference Krivovichev, Yakovenchuk, Zhitova, Zolotarev, Pakhomovsky and Ivanyuk2010a), [2] Arakcheeva et al. (Reference Arakcheeva, Pushcharovskii, Atencio and Lubman1996), [3] Zhitova et al. (Reference Zhitova, Krivovichev, Yakovenchuk, Ivanyuk, Pakhomovsky and Mikhailova2018a), [4] Krivovichev et al. (Reference Krivovichev, Yakovenchuk, Zhitova, Zolotarev, Pakhomovsky and Ivanyuk2010b), [5] Krivovichev et al. (Reference Krivovichev, Antonov, Zhitova, Zolotarev, Krivovichev and Yakovenchuk2012), [6] Zhitova et al. (Reference Zhitova, Popov, Krivovichev, Zaitsev and Vlasenko2018b), [7] Cooper and Hawthorne (Reference Cooper and Hawthorne1996), [8] Huminicki and Hawthorne (Reference Huminicki and Hawthorne2003), [9] Walenta (Reference Walenta1984), [10] Bonaccorsi et al. (Reference Bonaccorsi, Merlino and Orlandi2007), [11] Kolitsch et al. (Reference Kolitsch, Giester and Pippinger2013), [12] Bonaccorsi et al. (Reference Bonaccorsi, Merlino and Orlandi2007), [13] Mills et al. (Reference Mills, Christy, Kampf, Housley, Favreau, Boulliard and Bourgoin2012b), [14] Mills et al. (Reference Mills, Kampf, Housley, Favreau, Pasero, Biagioni, Merlino, Berbain and Orlandi2012c), [15] Sacerdoti and Passaglia (Reference Sacerdoti and Passaglia1988), [16] Allmann (Reference Allmann1977).
The experimental evidence of a 2 × 2 superstructure (a ≈ 6.2 Å) is an image obtained by scanning tunnel microscopy for synthetic ‘hydrotalcite’ having high Cl content with the chemical formula [Mg6Al2(OH)16](CO3)0.5Cl(H2O)2 (Yao et al., Reference Yao, Taniguchi, Nakata, Takahashi and Yamagishi1998). However, the same crystal studied by atomic force microscopy was reported as having no obvious superstructure (a ≈ 3.1 Å). Different superstructures were observed for the same material during anion-exchange experiments and were interpreted as anion rather than cation ordering (Yao et al., Reference Yao, Taniguchi, Nakata, Takahashi and Yamagishi1998). On the basis of ion-exchange chromatography on acid digests of stichtite, [Mg6Cr23+(OH)16](CO3)(H2O)4, Hansen and Koch (Reference Hansen and Koch1996) concluded that M 2+ and M 3+ distribution is not always completely random (implying local ordering of type (ii)). Drits and Bookin (Reference Drits, Bookin and Rives2001) concluded that hydrotalcite, pyroaurite and desautelsite, [Mg6Mn23+(OH)16](CO3)(H2O)4, are characterised by a random distribution of M 2+ and M 3+ cations (implying the absence of long-range ordering) by analysing powder XRD patterns and literature data. Multinuclear magnetic resonance spectroscopy of synthetic Mg–Al LDHs with different M 2+:M 3+ ratios indicated a completely ordered cation distribution in the LDH sample with M 2+:M 3+ = 2:1 (type (i)) and non-random distribution of cations for LDHs with higher M 2+:M 3+ ratios (including M 2+:M 3+ = 3:1), with no M 3+–M 3+ close contacts (Sideris et al., Reference Sideris, Nielsen, Gan and Grey2008), i.e. the absence of long-range ordering for M 2+:M 3+ = 3:1. Local ordering of Al3+ cations (type (ii)) in synthetic Zn3Al-I LDHs according to the orthorhombic superstructure was suggested by Aimoz et al. (Reference Aimoz, Taviot-Guého, Churakov, Chukalina, Dähn, Curti, Bordet and Vespa2012) based on extended X-ray absorption fine structure (EXAFS) data. Finally, the early study of pyroaurite (Fe3+-analogue of hydrotalcite) by selected-area electron diffraction (Ingram and Taylor, Reference Ingram and Taylor1967) indicated no superstructure (a ≈ 3.1 Å), but some areas gave the ![]() $ {\sqrt 3} $ ×
$ {\sqrt 3} $ × ![]() $ {\sqrt 3} $ superstructure that was attributed to a differing M 2+:M 3+ ratio. These results, of an absence of long-range ordering of M 2+ and M 3+ cations in pyroarite, are in agreement with structure determination undertaken by Allmann and Lohse (Reference Allmann and Lohse1966).
$ {\sqrt 3} $ superstructure that was attributed to a differing M 2+:M 3+ ratio. These results, of an absence of long-range ordering of M 2+ and M 3+ cations in pyroarite, are in agreement with structure determination undertaken by Allmann and Lohse (Reference Allmann and Lohse1966).
In general, no definite conclusion exists on the distribution of M 2+–M 3+ cations in the LDHs with M 2+:M 3+ = 3:1. The literature data mainly suggest local ordering of M 2+ and M 3+ cations within the metal hydroxide layer, in contradiction to the idea of Hofmeister and von Platen (Reference Hofmeister and Von Platen1992). In our study, we found no signs of any superstructure in hydrotalcite that can be observed by X-ray diffraction methods, which does not deny that local ordering of type (ii) (two-dimensional long-range order or three-dimensional short-range order) occurs. We suggest that the potential insight into this issue of M 2+ and M 3+ ordering for LDHs with M 2+:M 3+ = 3:1 can be obtained through the techniques sensitive to the precise positions and orientations of carbonate ions (by comparison of the LDHs with M 2+:M 3+ = 2:1 and 3:1, i.e. by spectroscopic methods), because these characteristics have to reflect the localisation of charge-bearing M 3+ cations. Finally, this seems to be crystal-chemically possible that complete disorder (type (iii)) is unlikely, and that local order of type (ii) can be very strong despite there being not enough long-range (type (i)) coupling between layers to produce extra Bragg peaks. Thus, diffraction data may not show the true, much higher state of local cation order, and can indicate completely random distribution where methods giving information on local structure of the same material may show otherwise. This would explain the apparent contradictions between data obtained using different techniques.
Acknowledgements
The authors are grateful to the Smithsonian National Museum of Natural History (Washington, DC, USA) and Fersman Mineralogical Museum of Russian Academy of Sciences (Moscow, Russia) for collaboration. The experiments were done using facilities of XRD and Geomodel Resource Centers of St. Petersburg State University, Russia and at Durham University, UK. An initial visit to Durham University for EZ (2015–2016) was funded by the British Council Research Program. We thank Andrey Batsanov (Durham University) for collecting some of XRD data. This study was supported by the Russian Science Foundation (grant 17-77-10023). We thank Peter Leverett and two anonymous reviewers for their suggestions, and Associate Editor Anthony Kampf and Principal Editor Stuart Mills for manuscript handling.
Supplementary material
To view supplementary material for this article, please visit https://doi.org/10.1180/mgm.2018.145