


Introduction
The incorporation and diffusion of Be in corundum (α-Al2O3) has been of great interest to the gemmological community since the early 2000s, when it became apparent that crystals of natural corundum (ie. sapphire and ruby) were being treated by beryllium diffusion in order to modify their colour and increase their value (Emmett et al., Reference Emmett, Scarratt, McClure, Moses, Douthit, Hughes, Novak, Shigley, Wang and Bordelon2003). Whilst the exact treatment method was not clear, it is likely that corundum crystals were packed into some powder containing a Be mineral (e.g. BeAl2O4, chrysoberyl), potentially along with a flux (Hänni and Pettke, Reference Hänni and Pettke2002), and heated to >1700°C. The high temperatures, coupled with the high activity of BeO in the system induces Be in-diffusion, potentially along with some form of surface reaction given that chrysoberyl and corundum should react at these temperatures to form BeAl6O10 (Galakhov, Reference Galakhov1957). This treatment leads to Be concentrations of tens of atomic ppm (at. ppm), which is above the normal range for untreated natural corundum (generally <2 at. ppm in the structure, see the Supplementary material for details). All concentrations herein are presented in at. ppm. For Be in corundum, this is Be (wt. ppm) × 2.26. The elevated Be concentration is readily detected in gemmological laboratories by laser ablation-inductively coupled plasma-mass spectrometry (LA-ICP-MS; Hänni and Pettke, Reference Hänni and Pettke2002; Abduriyim and Kitawaki, Reference Abduriyim and Kitawaki2006), time-of-flight mass spectrometry (H.A. Wang et al., Reference Wang, Krzemnicki, Chalain, Lefèvre, Zhou and Cartier2016) and laser-induced breakdown spectroscopy (Krzemnicki et al., Reference Krzemnicki, Hänni and Walters2004), as well as, potentially, bands in the Fourier-transform infrared (FTIR) spectra centred at around 3060 and 2490 cm–1 (Balmer and Krzemnicki, Reference Balmer and Krzemnicki2015).
Whilst gemmological laboratories now routinely screen for colour modification of corundum by Be diffusion, the physical mechanism of beryllium incorporation and diffusion remains poorly understood. In fact, that beryllium can be incorporated into corundum at any readily measurable quantity is, in itself, notable. The structure of pure corundum comprises oxygen ions in hexagonal close packing, with two out of three octahedral sites occupied by Al3+ (Newnham and De Haan, Reference Newnham and De Haan1962). Notwithstanding the necessity for charge compensation, as Be2+ has a strong preference for tetrahedral coordination (Be is tetrahedrally coordinated in all of the 131 current IMA-approved minerals containing Be2+ as a major component [www.mindat.org, accessed January 15th 2022]), the structure of corundum should probably preclude Be incorporation at any notable (10s at. ppm or higher) concentrations.
Additionally, the fact that it is possible for gem treaters to homogenise millimetre- to centimetre-sized crystals in reasonable (economically feasible) times, probably hours to days, is significant. Whilst no precise determination of the diffusion coefficient (D) of Be in corundum exists, Emmett et al. (Reference Emmett, Scarratt, McClure, Moses, Douthit, Hughes, Novak, Shigley, Wang and Bordelon2003) estimated log10(D[m2s–1]) of –11 at 1800°C based on the time taken to homogenise crystals in diffusion experiments. Additionally, Abduriyim et al. (Reference Abduriyim, Kitawaki and Shida2004) presented profiles of Be concentration versus distance across corundum crystals annealed at 1800°C, which are consistent with log10(D[m2s–1]) of around –12.5. Regardless of the spread, these diffusivities are relatively high in terms of diffusivities of divalent cations in geologically relevant materials. The only higher diffusivities measured in corundum are associated with H and its isotopes, with log10(D[m2s–1]) between –8 and –10 at 1800°C (Hauffe and Hoeffgen, Reference Hauffe and Hoeffgen1970; Roberts et al., Reference Roberts, Elleman, Palmour III and Verghese1979; El-Aiat and Kröger, Reference El-Aiat and Kröger1982; Ramirez et al., Reference Ramirez, Gonzalez, Colera and Vila1997; Kronenberg et al., Reference Kronenberg, Castaing, Mitchell and Kirby2000; Belonoshko et al., Reference Belonoshko, Rosengren, Dong, Hultquist and Leygraf2004; Mao et al., Reference Mao, Chikada, Shimura, Suzuki and Terai2013; F. Wang et al., Reference Wang, Lai, Li, He and Li2016; Pan et al., Reference Pan, Xu, Lu, Lyu, Zhou, Yang, Niu, Li, Gao and Luo2021). The diffusivity of Mg is one to two orders of magnitude lower (log10(D[m2s–1]) ≈ –13; Ando, Reference Ando, Catlow and Mackrodt1987), with other measured elements (Al, O, Ni, Ga, REE, Pt, Cr, Ag, Ti and Cu) diffusing more slowly, with caveats given that experimental temperature ranges mean that direct comparisons are not always possible (Oishi and Kingery, Reference Oishi and Kingery1960; Paladino and Kingery, Reference Paladino and Kingery1962; Reddy and Cooper, Reference Reddy and Cooper1982; Lesage et al., Reference Lesage, Huntz and Petot-ervas1983; Haneda and Monty, Reference Haneda and Monty1989; Moya et al., Reference Moya, Moya, Juvé, Tréheux, Grattepain and Aucouturier1993; Sérier et al., Reference Sérier, Berroug, Juvé, Tréheux and Moya1993; Le Gall et al., Reference Le Gall, Lesage and Bernardini1994; Moya et al., Reference Moya, Moya, Sami, Juvé, Tréheux and Grattepain1995; Hickey et al., Reference Hickey, Martins, Román, Brocklesby and Wilkinson1996; Moya et al., Reference Moya, Moya, Lesage, Loudjani and Grattepain1998; Gontier-Moya et al., Reference Gontier-Moya, Bernardini and Moya2001; Legros et al., Reference Legros, Lesage, Borchardt, Kilo and Jomard2005; Apostolopoulos et al., Reference Apostolopoulos, Hickey, Sager and Wilkinson2006; Takahashi et al., Reference Takahashi, Mizoguchi, Nakagawa, Tohei, Sakaguchi, Kuwabara, Shibata, Yamamoto, Ohashi and Ikuhara2010; Fielitz et al., Reference Fielitz, Ganschow, Kelm and Borchardt2020).
These two observations – the potential for Be incorporation and its high diffusivity – form the motivation for this study, which aims to address how beryllium can be incorporated into corundum, from which some inferences regarding diffusion mechanisms can then be made. We present the results of calculations using density functional theory (DFT) addressing the incorporation of beryllium in corundum in both H-free and H-bearing systems. These are complemented by studies of FTIR spectra recorded from Be-diffused corundum crystals.
Methods
Calculations using density functional theory (DFT)
The modelling approach and numerical parameters are the same as in Balan (Reference Balan2020). Periodic models have been constructed using a 2×2×1 corundum supercell containing one Be atom associated with an Al vacancy and/or one H atom. Their structural and vibrational properties have been obtained within the density functional theory framework, using the PBE exchange-correlation functional (Perdew et al., Reference Perdew, Burke and Ernzerhof1996). Ionic cores were described using optimised norm-conserving Vanderbilt pseudopotentials from the SG15-ONCV library (Hamann, Reference Hamann2013; Schlipf and Gygi, Reference Schlipf and Gygi2015) and a 80 Ry cutoff on the plane-wave energy. Theoretical unit-cell parameters of pure corundum at zero pressure (a = b = 4.80 Å, c = 13.08 Å; Balan, Reference Balan2020) were used without further relaxation to produce the Be-bearing supercells. The relaxation of atomic internal coordinates was performed until the residual forces were <10−4 Ry per atomic unit. The macroscopic neutrality of electrostatically charged supercells was ensured by adding a compensating homogeneous electrostatic background. The infrared absorption has been calculated using the vibrational modes at the Brillouin zone centre (Γ point), the Born effective charge tensors and the electronic dielectric tensor; all these quantities being obtained using the linear response theory (Baroni et al., Reference Baroni, De Gironcoli, Dal Corso and Giannozzi2001). Model relaxation and vibrational calculations were performed using PWscf and PHonon codes, respectively, from the Quantum ESPRESSO package (Giannozzi et al. (Reference Giannozzi, Baroni, Bonini, Calandra, Car, Cavazzoni, Ceresoli, Chiarotti, Cococcioni and Dabo2009); http://www.quantum-espresso.org).
FTIR spectra and trace-element contents of 1000 faceted crystals
A subset of analyses of 1000 corundum crystals showing elevated Be contents (>0.5 at. ppm) was extracted from a larger database of faceted crystals analysed by the Gemological Institute of America (herein GIA, with data compiled from laboratories in Bangkok, Hong Kong, Tokyo, Carlsbad and New York). Each crystal was analysed by both LA-ICP-MS and FTIR spectroscopy. The exact analytical routines vary, but, in general, LA-ICP-MS data were acquired using ESI 213 nm Nd:YAG laser ablation systems coupled to Thermo iCAP-Q inductively coupled plasma quadrupole mass spectrometers, with one to six analyses on the girdle of each crystal. The Be contents are determined from each analysis using an Excel spreadsheet, with 27Al as the internal standard, and a series of in-house corundum standards and NIST glasses (610 and 612) used as external standards. In general, FTIR spectra were acquired using unpolarised light on whole crystals using Thermo iS50 systems equipped with integrating spheres and liquid-nitrogen-cooled MCT detectors. In most analyses, the crystal is placed ‘table-down’, i.e. resting on its main flat face, with the incident beam nominally passing from girdle to girdle. The region of interest of each FTIR spectrum (2500–3550 cm–1) was processed by fitting a baseline using a method wherein the spectrum was added to a U-shaped parabola, a boundary was drawn around the parabola plus spectrum, then the boundary was subtracted. Example spectra, along with baselines, are presented in Fig. 1. Then, the integrated areas of the two main bands, with maxima at 3062 and 2490 cm–1 were determined by trapezoidal numerical integration after removing contributions from organics in the 2800–3000 cm–1 wavenumber region. Herein, these bands are referred to as the unresolved 3062 and 2490 cm–1 bands, to avoid confusion with resolved bands, described below. Specifically, this was done by fitting several Gaussian curves representing organic contributions, and subtracting the fits from the spectra prior to numerical integration. The limits of integration were 2430 and 2570 cm–1 for the unresolved 2490 cm–1 band, and 2975 and 3230 for the unresolved 3062 cm–1 band.

Fig. 1. Examples of spectra (solid lines) from the 1000 crystal dataset, with baselines (dashed lines), offset for clarity. The measured maximum and minimum Be contents on the surfaces of the three crystals, in at. ppm, are: (a) 24.9, 37.1; (b) 21.0, 21.2; and (c) 22.6, 27.6.
Correcting the spectra to constant thickness is not straightforward, as the complex shapes of the faceted crystals means that the exact path length of the infrared light is not known, and generally cannot be constrained. In lieu of a precise determination, estimates were made by using the recorded dimensions of the crystals to bracket potential path lengths. Each spectrum was thickness corrected twice, using both the maxima and minima of the recorded length and width of the crystal. As the spectra were recorded using unpolarised light on randomly oriented samples, the total absorbance was estimated as a maximum and minimum, by taking the two end-member scenarios, that the unpolarised spectrum was recorded on either a plane perpendicular or parallel to [0001]. To obtain total integrated absorbance for the unresolved 2490 cm–1 band from an unpolarised spectrum measured in a plane parallel to [0001], the measured integrated absorbance is multiplied by 2.5. For a plane perpendicular to [0001], a factor of 5.3 is used. The equivalent factors for the unresolved 3062 cm–1 band are 2.4 and 6.4, respectively. These values are based on the polarisation of the defects and are determined from the spectra acquired using polarised light (method described above, derivation of values described in the results). The final result is, for each crystal, a range of Be contents from LA-ICP-MS analyses, and a range of thickness and orientation-corrected integrated absorbance, incorporating the major uncertainties associated with the methods used in FTIR data collection. All raw spectra and metadata (sample IDs, Be concentration, crystal dimensions) are available in the Supplementary material.
FTIR spectra from one Be-diffused crystal
A 0.14 g faceted crystal of yellow Be-diffused corundum was selected from the research collection of the GIA. The [0001] direction was located using a polariscope, then a slab was cut from the centre of the crystal, perpendicular to the table (the main flat surface), such that the [0001] direction was parallel to the surface of the slab. The estimated maximum inaccuracy when locating the [0001] direction using this method is 10°. The slab was then ground to 720 μm thickness, polished on both faces using 6 μm diamond grit embedded in a tin alloy lap. The crystal was mapped using unpolarised FTIR spectroscopy at the GIA to assess variability in the spectra (see the Supplementary material), and one homogeneous area was identified for further analysis. From LA-ICP-MS analyses, the Be concentration in this area was 29.9 ± 0.6 at. ppm (1 s.d.; further details and concentrations of other elements in the Supplementary material).
Polarised spectra were recorded in this area, every 15° from 0° (approximately to E||[0001]) to 345°, using a Thermo Nicolet iN10 microscope equipped with a ZnSe wire-grid polariser at the Lamont-Doherty Earth Observatory of Columbia University (Palisades, New York, USA), using a 200 × 200 μm aperture and 256 scans. As no stage with rotation capabilities was available, the polariser was rotated with the sample kept stationary, with a new background recorded at each polarisation angle. As the 0° measurement did not correspond exactly to E||[0001], the orientations were corrected using maximum and minimum absorbances in the Al–O overtone region, which also varies strongly with orientation, which led to 9.5° being subtracted from each nominal angle.
Results
Theoretical models of Be incorporation in corundum
Be2+ for Al3+ substitution
Results of DFT calculations are presented in Table 1. Substitutional incorporation of Be in corundum, without any charge-balancing cations, has been considered by replacing one Be atom for one Al atom at an octahedral site of the 2×2×1 corundum supercell, forming a negatively charged defect (Table 1). After relaxation, the Be atom consistently enters triangular (III) coordination, with three Be–O bonds with the oxygen atoms belonging to the basal plane of the Al-vacant octahedral site (Fig. 2a). Herein, a vacant octahedral site that is normally occupied by Al is described as ‘Al-vacant’, whereas a vacant site that is normally vacant is simply ‘vacant’. This plane corresponds to the large triangle of oxygen atoms, in contrast to the smaller oxygen triangle located between two face-sharing Al sites. The Be is therefore in a face shared between one vacant and one Al-vacant octahedral site. Beryllium in this configuration is denoted ${\rm Be}_{{\rm Al( B) }}^{\prime}$ herein, with subscript Al(B) referring to the basal plane of the Al site, and the superscript denoting the relative –1 charge in Kröger-Vink notation. Whilst this notation is not fully appropriate here, the defect could also be denoted $\{ {{\rm Be}_{{\rm Al( B) }}^{{\rm \bullet{\bullet} }} {\rm \ndash V}_{{\rm Al}}{^{\prime \prime \prime}}} \} ^{\prime}$
 , to emphasise that the Al site is effectively vacant. Note that such a charged defect should be coupled to another charge-balancing defect in a real crystal, whereas the charge compensation is ensured by a homogeneous counter-charge in the theoretical model. Although approximate, this approach provides a sound description of the local structural and vibrational properties of the defects (e.g. Balan, Reference Balan2020). The Be–O bond length is 1.632 Å (Table 1) and the Be atom is positioned slightly out of the basal plane in the direction of the centre of the octahedral site. Although not common, and to our knowledge never observed in minerals (Hawthorne and Huminicki, Reference Hawthorne, Huminicki and Grew2002, and see the introduction above), triangular coordination of Be has been reported in synthetic compounds, such as Ca12Be18O29 and Y2BeO4, albeit with slightly shorter Be–O distances (from 1.54 to 1.58 Å; Harris and Yakel, Reference Harris and Yakel1966; Reference Harris and Yakel1967). Whilst never described as a mineral, Y2BeO4 could potentially occur in silica-poor rocks that have been metasomatised by REE- and Be-rich fluids.
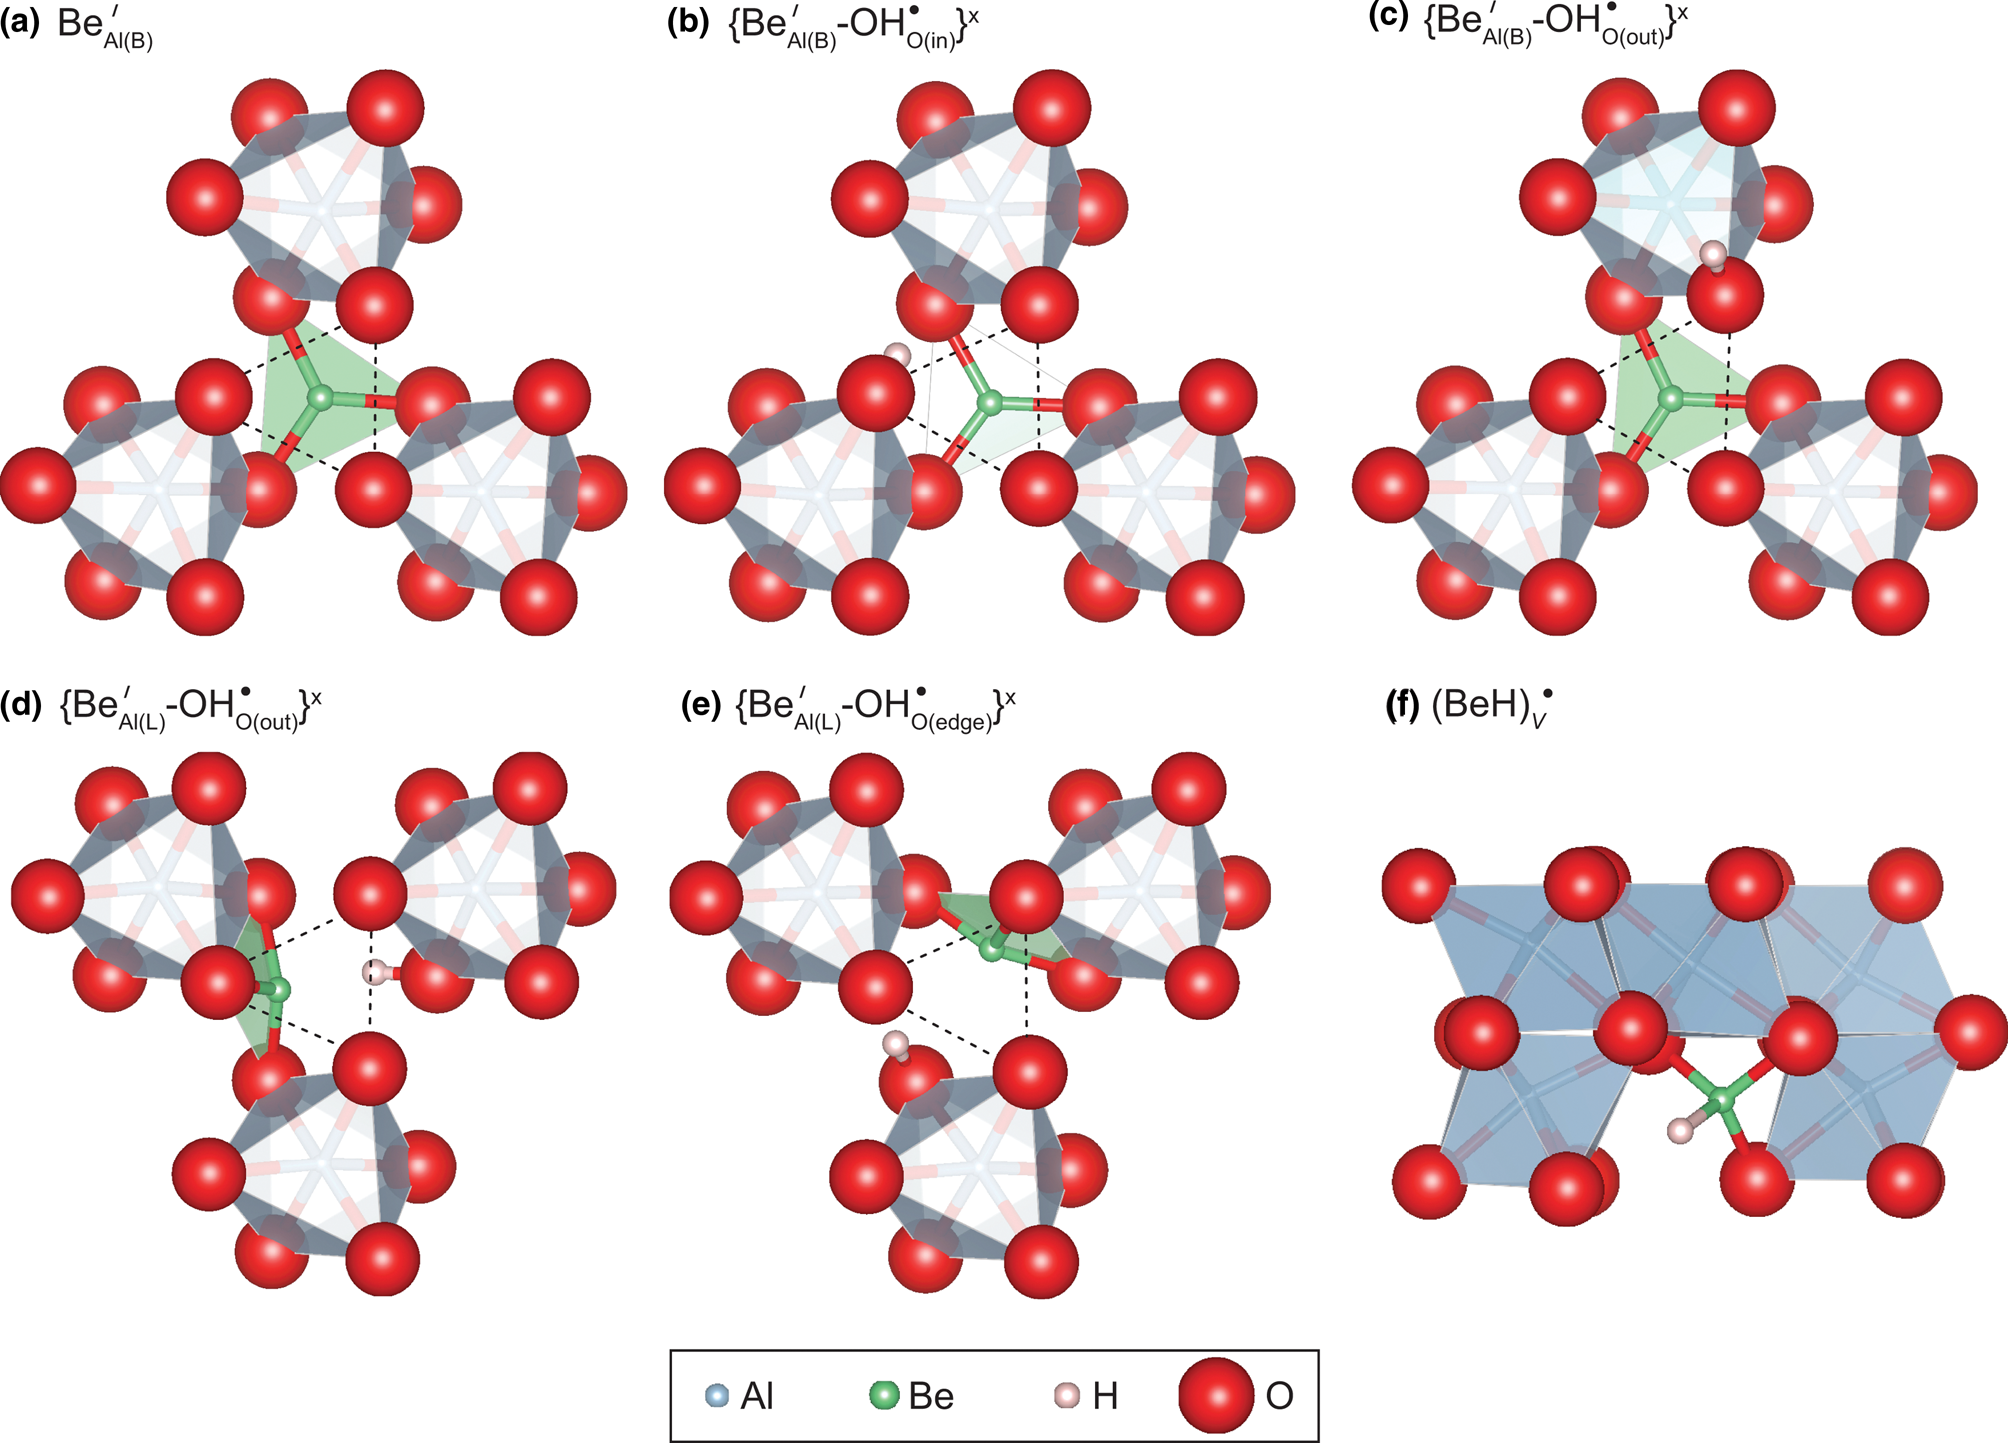
Fig. 2. Local theoretical configurations of Be-doped corundum. The small oxygen triangle of the vacant site is shown by the dotted triangles in (a–e). The light green triangles correspond to BeO3 groups. Views in (a–e) are parallel to the [0001] direction; in (f) the [0001] direction is vertical. Beryllium and H have been assigned enlarged ionic radii of 0.5 Å, for visualisation only.
Table 1. Experimental and theoretical properties of X–H stretching bands in Be-bearing corundum. X = O in for all defects except ${\rm ( BeH) }_{\rm V}^{\rm \bullet }$ , where X = Be. The I x, I y and I z values correspond to relative absorption intensities along cartesian axial directions, the z direction being parallel to [0001].

One possibility for attaining electrostatic charge balance of this Be2+ for Al3+ substitution is by the addition of a proton in the vicinity of the Al-vacant site. Starting from the configuration described above, the most probable location of the proton is one of the under-bonded oxygen atoms belonging to the small oxygen triangle shared with the adjacent octahedron occupied by Al. Two stable configurations occur depending on the orientation of the OH group, which can point in towards the centre, ie. $\{ {\rm Be}_{{\rm Al( B) }}^{\prime} \ndash {\rm OH}_{{\rm O( in) }}^{\rm \bullet } \} ^ \times \;$ (Fig. 2b) or point out, towards the exterior of the Al-vacant site, ie. $\{ {\rm Be}_{{\rm Al( B) }}^{\prime} \ndash {\rm OH}_{{\rm O( out) }}^{\rm \bullet } \} ^ \times$
 (Fig. 2c). In the $\{ {\rm Be}_{{\rm Al( B) }}^{\prime} \ndash {\rm OH}_{{\rm O( in) }}^{\rm \bullet } \} ^ \times$
 configuration, the OH bond length is 0.9988 Å and the OH group shares a H bond with one of the oxygens located at a distance of 1.671 Å from the H atom, which belongs to the basal BeO3 triangle. In the $\{ {\rm Be}_{{\rm Al( B) }}^{\prime} \ndash {\rm OH}_{{\rm O, out}}^{\rm \bullet } \} ^ \times$
 model, the OH bond is slightly shorter (0.9954 Å) and cannot form a H-bond with a surrounding oxygen atom due to the geometry of the site. The $\{ {\rm Be}_{{\rm Al( B) }}^{\prime} \ndash {\rm OH}_{{\rm O( in) }}^{\rm \bullet } \} ^ \times$
 is more stable than the $\{ {\rm Be}_{{\rm Al( B) }}^{\prime} \ndash {\rm OH}_{{\rm O( out) }}^{\rm \bullet } \} ^ \times$
 configuration by 38 kJ/mol. The theoretical OH stretching frequencies are 3096 and 3234 cm–1, for the $\{ {\rm Be}_{{\rm Al( B) }}^{\prime} \ndash {\rm OH}_{{\rm O( in) }}^{\rm \bullet } \} ^ \times$
 and $\{ {\rm Be}_{{\rm Al( B) }}^{\prime} \ndash {\rm OH}_{{\rm O( out) }}^{\rm \bullet } \} ^ \times$
 configurations, respectively. The respective molar extinction coefficients are 261,000 and 109,000 L${\rm mol}_{{\rm H}_ 2}^{{\rm \ndash 1}}$
 cm–2 (Table 1). The polarisation of both defects is oriented preferentially along the [0001] direction with θ angles between the [0001] direction and the mode effective charge vector (Gonze and Lee, Reference Gonze and Lee1997) of 36° and 28°, respectively.
Two other stable configurations have been obtained by setting the proton in the proximity of one of the oxygen atoms belonging to the large triangle forming the basal plane of the Al-vacant octahedral site. After relaxation, the Be occupies a lateral (L) position, forming Be–O bonds with the oxygen triangle on the side of Al-vacant site and opposite to the OH group. In both cases, the Be is shifted slightly towards the centre of the octahedron away from the oxygen triangle. In the configuration denoted $\{ {\rm Be}_{{\rm Al( L) }}^{\prime} {\rm \ndash OH}_{{\rm O( out) }}^{\rm \bullet } \} ^ \times$ (Fig. 2d), the OH group lies in the large triangle/basal plane with an orientation nearly parallel to the (001) plane, but pointing slightly out of the octahedron. In the $\{ {\rm Be}_{{\rm Al( L) }}^{\prime} {\rm \ndash OH}_{{\rm O( edge) }}^{\rm \bullet } \} ^ \times$
 configuration (Fig. 2e), the OH group lies in an orientation approximately parallel to the edge of the Al-vacant octahedron, sharing a H-bond with one of the under-bonded oxygen atoms located on the small triangle of the Al-vacant site. The OH stretching frequencies are 3533 and 2246 cm–1 for the $\{ {\rm Be}_{{\rm Al( L) }}^{\prime} {\rm \ndash OH}_{{\rm O( out) }}^{\rm \bullet } \} ^ \times$
 and $\{ {\rm Be}_{{\rm Al( L) }}^{\prime} {\rm \ndash OH}_{{\rm O( edge) }}^{\rm \bullet } \} ^ \times$
 configurations, respectively. These two configurations are less stable than the $\{ {\rm Be}_{{\rm Al( B) }}^{\prime} {\rm \ndash OH}_{{\rm O( in) }}^{\rm \bullet } \} ^ \times$
 configuration by 41 and 35 kJ/mol, respectively (Table 1).
Interstitial Be–H groups (beryllium hydrides)
Considering its limited charge disequilibrium (+1), a model of interstitial beryllium hydride (BeH) has also been investigated (Fig. 2f). In this case, the Be–H group is located in a vacant octahedral site separating two pairs of occupied octahedral sites along the [0001] direction, ie. can be described approximately as ${\rm ( BeH) }_{\rm V}^{\rm \bullet }$ , or, in other words, as an interstitial cluster comprising Be and H. This is in contrast to the defects described above where Be is associated with OH–, where the Be occupies one face of the Al-vacant site. Total energy minimisation leads to a stable configuration of the BeH model. The Be atom is coordinated to three oxygen atoms with Be–O bond lengths ranging from 1.55 to 1.62 Å and the Be–H bond points toward the centre of the vacant octahedral site. The Be–H distance is 1.24 Å, which is slightly shorter than its counterpart in gas-phase BeH (1.342 Å) or BeH2 (1.326 Å) molecules (Shayesteh et al., Reference Shayesteh, Tereszchuk, Bernath and Colin2003b, Reference Shayesteh, Tereszchuk, Bernath and Colin2003a). The Be–H stretching frequency is 2602 cm–1, significantly lower than the OH stretching frequencies calculated for the substitutional Be defects.
Be content versus integrated areas of FTIR bands
The Be contents versus the summed integrated areas of the two unresolved bands (3062 and 2490 cm–1) for 1000 crystals, is shown in Fig. 3. Equivalent figures for the individual bands are available in the Supplementary material. Each crystal is represented as a box with the upper and lower bounds in y representing the range of thicknesses and orientation factors used to determine total absorbance, and the range in x representing the range of Be concentrations from LA-ICP-MS analyses. The box colours qualitatively represent the colours of the crystals. The data show that, whilst the summed absorbance of the three bands is extremely variable in these crystals and there is no clear correlation between this and the Be concentration, it is clear that the lower right section of the plot is occupied, where the upper left section is vacant. For example, a Be concentration of 20 at. ppm appears to correspond to a maximum total integrated absorbance of around 450 cm–2. It is important to note that the FTIR spectra can be assumed to represent the whole crystal volume, whereas the LA-ICP-MS analyses represent only several tens of μm nearest to the polished surface of the faceted crystal.

Fig. 3. Integrated absorbance of the sum of the three Be-associated bands (total absorbance, corrected for possible orientations and estimated thicknesses) versus Be content of corundum crystals from the GIA database with elevated Be, probably representing Be diffusion from an external source. Box sizes represent the ranges of values as described in the text, and box colours approximating the colours of the relevant crystals.
Polarised FTIR spectra
Polarised spectra consistently show strongest absorbance in the 2400–3450 cm–1 region with E||[0001] (Fig. 4). Regardless of orientation, the absorbance of the unresolved 3062 cm–1 band is higher than that of the unresolved 2490 cm–1 band. With E⟂[0001], the unresolved 3062 cm–1 band shows a sharp local maximum at 3082 cm–1, which is not observed with E||[0001], nor in any unpolarised spectra. As with the unpolarised spectra, the unresolved 3062 cm–1 band is consistently asymmetrical, with a tail at higher wavenumber. The asymmetry does not clearly change as a function of polariser angle. The unresolved 2490 cm–1 band also changes shape – with E⟂[0001] the band shows a clear shoulder at higher wavenumber, which is less visible with E||[0001].

Fig. 4. Polarised FTIR spectra. In (a.i) and (a.ii), baseline-corrected data are in grey, resolved bands in solid black, and sum of resolved bands in dashed black. Resolved bands are labelled with the wavenumber corresponding to highest absorbance, except the organic ‘doublet’, labelled o1 and o2. (a.i) A spectrum with E near ⟂[0001], with low absorbance of all bands, a sharp local maximum on the unresolved 3062 cm–1 band, and a clear shoulder on the unresolved 2490 cm–1 band. (a.ii) A spectrum closer to E||[0001], where the sharp local maximum on the unresolved 3062 cm–1 band is not visible. (b) Polar plots of the integrated absorbance of each resolved band. The considerable scatter associated with the 3140 cm–1 band (b.iv) is associated to this band's extreme sensitivity to the baseline correction routine. The points corresponding to (a.i) and (a.ii) are marked on (b.i). The apparent tilt in some plots probably relates to the fitting routine rather than any analytical issues – it can be increased or decreased by modifying baseline subtraction routines and peak positions/widths.
Discussion
Assignment of the unresolved 2490 and 3062 cm–1 bands defects associated with Be and H
The assignment of these bands to H-associated defects is based on their locations within the X–H stretching regions (eg. O–H stretching between ~3000–3700 cm–1, C–H between 2600–3300 cm–1, S–H around 2600 cm–1). This follows interpretations of bands associated with other defects involving divalent cations and H (Müller and Günthard, Reference Müller and Günthard1966; Ramirez et al., Reference Ramirez, Gonzalez, Colera and Vila1997). The relationship between integrated band area and H content could be potentially confirmed using secondary ionisation mass spectrometry, however it is probable that the H contents would be too low for quantification given current analytical limitations.
Whilst these bands have been suggested to relate to some Be-associated defect (Balmer and Krzemnicki, Reference Balmer and Krzemnicki2015), which is in line with observations of GIA gemmologists who noted that the bands appear in some Be-diffused corundum crystals (Virginia Schneider, Tyler Smith, pers. comm. 2021), the assignment has not been fully confirmed. The clearest support for the assignment comes from the relationship between the measured Be concentration and the integrated absorbance of the two bands. Whilst there is no clear correlation (Fig. 3), there is an apparent maximum absorbance for any given Be concentration, shown by the lack of data in the top left of the plot. If the absorbance of these bands was related to any other element, no such data-free area would be observed. The only caveat is that, if there were another element that is correlated with Be, then this could be responsible for the bands. However, this is not in line with the high diffusivity of Be, ie. Be should be decoupled from any element with lower diffusivity, which effectively means all elements except hydrogen (see above). Overall, the two unresolved bands can be confidently assigned to defects involving Be.
Resolving the unresolved 2490 and 3062 cm–1 bands
Whilst the areas of the unresolved 2490 and 3062 cm–1 bands in the 1000 crystal dataset were determined simply by numerical integration, both bands show asymmetry suggesting the presence of at least two resolvable bands. The following does not discuss the (at least) two commonly observed sharp bands between 2850 and 2980 cm–1 that are known to be associated with surficial organic contamination.
For the unresolved 2490 cm–1 band, the presence of two bands is corroborated by the shape of the band in polarised E⟂[0001] spectra with a high wavenumber shoulder – this band can be fitted using two overlapping bands with Gaussian forms, centred at 2491 (larger) and 2523 cm–1 (smaller), shown in Fig. 4a.ii and Table 2.
Table 2. Results of resolving polarised spectra into multiple bands, with Gaussian forms. FWHM is the full width at half maximum. The contribution to unresolved bands is given for an approximated unpolarised spectrum recorded on a plane parallel to [0001], calculated as the mean of the E⟂[0001] and E||[0001] spectra. The I x, I y and I z values are calculated from the maxima and minima from model fits (dashed lines in Fig. 4b), correcting for any tilt by assuming that maxima and minima should correspond to principal directions.

Resolving the unresolved 3062 cm–1 band is more complex, given its broad form. However, the clear asymmetry of the band in both polarised and unpolarised spectra with a high wavenumber shoulder (Fig. 1, Fig. 4) suggests that it may be reasonable to invoke two bands (although a single asymmetrical band cannot be fully ruled out). The DFT modelling supports this – there are only two stable configurations that have theoretical wavenumbers consistent with the observed 3000–3200 cm–1 range (Table 1), when allowing for a 10–130 cm–1 discrepancy between theoretical and observed wavenumber (e.g. Balan, Reference Balan2020; Jollands et al., Reference Jollands, Blanchard and Balan2020). Fitting of some unpolarised spectra using two Gaussian functions in this region yields best fit peak positions of 3058 and 3140 cm–1 for broad bands (FWHM around 110 cm–1, Table 2). However, the E⟂[0001] polarised spectra show a sharp local maximum in the unresolved 3062 cm–1 band at ~3080 cm–1, suggesting the presence of a third band. Fitting several polarised spectra leads to a best fit position of 3082 cm–1 for this band (Fig. 4a.ii), with a low FWHM (22 cm–1, Table 2). Overall, the smallest number of bands with Gaussian forms that are required to fit the unresolved 3062 cm–1 band in all spectra is three, although the very minor contribution of the 3082 cm–1 band relative to its two overlapping bands means that, even if present, it is not required to fit the unpolarised spectra nor the E||[0001] polarised spectra (Fig. 1, Fig. 4). Adding extra bands would generally improve the goodness of fit, but there is no clear basis for doing so.
All polarised spectra were then fitted using these five bands, keeping the positions and widths constant, and only allowing peak height to vary. While the goodness-of-fit can be improved by allowing position, width and height to vary, this gives internally consistent values, which are considered more important than fit quality. The 3058 cm–1 band, for example, can be best fit by a band centred anywhere between around 3035 and 3065 cm–1 and FWHM can be as low as 80 cm–1 (versus 107.8 cm–1 used in the fitting routine), if position, width and height are allowed to vary simultaneously.
The 2491 cm–1 band has highest absorbance with E||[0001], and the 2523 cm–1 band is relatively symmetrical, although its low absorbance means that there is considerable uncertainty. The 3058 and 3140 cm–1 bands both show the highest absorbance with E||[0001], with the 3140 cm–1 band being more strongly polarised. The 3082 cm–1 band displays the opposite polarisation – this is the only resolved band in the spectra in this study with strongest absorbance with E⟂[0001]. This band is only weakly polarised, with I z = 23.0% using the applied fit parameters.
It is also important to note that the low, broad nature of the unresolved 3062 cm–1 band makes it extremely sensitive to the applied baseline correction routine. The band has a tail extending to >3200 cm–1, which could be easily truncated or removed by aggressive baseline subtraction. This would especially affect the area of the 3140 cm–1 band, and could even change the band shape from more Gaussian to more Lorentzian.
Interpretation of the bands comprising the unresolved 3062 cm–1 band
Due to the approximate cancellation of the errors introduced by the two main theoretical approximations, i.e. the neglect of OH bond anharmonicity and the use of an approximate exchange-correlation functional, the difference between theoretical and experimental frequencies is expected to be in the 10 to ~130 cm–1 range (e.g. Balan, Reference Balan2020; Jollands et al., Reference Jollands, Blanchard and Balan2020). Accordingly, the position of the resolved band centred at 3058 cm–1, which is the main component of the unresolved 3062 cm–1 band, is consistent with the theoretical OH stretching frequency (3096 cm–1, Table 1) computed for the most stable configuration, $\{ {\rm Be}_{{\rm Al( B) }}^{\prime} {\rm \ndash OH}_{{\rm O( in) }}^{\rm \bullet } \} ^ \times$ (Fig. 2). The measured band polarisation (I z = 68.8%, Table 2) is similar to the calculated polarisation for this defect (I z = 65.4%, Table 1). The overlapping band at 3140 cm–1 probably represents the $\{ {\rm Be}_{{\rm Al( B) }}^{\prime} {\rm \ndash OH}_{{\rm O( out) }}^{\rm \bullet } \} ^ \times$
 configuration, the difference between theoretical (3234 cm–1) and measured stretching frequency being permissible. DFT calculations predict the OH bond associated with $\{ {\rm Be}_{{\rm Al( B) }}^{\prime} {\rm \ndash OH}_{{\rm O( out) }}^{\rm \bullet } \} ^ \times$
 to show the strongest polarisation of the stable defects, which is consistent with the FTIR data (Fig. 4), although the measured polarisation is stronger than the theoretical (I z = 94.8% and 78.8%, respectively).
In contrast, the theoretical frequencies of the stable $\{ {\rm Be}_{{\rm Al( L) }}^{\prime} {\rm \ndash OH}_{{\rm O( out) }}^{\rm \bullet } \} ^ \times$ and $\{ {\rm Be}_{{\rm Al( L) }}^{\prime} {\rm \ndash OH}_{{\rm O( edge) }}^{\rm \bullet } \} ^ \times$
 configurations, with Be in a lateral position, do not match any signal in the recorded spectra from either the maps or the 1000 crystal dataset. This suggests that, while there exist theoretically stable configurations involving Be in triangular coordination in a lateral position on the Al octahedron, in practise Be appears to exclusively occupy the basal plane (large triangle). Whether there are certain conditions (e.g. T and $f_{{\rm H}_2}$
 ) where the defects with lateral Be could be observed should be investigated experimentally – a major disadvantage of this study is that the conditions of Be diffusion in the crystals studied are unknown.
We have no explanation for the small, narrow band centred at 3082 cm–1. This cannot be assigned to organic contamination, as it is not observed in spectra where the unresolved 3062 cm–1 band is not present.
Interpretation of the bands comprising the unresolved 2490 cm–1 band
Assigning of the two overlapping bands comprising the unresolved 2490 cm–1 band to OH stretching vibrations is challenging. This range of OH stretching frequency would be indicative of significant hydrogen bonding and usually corresponds to broad bands due to the stronger anharmonic interactions involving the hydrogen bond (Libowitzky and Beran, Reference Libowitzky, Beran, Keppler and Smyth2006), whereas the 2491 cm–1 band is considerably narrower than the 3058 and 3140 cm–1 bands (full widths at half maxima ≈40 and ≈110 cm–1, respectively).
However, this frequency is in the range typical of other X–H stretching vibrations, where X is an atom heavier than H. In addition, this band is mainly (or quite possibly only) observed in Be-enriched corundum. Whilst there is considerable scatter, it does not appear that the intensity of this band is perfectly correlated to the unresolved 3062 cm–1 band, shown in the Supplementary material, thus it cannot be assigned to the same defect. Among the other potential X–H candidates studied, the presence of theoretical Be–H species (i.e. Be hydride) in the Be-diffused samples of pure corundum is the most likely. Interstitial Be–H groups have a moderate charge disequilibrium (+1) and a Be–H stretching frequency of 2600 cm–1, matching the position of the unresolved 2490 cm–1 band within the expected range of theoretical frequencies (Fig. 5). Whether this defect is assigned to the resolved 2491 or 2523 cm–1 bands is not exactly clear, though – the theoretical polarisation of both bands is broadly consistent with the measured polarisation. It is, however, likely that the simple proposed model corresponds to the dominant band at 2491 cm–1.

Fig. 5. Measured versus theoretical wavenumber for the three assigned bands. The open circles (B20) correspond to OH groups previously investigated by Balan (Reference Balan2020).
Be incorporation in the H-free system, and implications for Be diffusion
The comparison between recorded FTIR spectra and calculated Be-associated defects generally lends support to the validity of the DFT calculations, especially given the agreement between measured and calculated band polarisation.
By extension, this supports the validity of the calculated structure of the H-free Be-associated defect, ${\rm Be}_{{\rm Al( B) }}^{\prime}$ , where Be resides in the large triangle of an Al-vacant octahedral site. As a background of charge neutrality was imposed, this or a similar coordination environment should be the case regardless of the charge balancing mechanism, e.g. ${\rm Ti}_{{\rm Al}}^{\rm \bullet }$
 , ${\rm Si}_{{\rm Al}}^{\rm \bullet }$
 or ${\rm h}_{\rm \;}^{\rm \bullet }$
 (trapped hole). This may explain why the diffusivity of Be is higher than that of other cations measured so far, with the exception of H. The difference between the diffusivity of Be, as approximated by Emmett et al. (Reference Emmett, Scarratt, McClure, Moses, Douthit, Hughes, Novak, Shigley, Wang and Bordelon2003) and its group II neighbour Mg (Ando, Reference Ando, Catlow and Mackrodt1987) as described above, is especially notable.
If Be and Mg were occupying the same site, in the same way, ie, if both were octahedrally coordinated on one of the octahedral sites normally occupied by Al (as determined for Mg by Balan, Reference Balan2020), then the same diffusion mechanism could be invoked. A vacancy mechanism is the most likely in pure corundum at high oxygen partial pressure, where Al vacancies are the main ionic defect (Somjit and Yildiz, Reference Somjit and Yildiz2019). If the same diffusion mechanism is responsible for Be and Mg, similar diffusivities would be expected. Rather, the orders-of-magnitude difference between the diffusivities suggests that Be and Mg diffuse by different mechanisms.
This is consistent with the findings of this study, where it is shown that Be sits in triangular coordination in the large triangle at the base of an Al-vacant site. The octahedral site can be effectively considered as vacant. Therefore, Be diffusion may potentially be described as the exchange of this vacant site and an adjacent Al, with the Be being brought along with the vacancy. This means that where Mg needs to encounter a wandering vacancy in order to make a diffusive hop, Be does not, as it already has its own vacancy. The outcome would then be a higher diffusion coefficient for Be than for Mg. This would also be the case if Be resides in triangular coordination on one of the lateral faces of the Al-vacant octahedron. This mechanism is similar to the diffusion mechanism suggested for Be in olivine, wherein Be was suggested to occupy a tetrahedral interstitial site charge-balanced by an octahedral site vacancy (Jollands et al., Reference Jollands, Burnham, O'Neill, Hermann and Qian2016). Based on the findings of this study, however, it might be more reasonable to invoke Be in triangular coordination in olivine as well – this possibility was not considered previously.
Alternatively, one could also propose that Mg2+ in corundum diffuses by moving into an interstitial position (eg. the usually unoccupied interstitial site), leaving a vacant Al site into which an adjacent Al can move, allowing the Mg to move into the now vacant Al site. In either this case or a simple vacancy diffusion mechanism, this should require more energy than a simple exchange between an Al and a Be-associated vacancy. Overall, the substitution mechanism for Be presented in this study is consistent with its high diffusivity, and therefore explaining why Be diffusion is a viable tool for colour modification in corundum.
Summary
Calculations using density functional theory suggest that Be is incorporated into corundum in triangular coordination. This should be the case in systems where Be has been introduced by diffusion, and is probably also the case where Be is naturally incorporated during crystal growth, although defects where Be is charge balanced by other aliovalent ions (e.g. Ti4+) have not been considered. To our knowledge, this is the first demonstration of Be in triangular coordination in a natural system although Be in corundum occurs at very low concentrations (a few at. ppm) in nature. Where possible, the DFT models are corroborated using FTIR spectra. Taking the results from FTIR spectroscopy and DFT modelling together, we propose that bands centred at 3058 and 3140 cm–1 represent Be in triangular coordination in the basal plane of an Al-vacant octahedral site, with an OH bond pointing either into (3058 cm–1) or out of (3140 cm–1) the site. The band at 2491 cm–1 is proposed to represent a Be–H bond, where this beryllium hydride occupies a normally vacant site. Such peculiar Be configurations, where Be is generally associated with a vacant site, may explain the relatively high diffusivity of Be, which enables rapid and economical colour modification in corundum by Be diffusion.
Supplementary material
To view supplementary material for this article, please visit https://doi.org/10.1180/mgm.2022.63
Acknowledgements
Calculations have been performed using the computing resources of IMPMC (Sorbonne Université-CNRS-MNHN) and the HPC resources of IDRIS under the allocation 2021-A0080910820 attributed by GENCI (Grand Equipement National de Calcul Intensif). MCJ acknowledges support from various gemmological, analytical and scientific colleagues at the GIA for suggestions help with sample preparation and assistance with analyses. Notably, Virginia Schneider and Tyler Smith are thanked for making MCJ aware of the presence of apparently Be-associated bands in the FTIR spectra. Henry Towbin and Terry Plank for are thanked for facilitating access to the FTIR laboratory at the Lamont Doherty Earth Observatory.
Competing interests
The authors declare none.


