
INTRODUCTION
For a stratified probability sample of small, medium, and large private enterprises in China, Burt and Burzynska (Reference Burt and Burzynska2017) show that business success (in terms of employees, sales, and intellectual property) increases with the extent to which the CEO has a large, open network – a network rich in structural holes. Burt and Opper (Reference Burt and Opper2017) continue the analysis to show the same result with profit returns to assets and highlight the significance of early network events for the later success of the business. Like most such results, however, the network data were collected at the same time as the performance data. The network data in this case had the virtue of extending back over the history of the business, but the retrospective data were collected at the same time as the performance data.
We wondered whether the networks that predicted success at the time of the survey would extend into the future to predict survival five years later. Network prediction of business survival has been discussed as causal with respect to structural hole theory and population ecology (Burt, Reference Burt1992: 220–222), but we do not aspire to show that networks cause success. Even if current networks predict future survival, there remains a possibility that unobserved variables predict success at the time of the survey as well as five years later. Our goal is simply to reinforce the network prediction in the Burt, Burzynska, and Opper papers, showing that the advantage provided by a network rich in structural holes today continues years into the future. We also learn that the prediction is not as uniform as it was in the cross-sectional data. Network advantage primarily affects businesses already successful, which highlights a cumulative element, a ‘Mathew effect’, in the mechanism by which networks provide advantage.
DATA
We use the data analyzed in the Burt, Burzynska, and Opper papers. To keep this note brief, we rely on those papers for their description of the data. In addition to the control variables they use when predicting business success, the central variable is their network constraint measure of the extent to which the CEO running a sample company is surrounded by a small, closed network of business contacts. We continue a significant distinction made in the analyses between people cited as most valued this year (‘current contacts’), versus people cited as especially valued during significant events in the history of the entrepreneur's business (‘event contacts’). The former show the closure-trust association seen in business connections among managers in the West, while event contacts have the high-trust, personal support characteristics discussed as guanxi ties in China (Burt & Burzynska, Reference Burt and Burzynska2017: 233–238; Burt & Opper, Reference Burt and Opper2017: 514–519; Burt, Bian, & Opper, Reference Burt and Opper2017). The two categories overlap in that some event contacts are also cited as current contacts (Burt & Opper, Reference Burt and Opper2017: 503).
As a quick reminder of context, the data come from face-to-face interviews with 700 Chinese CEOs of private enterprises, primarily founder entrepreneurs, selected as a stratified random sample of private enterprises in three provinces surrounding the Yangtze River Delta: China's financial center, Shanghai, with Nanjing the capital of Jiangsu Province to the north, and Hangzhou the capital of Zhejiang Province to the south. The three provinces account in 2013 for 20.2% of China's gross domestic product, and 31.9% of China's imports and exports. The sample businesses were founded around the turn of the century and are a 2012 adaptation from samples surveyed in 2006 and 2009 by Nee and Opper (Reference Nee and Opper2012).
Survival Five Years Later
We took the 700 company names and addresses to a new Chinese website in which diverse government data on Chinese companies are collated (Qixin.com, launched in May, 2015). The search for company names did not include the survey data. Central and local government data are collated on a company's operational status, legal representation, website, and senior management. The company behind the website, Suzhou Berta Data Technology Company, offers applications that provide the website data in a convenient form to financial organizations, companies, law firms, government agencies, and job seekers generally. Our spot checks comparing government source data with data listed on Qixin showed that the website was promptly updated and accurate.
The first row of Table 1 shows that 266 of the 700 sample companies are not listed as operating in 2017. That is a substantial death rate of 38% – but that number is likely conservative. Closing a Chinese business can require legal fees for more than a year of paperwork with government authorities. A cheaper and easier way to adapt to an economic downturn is to let the business become ‘dormant’ in the sense of paying current debts/taxes, releasing employees, and ceasing operations – but keeping the company registered, ready to come back to life when business prospects improve. We distinguish in Table 1 two kinds of listed companies: active and dormant. We discuss companies listed on Qixin as ‘active’ if they meet two criteria: They are active enough to be located by Baidu, the web browser in China analogous to Google in the West, and they are visibly active in that qixin.com shows they updated their website in 2017 or posted job openings in 2017. We discuss as ‘dormant’ the companies listed in Qixin that could not be located by Baidu, and that neither updated their website nor posted job openings in 2017. The first row of Table 1 shows that a majority of sample companies listed on Qixin are active in 2017, but many are dormant. The active versus dormant distinction can be made in alternative ways, but our distinction in terms of browser visibility, job postings, and website updates is a feasible alternative that turns out to be consequential.[Footnote 1]
Table 1. Five-year survival by sample strata
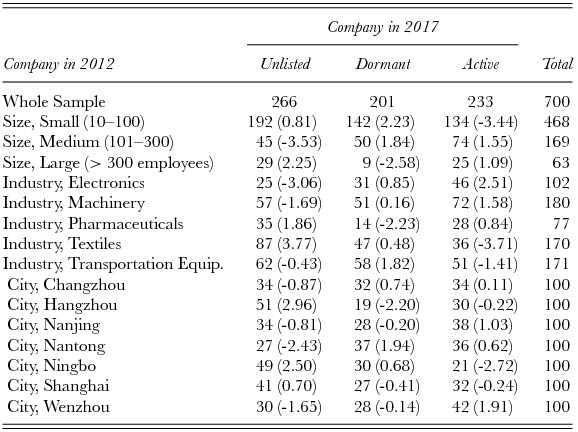
Notes: Frequencies are given with loglinear z-score test statistics (in parentheses) describing frequency relative to what would be expected if company condition in 2017 (columns) were independent of the 2012 sampling strata categories (rows). In the aggregate, the 2017 columns are not independent of the 2012 rows (22.40, 35.62, and 27.92 chi-square statistics for size, industry, and city respectively, with 4, 8, and 12 d.f. respectively, P < 0.01).
With respect to face validity, the three survival outcomes – unlisted, dormant, and active – are associated as might be expected with the sampling strata of small, medium, and large companies in 2012. Frequencies are presented in Table 1 with loglinear test statistics showing which frequencies are different from what one would expect if company condition in 2017 were independent of company size in 2012 (Goodman, Reference Goodman1970). For example, small companies in 2012 are likely to be dormant companies in 2017 (2.23 test statistic) and unlikely to be listed as active (-3.44 test statistic). These characteristics are to be expected from companies most at risk of death, and easiest to slip into dormancy. In contrast, large companies in 2012 are more clearly alive or dead in 2017 – they are unlikely to be dormant (-2.58 test statistic). Medium size companies in 2012 are less clearly alive or dead in 2017 – they are unlikely to be unlisted (-3.53 test statistic), but there is no countervailing tendency to be listed as active.
Survival outcomes also vary across the industries and cities from which the 2012 sample businesses were drawn, so they too are important controls in any prediction effort. Electronics companies in 2012 are likely to be active in 2017, while textiles companies are just the opposite, and are especially likely to be unlisted in 2017. Across cities, Ningbo – a major port city to the south of Shanghai – is where sample companies are unlikely to be active in 2017, and likely to disappear among the unlisted.
Anti-Corruption Campaign
The sample companies are entrepreneurial ventures, so we expected survival to be a struggle for quite a few. More, survival must have been especially difficult in the years following the 2012 survey since those were years of excess manufacturing capacity, decreasing investment, increasing private enterprise debt, and decreasing private enterprise profitability (e.g., Obstfeld, Reference Obstfeld2016).
In addition to economic difficulties, there was a political issue that has implications for company survival. The point was emphasized to us by a reviewer for this journal. The high death rate for Ningbo in Table 1 elicited a reviewer comment connecting the death rate to the fall of Huang Xingguo, a political leader prominent for his support of economic growth in Zhejiang Province. In Mr. Huang's early role as party chief in Taizhou, the city grew to one of the most affluent cities in the Yangtze River delta. He rose to vice governor of Zhejiang Province, and became party chief of Zhejiang's thriving port city, Ningbo (sample city in Table 1). In 2016, Mr. Huang was convicted of bribery, and sentenced to 12 years in prison (see the Wikipedia entry for ‘Huang Xingguo’). The reviewer believed that Mr. Huang's fall ‘caused a series of companies to restructure or disappear’ in Ningbo.
Mr. Huang was brought down – along with many other national and local political leaders – in the national government's anti-corruption campaign. The campaign began after the National Congress in 2012 and continued into 2017 (a succinct overview of the campaign is provided by the Wikipedia entry, ‘Anti-corruption campaign under Xi Jinping’). Private enterprise was not targeted directly, however, targeted government officials were prosecuted for gifts from private enterprise, so it is reasonable to suspect that the removal of officials previously helpful to gift-giving private businesses could be adverse to the survival of those businesses, especially government-connected private businesses prospering on fraudulent bookkeeping (Stuart & Wang, Reference Stuart and Wang2016).
The campaign was so sweeping that we initially assumed its effect would be on the intercept term in our regression models – evident as an especially low average rate of survival among our sample companies. Stimulated by the above-cited reviewer, however, we looked for a control variable measuring the extent to which each sample firm might be individually at high or low risk because of the campaign.
The 2012 survey includes data on entertainment and travel costs. Such costs are relevant to the anti-corruption campaign, and a standard accounting item for Chinese firms. As Cai, Fang, and Xu (Reference Cai, Fang and Xu2011: 56) report before the campaign (brackets added):
In addition to legitimate business travel and other expenses, Chinese managers commonly use the ETC [entertainment and travel cost] accounting category to reimburse expenditures used to bribe government officials, entertain clients and suppliers, or accommodate managerial excess. . . . We find that ETC is a mix that includes ‘grease’ money to obtain better government services, protection money to lower tax rates, managerial excesses, and normal business expenditures to build relational capital with suppliers and clients.
To control for a company's risk from the anti-corruption campaign we measure the percentage (for the year of the 2012 survey) of company revenue spent on entertainment and travel (computed as 100 times total entertainment and travel costs in 2011 divided by total sales for 2011).[Footnote 2] As expected, the highest percentage is for companies that end up unlisted in 2017, with lower percentages for companies in a dormant state, and still lower percentages for companies active in 2017 (2.3%, 2.0%, and 1.8% respectively; multinomial logit predicting the three 2017 outcomes across the columns of Table 1 from the entertainment and travel measure generates a 13.40 chi-square statistic, 2 d.f., P ~ 0.001).
RESULTS WITH AN ENTREPRENEUR'S WHOLE NETWORK
Table 2 contains the results of predicting the three company conditions in 2017 from characteristics of the company in 2012. The first column in Table 2 shows the extent to which each row predictor in 2012 is associated with companies ending up unlisted in 2017, rather than the reference category of dormant (middle column in Table 1). The second column of coefficients in Table 2 shows predictor associations with companies still active in 2017.
Table 2. Predicting company condition five years later
Notes: Results are from a multinomial logit model predicting which 2012 companies are unlisted or active in 2017. Reference outcome is companies dormant in 2017 (middle column in Table 1). Robust standard errors define z-score test statistics in parentheses. Chi-square fit statistic for the model is 115.73 with 42 d.f., P << 0.001 (pseudo R2 is 0.09).
Row variables describe the companies in 2012. Network constraint and the success dummy are discussed in the text. Entertainment and travel is the percent of 2011 revenue spent on entertainment and travel costs. Founder is 1 if CEO respondent in 2012 also founded the company. R&D department is 1 if respondent said the company engaged in R&D activity (significant predictor of business success in Burt & Burzynska, Reference Burt and Burzynska2017). The size, industry, and city categories are sampling strata. Small companies are the reference category for company size differences. Shanghai is the reference category for city differences. Transportation equipment is the reference category for industry differences.
Network Advantage Continues into 2017
We highlight three main network results in Table 2. The first is that the large, open networks associated with business success in 2012 are associated with businesses being still active in 2017. The earlier work shows success decreasing with the extent to which a company's CEO is constrained by a small, closed network of business contacts (Burt & Burzynska, Reference Burt and Burzynska2017: 225–233; Burt & Opper, Reference Burt and Opper2017: 519–529). The negative association in the first row of Table 1 between network constraint and being active in 2017 (-2.99 test statistic, P ~ 0.003) shows that those small, closed networks in 2012 lower the odds of being active five years later.
The earlier work shows that the network association with success disappears if the network around a respondent is limited to current contacts. Guanxi ties captured as event contacts need to be included in the predicting network (Burt & Burzynska, Reference Burt and Burzynska2017: 231–233; Burt & Opper, Reference Burt and Opper2017: 519). Consistent with the prior analyses, we find no network effect when an entrepreneur's network is limited to current contacts. If we replace the network constraint variables in the first and third rows of Table 2 with constraint measured in terms of current contacts only, the -2.99 test statistic for network constraint in the first row of Table 2 drops to a negligible -0.50, and the interaction effect with being less successful, in the third row of the table, drops from 2.12 to a negligible 0.89. In short, guanxi ties matter for survival as they did for relative success five years earlier.
Trajectory in 2012 Matters
The second main result in Table 2 is that initial trajectory matters. Companies that were not doing well in 2012 are less likely to be active in 2017. We have two trajectory controls in Table 2. The first is size in 2012: larger companies should be more able to weather the ups and downs of business, so we expected firms larger in 2012 to have better odds of surviving into 2017. They do. An ordinal logit prediction of the three columns in Table 1 (not presented) shows companies with more employees or more assets in 2012 are more likely to be active in 2017 (3.11 test statistic for log number of employees, 2.97 for log assets at the end of 2011). Size in terms of employees and assets turns out not to matter when other controls are introduced in Table 2, but our second trajectory measure matters quite a bit.[Footnote 3] Our second trajectory measure is relative profit in 2012. The ‘less successful’ predictor in the second row of Table 2 is a dummy variable equal to 1 for those companies making less profit in 2012 than was typical for a company with their assets, of their size, in their industry, operating in their city. ‘Less successful’ is defined as follows: Regress a company's profits for 2011 across the value of its assets for the year, the three sample strata for size, the five sample strata for industry, and the seven sample strata for city. Compute the residual profit. If a company's residual profit is less than the median, the ‘less successful’ dummy variable equals 1. The second row in Table 2 shows that companies less successful in 2012 are less likely to be active in 2017 (-2.17 test statistic, P < 0.05).
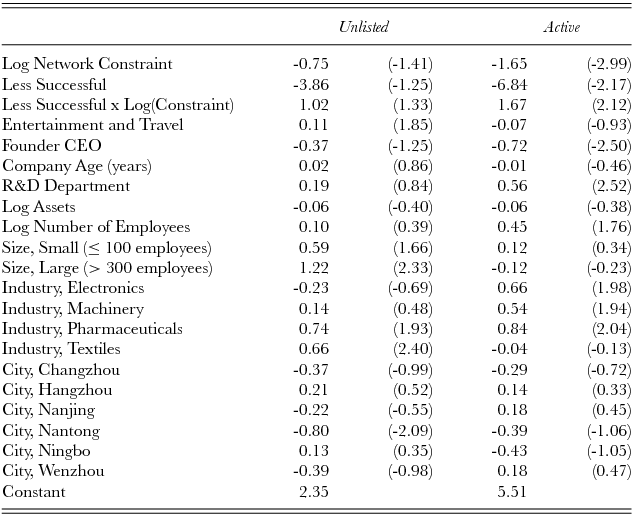
More, the interaction effect with network constraint in the third row of Table 2 shows that network advantage did not help companies less successful in 2012. The statistically significant coefficient for the interaction predictor in the third row of Table 2 completely eliminates the strong association in the first row (1.65 minus 1.67 leaves no association between constraint and activity in 2017). The direct and indirect network associations with survival are graphed in Figure 1. Network constraint is across the horizontal axis. Large, open networks are to the left (low constraint). Small, closed networks are to the right (high constraint). The plotted probabilities of being active in 2017 are raw counts aggregated within five-point intervals of network constraint. No controls are applied. We use Table 2 to show that the associations exist after controls are applied. The bold regression line through dark dots in Figure 1 illustrates the negative association in Table 2 between survival and network constraint for more successful entrepreneurs. The active businesses in 2017 are likely to be run by entrepreneurs who in 2012 were successful with large, open networks. The dashed regression line through hollow dots in Figure 1 illustrates the lack of network advantage for less successful entrepreneurs. The probability of a business being active in 2017 is relatively constant for less successful entrepreneurs with or without network advantage.
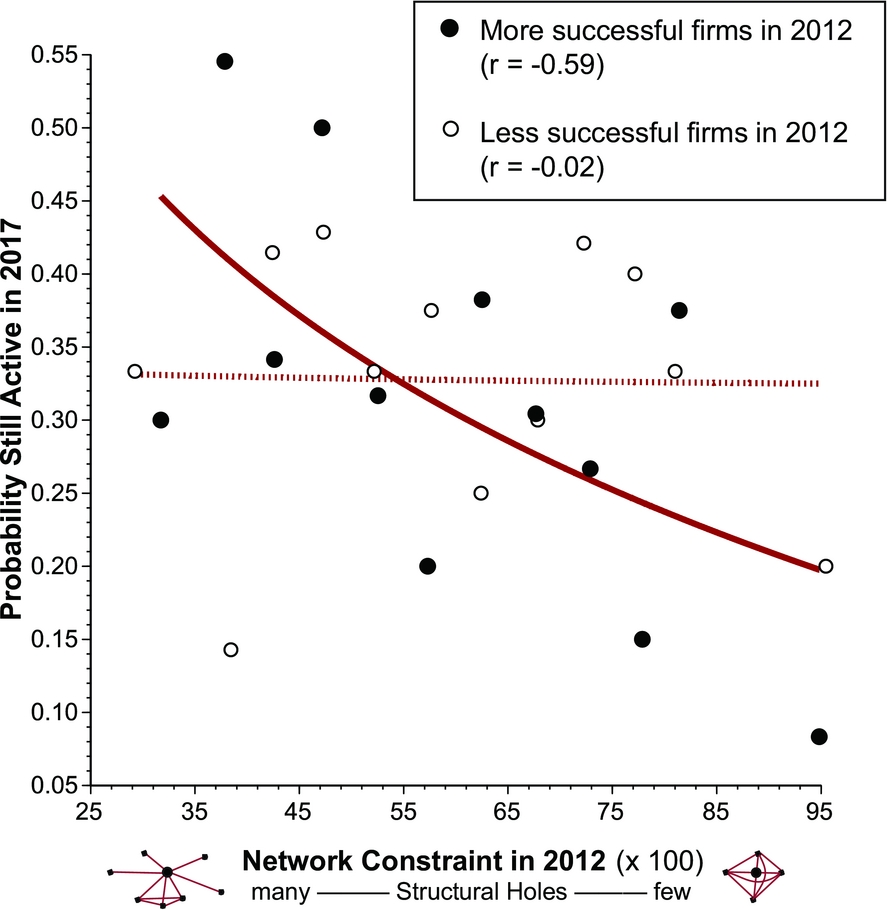
Figure 1. Network association with survival
Dead or Dormant
The third main result in Table 2 is that there is little network or success difference in 2012 between companies that are in 2017 officially closed (unlisted in government data) versus those allowed to go dormant. Officially closed companies are, relative to dormant companies, no more or less likely to have been run in 2012 by people with network advantage (-1.41 test statistic in first column of Table 2, P ~ 0.18), and no more or less likely to have been successful five years earlier (-1.25 test statistic, P ~ 0.22). These results highlight the substitutability in China of letting a business go dormant versus formally closing the business.
The point is also indicated by the founder effect in row five of Table 2. Companies in which a founder was CEO at the time of the survey were less successful in 2012 (Burt & Burzynska, Reference Burt and Burzynska2017: 232; Burt & Opper, Reference Burt and Opper2017: 527). The fifth row in Table 2 shows that those companies are also unlikely to be active in 2017 (-2.50 test statistic), but they show no tendency to disappear into the unlisted category (-1.25 test statistic). Rather, companies still run by a founder in 2012 are likely to go dormant in 2017, awaiting new business opportunities. When a founder remains in control of his or her company, going dormant is a preferred strategy for dealing with a business downturn.
Other Tests Not in Table 2
We looked into three other survival explanations that do not bear on our interest in the continuity of network advantage into the future but warrant brief note. Gender is a variable of frequent interest in studies of socioeconomic inequality in China (e.g., Xiu and Gunderson, Reference Xiu and Gunderson2013). No gender difference exists in the cross-sectional network prediction of business success (Burt & Burzynska, Reference Burt and Burzynska2017: 247), but we thought it might emerge over time to affect future survival. It doesn't. Adding a dummy variable to Table 2 to distinguish female CEOs in 2012 does not eliminate the network effects in Figure 1 and reveals no survival difference between men and women (4.82 chi-square, 2 d.f., P ~ 0.09).
Family too is a variable of perennial interest in studies of socioeconomic inequality in China (e.g., Guo & Miller, Reference Guo and Miller2010), and we know that family can play a significant role in the early development of the entrepreneurial businesses studied here (Burt & Opper, Reference Burt and Opper2017: 528). However, we find no evidence of family firms in 2012 being more or less likely to survive into 2017. We began with the common definition of family firms: owner-operated firms in which the respondent's spouse or children are employees (e.g., Miller & Lester, Reference Miller, Le Breton-Miller, Lester and Canella2007). By this criterion, 254 of the 700 sample companies are family firms. The family firms are a little less likely than other firms to be active in 2017. At the same time, they are a little less likely to be unlisted in 2017. What the family firms are likely to do, akin to the founder-run companies discussed above, is go dormant (2.26 test statistic, P ~ 0.02, for the tendency for 2012 family firms to be listed and inactive in 2017). It is also true that family firms are more likely to retain the same person as CEO in 2017 who was CEO in 2012: 74% of family firms listed in 2017 had the same CEO (or a son or brother of the CEO in 2012) versus 57% of other firms (13.18 chi-square, 1 d.f., P < 0.001). Zero-order associations aside, the survival difference between family versus other firms disappears when the family firm variable is added to the network, success, and control variables in Table 2 (0.89 chi-square, 2 d.f., P ~ 0.64). We get similarly negligible results if we add to Table 2 a broader measure of family presence: the percent of contacts in a CEO's network who are family (0.01 chi-square, 2 d.f., P ~ 0.99).
We also looked into a CEO's education and experience as a resource that could improve the survival odds of a business. A CEO's education in terms of years of formal schooling is a negligible addition to Table 2 (5.25 chi-square, 2 d.f., P ~ 0.07), but the probability a firm is active in 2017 increases with the 2012 CEO's degree level: 31% for high school graduates, 34% for some college, 42% for college graduates, and 55% for CEO's with more than a college degree. Regardless, dummy variables controlling for the four levels of education are a negligible addition to Table 2 (7.32 chi-square, 6 d.f., P ~ 0.29), as is adding degree level as a four-category interval measure (4.43 chi-square, 2 d.f., P ~ 0.10). Management experience looked promising in that companies run in 2012 by CEOs with no management experience were less likely to be active in 2017 (23% versus 34% of the companies run by CEOs with experience as middle or higher managers), and more likely to be closed (45%, versus 36% of the companies run by CEOs with experience). But a three-category distinction between no management experience, some experience, and experience as a middle or higher manager is a negligible addition to Table 2 (3.31 chi-square, 2 d.f., P ~ 0.19). Eighty-one of the sample companies were run in 2012 by CEOs who had played a manager role in one of China's state-owned enterprises (SOE), which could be a resource in dealing with SOE suppliers, competitors, or customers, which could improve the odds of still being active in 2017. Again, SOE management experience is a negligible addition to Table 2 (4.42 chi-square, 2 d.f., P ~ 0.11), perhaps because private enterprises had so little contact with SOEs (Nee & Opper, Reference Nee and Opper2012: 153– 156).
FROM A COCOON OF INITIAL CLOSURE TO A LATER NETWORK RICH IN STRUCTURAL HOLES
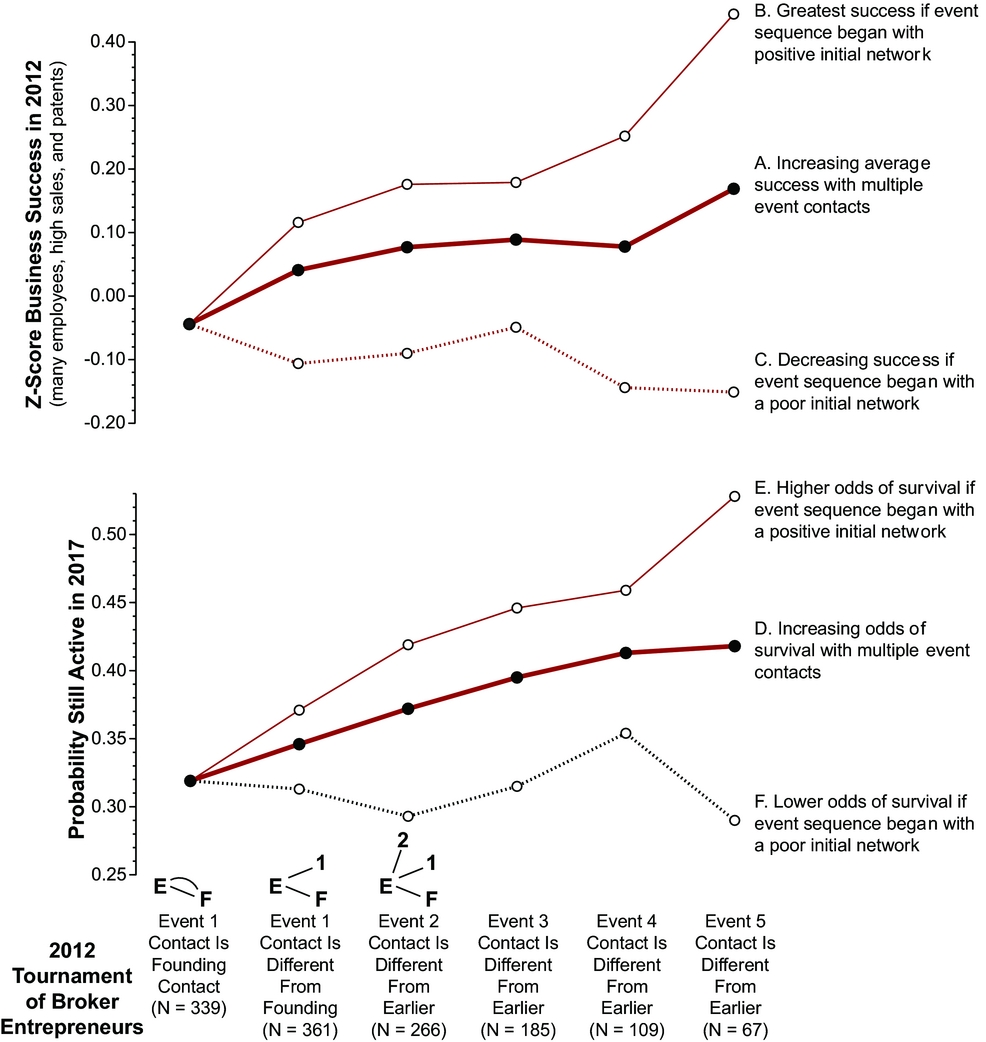
Burt and Opper (Reference Burt and Opper2017: 525–529) describe a kind of ‘cocoon hypothesis’ in which a closed network when founding the business increases the later success associated with a large, open network. Specifically, an early closed network, discussed by Burt and Opper as a ‘positive’ start, occurs when the person cited for help in founding the business was strongly connected to a second person cited for help during the business’ first significant event after founding. The positive initial network is like a cocoon around the new venture. In keeping with the ‘low success’ dummy variable in Table 2, we refer to a business beginning in any way other than ‘positive’ as having a ‘poor start’. There are two ways to have a poor start: turn to the same person for help in founding the business and during the first significant event or turn to two people who have little or no connection with each other.[Footnote 4]
Figure 2 shows that the higher success Burt and Opper report for businesses that began with a positive initial network, we also find in later survival. Companies are ordered in Figure 2 by expanding networks, left to right on the horizontal axis (cf., Burt & Opper, Reference Burt and Opper2017: 526). The first column contains the 339 companies in which the CEO named the same person as valuable in the business founding and first significant event. The second column contains the other 361 companies in which two different people were named. The third column contains the 266 companies in which the CEO named a third separate person as valuable on the next significant event. The tournament continues to the right with CEOs dropping out when they name a person already named on an earlier event. The sixth column contains the 67 companies in which the CEO named six different people as valuable in founding and in each subsequent significant event. The sixth column contains the CEOs with the largest, most open networks of event contacts, which is reflected in the increasing bold regression lines in the graphs. Repeating the result in Burt and Opper, the bold line increasing from left to right in the top graph shows business success in 2012 higher for CEOs with larger, more open networks. Consistent with our results in Table 2, the bold line increasing from left to right in the bottom graph shows businesses more likely to be active in 2017 when their CEO in 2012 had a larger, more open network.

Figure 2. Graphs of success and survival as a function of a positive initial network
The two thin lines in each graph illustrate the point about how a business began. Businesses are distinguished at the first significant event between those that began with a positive initial network (solid thin line) versus those that did not (dashed thin line). The thin solid line shows that business success (top graph), and the probability of being listed and active in 2017 (bottom graph), are higher on average in companies that began with a positive initial network. The dashed thin line in each graph shows business success, and the probability of being listed and active in 2017, are lower in companies that began with a poor start. By the end of the tournament, the bottom graph shows the probability of a company being active in 2017 is almost twice as high for the companies that began with a positive start (0.53 versus 0.29, a ratio of 1.82).
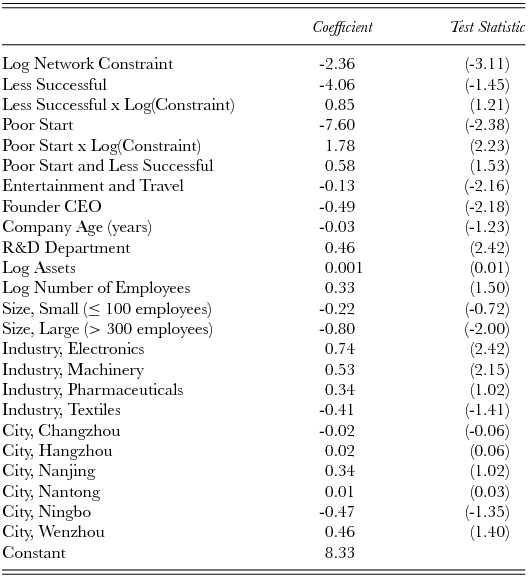
The logit model in Table 3 shows that the results in Figure 2 are statistically significant. The dependent variable in Table 3 is 1 if a company is active in 2017, else 0. Companies that began with a positive initial network are likely to benefit from a subsequent large, open network (-3.11 test statistic for network constraint in the first row of Table 3, P < 0.01). Poor-start companies are unlikely to be active in 2017 (-2.38 test statistic, P ~ 0.02), and having a large, open network in 2012 does not compensate for the poor start (positive coefficient 1.79 in fifth row of Table 3 reduces to insignificance the -2.36 coefficient in the first row between survival and network constraint). In other words, the success associated with getting off to a positive start is amplified over time for companies with a CEO who has a large, open network. There is no interaction effect between getting off to a poor start and being less successful in 2012 (1.53 test statistic), and low success in 2012 now drops out of the prediction (-1.45 and 1.21 test statistics). In short, getting off to a poor start sets a business up to be less successful in 2012, and not active in 2017.
Table 3. Predicting active companies five years later

Notes: Results are from a logit model predicting which 2012 companies are active in 2017 (third column in Table 1). Robust standard errors define z-score test statistics in parentheses. Chi-square fit statistic for the model is 83.90 with 24 d.f., P < 0.001 (pseudo R2 is 0.11).
Row variables describe the companies in 2012. Network constraint, the success dummy, and the poor start dummy are discussed in the text. Entertainment and travel is the percent of 2011 revenue spent on entertainment and travel costs. Founder is 1 if CEO respondent in 2012 also founded the company. R&D department is 1 if respondent said the company engaged in R&D activity (significant predictor of business success in Burt & Burzynska, Reference Burt and Burzynska2017). The size, industry, and city categories are sampling strata. Small companies are the reference category for company size differences. Shanghai is the reference category for city differences. Transportation equipment is the reference category for industry differences.
Again, excluding critical guanxi ties by limiting the network around a CEO to his or her currently valuable contacts obscures the network effect. If we replace network constraint in Table 3 with a constraint score computed from only current contacts, the direct survival association with network constraint disappears (-3.11 test statistic in first row of Table 3 drops to a negligible -0.19), and the indirect survival association for companies that began with a poor start disappears (2.23 test statistic in row five of Table 3 becomes a negligible -0.16).
DISCUSSION
On three points, our results predicting 2017 business survival from 2012 networks are reassuring corroboration of the earlier cross-sectional analyses by Burt, Burzynska, and Opper:
(1) Businesses run in 2012 by CEOs with a network rich in structural holes are more likely to be active five years later, in 2017 (Figure 1).
(2) Survival odds are improved if the large, open network around a CEO in 2012 was initially a supportive ‘cocoon’ closed network when the business was founded (Figure 2),
(3) Both results are contingent on capturing the guanxi ties valuable early in the history of the business. The two network effects disappear when the network around a CEO is limited to his or her currently valued contacts.
Beyond corroboration, we find that advantage is concentrated in ventures that began well and had become successful. In other words, network advantage seems not to compensate for weakness. It amplifies the success of businesses already doing well. The implication is that networks rich in structural holes might be modeled as a multiplier of asset value (as originally specified in structural hole theory, Burt, Reference Burt1992: 73), rather than an asset in its own right (as is usual practice, see Burt, Kilduff, & Tasselli, Reference Burt, Kilduff and Tasselli2013).
This casts network brokerage as a mechanism for cumulative advantage (see DiPrete & Eirich, Reference DiPrete and Eirich2006, for review). So viewed, success in the long run is a function of initial success amplified over time by network advantage at key points in time – even if initial success is no more than random (e.g., Salganik, Dodds, & Watts, Reference Salganik, Dodds and Watts2006). In the course of their review, DiPrete and Eirich (Reference DiPrete and Eirich2006: 281) offer a succinct summary of Merton's (Reference Merton1968) ‘Matthew Effect’ in science. Adapting their summary to the Chinese entrepreneurs here, cumulative advantage is to be expected among the entrepreneurs because: (1) resources are limited (always true, but our study period is a particularly challenging time in China), (2) the capability of an entrepreneur's business is difficult to observe directly, (3) customers and collaborators want capable suppliers or partners to ensure their own product quality and availability, and (4) visible success is an available indicator of capability. Therefore, whatever the reason for success, successful entrepreneurs are more attractive as suppliers or partners (or investments) because their success is rightly or wrongly a visible signal of capability, so we should see – as we do – survival returns to network advantage amplified for businesses previously successful (Table 2, Figure 1), and amplified for businesses that got off to a positive start, which contributed to previous success (Table 3, Figure 2).
And the five years we study were not just any five years. Network advantage persisted despite the vicissitudes of a national anti-corruption campaign during the five years. We held constant a company's 2011 percentage expenditure on entertainment and travel to be sure that our network results are robust to the national anti-corruption campaign. They are, but it is worth spending a final moment on the expenditures to highlight an empirical and conceptual point about network advantage. Conceptually, the point is that network advantage is not synonymous with corruption. Empirically, the point is that network advantage is independent of the corruption-related expenditures, and each has its own association with business survival through the study period.
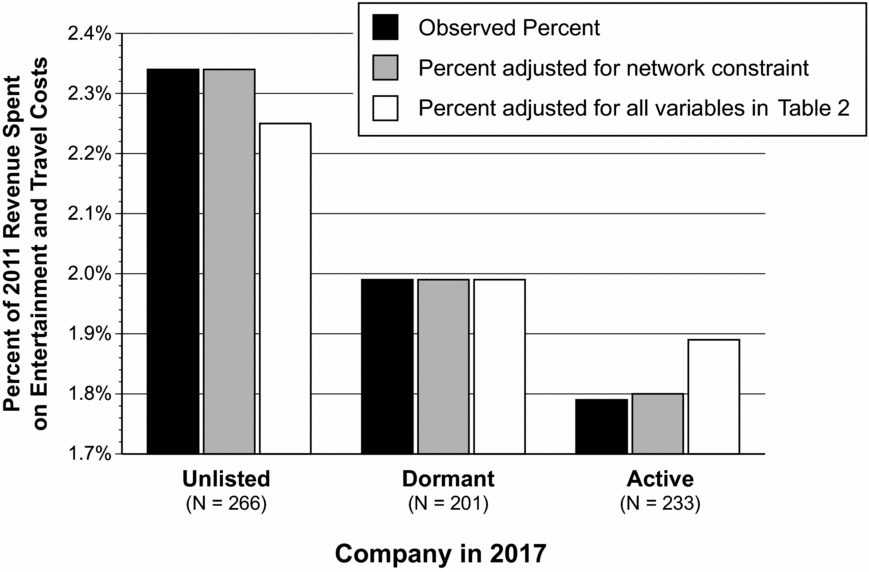
On the empirical point, the fourth line in Table 2 shows that expenditures in 2011 do not significantly increase the odds of the company being unlisted in 2017 (1.85 test statistic, P ~ 0.07), nor significantly decrease the odds of the company being still active in 2017 (-0.93 test statistic, P ~ 0.35). The association between survival and expenditures is clarified in Figure 3. The black bars show average percentage expenditures for each category of 2017 outcome. Companies that end up unlisted had the highest percentage expenditures on entertainment and travel. Companies that go dormant by 2017 spent less, and companies still active in 2017 spent the least of all. The white bars show expenditures adjusted for the predictors in Table 2 (regress the entertainment and travel measure across all the other predictors). The white bar for unlisted companies, and the white bar for active companies are closer (than the black bars) to the middle category of companies dormant in 2017. The high and low white bars are within two standard errors of the white bar for dormant companies, as indicated by the negligible test statistics in the fourth row of Table 2. However, there is a sizeable gap between the two extremes. If we treat the three 2017 outcome categories as an interval variable (1 unlisted, 2 dormant, 3 alive) predicted by the row variables in Table 2, entertainment and travel expenditures have a strong negative association with company survival in 2017 (-2.88 t-test, P < 0.01).

Figure 3. Entertainment and travel costs by company survival
Empirically, the network association with survival is in two ways distinct from the expenditures association. First, the network effect is concentrated in a contrast between companies still active versus anything less, with companies active in 2017 more likely to be run by CEOs who in 2012 had large, open networks (-2.99 test statistic for network constraint in first row of Table 2). The expenditures effect is distinct in being across all three outcome categories, as just stated, with a concentration in companies that end up unlisted (1.85 versus -.93 test statistics in fourth row of Table 2). Companies spending a large percentage of their revenue on entertainment and travel in 2012 are most at risk of running afoul of the anti-corruption campaign, becoming unlisted in 2017. In short, the two associations are concentrated at opposite ends of the three-category survival continuum: networks distinguish companies still active in 2017 while expenditures distinguish companies likely to die (become unlisted) by 2017.
Additionally, the network prediction is independent of expenditures. The gray bars in Figure 2 show expenditures adjusted for network constraint (the direct effect of network constraint and the indirect effect in interaction with the “less successful” dummy variable). The gray bars are almost identical to the adjacent dark bars, reflecting the fact that the CEOs with large, open networks were in 2012 no more or less likely to engage in entertaining and travel than were the CEOs with small, closed networks (.04 correlation between network constraint and percentage entertainment and travel costs, 1.04 t-test, P ~ 0.30).
Given the empirical point, the conceptual point follows quickly: network advantage is not synonymous with corruption. This is a point worth highlighting because the term guanxi is often used colloquially to refer to corruption – people using friends and relatives to secure undeserved contracts, jobs, and promotions. No doubt the colloquial meaning is sometimes true, just as people sometimes enter marriage for economic or other selfish gain. That does not mean that all marriages are for economic or other selfish gain. Strong personal connections represent a capability for action. How they are used is a related, but separate question. More specifically, networks that span structural holes – as measured by network constraint – create information advantages of breadth, timing, and arbitrage that enhance a person's capability for detecting and developing lucrative opportunities. The phenomenon is further enhanced when the network contains guanxi ties, creating advantage within a community of mutual concern. For the Chinese entrepreneurs studied here, as for managers in the West, network constraint measures advantage that can be used for selfish advantage, but empirical research shows that the measured advantage is systematically associated with creativity, innovation, and delivering value (reviewed in the Burt, Burzynska, & Opper papers). While network advantage is a capability, excessive expenditure on entertainment and travel is a behavior. The former is empirically associated with companies emerging active through China's national anti-corruption campaign. The latter is empirically associated with companies that expire during the campaign. Recall too that there is no correlation between network advantage and the suspect percentage expenditures on entertainment and travel. At high and low levels of network advantage, some CEOs spend little on such costs and others spend heavily. Luo (Reference Luo2008) wisely points out that people desperate for an outcome – a job, a promotion, a big contract, a land grant, etc. – are likely to use their capability in whatever manner is needed to secure the desired outcome, which can overlay corruption on network advantage. Regardless, capability is not behavior, as physical strength is not synonymous with violence, nor wealth synonymous with happy. There is wisdom in maintaining network advantage and corruption as separate, if occasionally overlapping, concepts.