INTRODUCTION
Recent empirical work has focused on the nonlinear characteristics of economic and financial time series. Although much evidence has been found for the presence of nonlinearities in financial data, this has not always been the case for macroeconomic data. As Barnett and Seletis (2000) observe in a review paper, the analysis of macroeconomic time series has not led to particularly encouraging results, mainly due to small samples and high noise levels in the aggregate data. Nevertheless, nonlinearity is a well-documented feature of the U.S. unemployment rate. Time series models, such as Markov switching, threshold autoregression (TAR), and smooth transition autoregression have been considered for describing and forecasting the nonlinearity of unemployment [see Koop and Potter (1999) and van Dijk et al. (2002)]. Recently, nonlinearity has become a crucial issue in the analysis of (un)employment fluctuations, because intersectoral (and intrasectoral) reallocations would bring about (un)employment cycles through nonlinear, asymmetric shocks [for a survey cf. Gallipoli and Pelloni (2001)]. However, some researchers have overlooked this key feature of the labor market and continued to focus their attention on linear representations. For instance, in a multivariate setting Campbell and Kuttner (1996) introduced a structural VAR model for aggregate employment and employment sectoral shares for the United States. They disregarded the potential nonlinearity underlining the process of job reallocation and treated aggregate and sectoral shocks symmetrically. Pelloni and Polasek (1999, 2003) and Panagiotidis et al. (2003) have stressed how this overlooking of the nonlinear structure of sectoral shocks could distort analysis and throw into doubt the reliability of empirical results. To correct this analytical shortcoming, they suggest a specific analytic structure. They propose a VAR-GARCH-M model as a potential framework, which could accommodate the intrinsic nonlinearity of employment reallocations. None of the aforementioned studies developed detailed exploratory tests for the potential nonlinearity of the univariate series. Similarly, before carrying out their specific experiments at a multivariate level, these studies do not test for nonlinearity in general terms. They either exclude nonlinearity or directly develop an a priori chosen form of nonlinearity.1
Pelloni and Polasek (1999, 2003) use the Bayes factor for model selection. However, their testing is limited to a specific range of models compatible with a standard linear VAR.
It is the purpose of this paper to fill this vacuum. Because the presence of nonlinearity would put a priori constraints on testable theories, we deem it essential that researchers know whether certain macroeconomic series contain a linear or a nonlinear structure. There are good reasons that nonlinearities should be investigated. If the presence of nonlinearities is empirically supported, then researchers should try to incorporate them into theoretical models and empirical analyses. If researchers do not take them into account, (i) estimates will violate certain assumptions, (ii) important dependencies will be left out of the linear model, and (iii) forecasts will behave poorly. We will focus on Canadian and U.S. labor market time series that are relevant to the analysis of the macroeconomic effects of aggregate shocks vis-à-vis those of sectoral shocks. Of course, we do not expect to exhaust the testing potentialities of those markets, but simply hope to provide a set of standard tests that can help future work.
If linearity were to emerge as a characterizing feature of the unemployment and employment sectoral shares series, we could safely reject reallocation shocks as a triggering force and avoid further expensive explorations of the data. Thus the linearity or nonlinearity of unemployment is crucial for discriminating among hypotheses. For, instance, as pointed out above, it is still an unsolved macroeconomic puzzle whether unemployment fluctuations reflect aggregate or reallocation disturbances. The solution of this puzzle is probably connected with linearity or nonlinearity of the aggregate unemployment process and of the relevant sectoral variables [e.g., see Davis and Haltiwanger (1999) and Pelloni and Polasek (1999, 2003)].
The outline of the paper is as follows. In Section 2, we provide some background information. The methodological issues are discussed in Section 3, where the various tests are briefly described, along with the prewhitening model. The data employed are presented in Section 4. The results of the prewhitening model and of the univariate nonlinearity tests for the Canadian and U.S. labor markets are discussed in Section 5. Section 6 presents the outcomes of the multivariate case and Section 7 concludes.
BACKGROUND
A priori testing for nonlinearity has normally been limited to the unemployment rate, with no attention given to disaggregate labor market variables. Brock and Sayers (1988) and Frank and Stengos (1988) follow similar approaches and use an autoregressive (AR) model and the BDS test statistic [Brock et al. (1996), BDS hereafter] to test the linearity assumption for the unemployment rate in the United States and Canada, respectively. Whereas Brock and Sayers (1988) find strong evidence for nonlinearity in the U.S. case, Frank and Stengos (1988) fail to reject the linearity assumption for the Canadian time series. Furthermore, Frank et al. (1993) examine Canadian provincial unemployment data for evidence of significant nonlinear structure. They follow the work by Nickell (1990) on unemployment persistence, which suggests that the reduced form unemployment equations can be modeled by linear autoregression. Their findings do not bear out the presence of an important nonlinear structure.They conclude that the suggestion that aggregation was responsible for the series's “linearity” does not appear to be supported by the data. Recently, Panagiotidis and Pelloni (2003), using a battery of tests, found evidence in favor of nonlinearity in the German growth rates of employment sectoral shares but could not corroborate nonlinearity in the U.K. case.
In this paper we extend the work of Brock and Sayers (1988), Frank and Stengos (1988), Frank et al. (1993), and Panagiotidis and Pelloni (2003) in several dimensions. The first three of these articles only employ the BDS test statistic, whereas we introduce a much larger battery of tests. Our testing analysis is not just aimed at measures of aggregate or regional unemployment, but also considers measures of sectoral employment. We are unaware of a similar exercise for U.S. and Canadian employment sectoral shares. Additionally, differently from all the above papers, we extend our analysis to the multivariate case.
Thus, the purpose of this paper is to use five statistical tests for nonlinearity to examine the linearity assumption for unemployment rates and the growth rates of U.S. and Canadian aggregate employment and sectoral shares. We wish to encompass the works of Brock and Sayers (1988) for the United States and of Frank and Stengos (1988) and Frank et al. (1993) for Canada within a unique common framework while simultaneously expanding the testing procedure. Our aims are (i) to expand the univariate methodology employed by both Brock and Sayers (1988) and Frank and Stengos (1988) by introducing a larger array of tests; (ii) to apply this methodology to both Canadian and U.S. data sets in order to bring the evidence about these two countries under a common methodological umbrella; (iii) to broaden the focus of the analysis by investigating, alongside aggregate (un)employment data, the series of employment sectoral shares; and (iv) to introduce nonlinear testing into the multivariate setting for the sets of variables under analysis.
The outcomes of our analysis can provide useful knowledge for further study of cyclical fluctuations. For instance, the presence of nonlinear dynamics (in the examined time series) is crucial for the separation of the macroeconomic effects of aggregate disturbances from those of sectoral shocks.
Our work can also show whether there are sectors characterized by relatively more complex behavior and, thus, whether asymmetries are more important for some sectors than others. Finally, by addressing the issue of transition from a univariate to a multivariate nonlinear testing methodology, we wish to stress the mutual informational content of these two settings.
METHODOLOGY
Given the nature of this paper, we will avoid directly imposing a specific nonlinear data-generating process. This choice is dictated by three different reasons: the number of nonlinear data generators is infinite and, as a result, it is extremely difficult and dangerous to impose an a priori structure; given our methodology, we do not have to make any heroic assumptions; and, most importantly, we do need to reject linearity before we proceed with imposing a nonlinear structure of some form. As Potter (1999) points out: “Successful nonlinear time series modelling would improve forecasts and produce a richer notion of business cycle dynamics than linear time series models allow. For this to happen two conditions are necessary. First, economic time series must contain nonlinearities. Second, we need reliable statistical methods to summarize and understand these nonlinearities suitable for time series of the typical macroeconomic length.”
Many statistical tests for nonlinear dependence have been proposed in the recent literature. We make use of five different tests for detecting nonlinear serial dependence. This strategy permits us both to obtain a deeper insight into the properties of the time series and to minimize the probability of drawing the wrong conclusion. If our battery of tests display a consensus in favor of a specific result, we could interpret this consensus as corroboration of that outcome.
The five tests that we use are from McLeod and Li (1983), Engle (1982), Brock et al. (1996) (BDS), Tsay (1986), and Hinich and Patterson (1995) and Hinich (1996) (bicovariance test). All these tests share the same principle: once any linear serial dependence is removed from the data, any remaining serial dependence must be due to nonlinearities in the data-generating mechanism. Other well-known nonlinearity tests, including the bispectrum-based tests [Hinich (1982), Hinich and Rothman 1998)], are not included because they do not employ the same prewhitening methodology [for more discussion on nonlinearity tests see Barnett et al. (1997)].
The linear serial dependence is removed from the data through a prewhitening model as follows: we fit an AR(p) model2
See also Brock and Sayers (1988), Frank and Stengos (1988), Frank et al. (1993), Patterson and Ashley (2000), and Panagiotidis and Pelloni (2003).
See the Breusch–Godfrey results in Table 3.
All the procedures operate under the null hypothesis that the whitened series under consideration is IID. The McLeod and Li test is for ARCH effects; it looks at the autocorrelation function of the squares of the prewhitened data and tests whether corr (et2, et−k2) is nonzero for some k. The test suggested by Engle (1982) is an LM test, which should have power against GARCH alternatives. The BDS test is a nonparametric test for serial independence based on the correlation integral of the scalar series {et} [for more on the BDS test see Brock et al. (1991)]. The Tsay (1986) test looks explicitly for quadratic serial dependence in the data and has proven to be powerful against a TAR (threshold autoregressive) process. The bicovariance test assumes that {et} is a realization of a third-order stationary stochastic process and tests for serial independence using the sample bicovariances of the data. It can be considered a generalization of the Box–Pierce portmanteau statistic.4
Rejections secured by the bicovariance statistic could call into question results indicating ARCH/GARCH structure because the bicovariance test might be detecting significant nonzero bicovariances that should not be present if the process were a martingale difference process, which underpins ARCH/GARCH models. Finally, one further option for testing for the presence of ARCH/GARCH using the Hinich bicovariance (and covariance) test is to use the testing procedure outlined in Brooks and Hinich (1998) and Brooks et al. (2000). We are grateful to an anonymous referee for pointing this out to us.
The reader is referred to the Appendix and to the detailed discussion of these tests by Barnett et al. (1997) and Patterson and Ashley (2000). Both these papers, in line with the results of other studies [e.g., Brock et al. (1991)], reckon the BDS to be the most powerful of the tests for a nonspecified form of nonlinearity as an alternative. The other tests could detect specific forms of nonlinearity; MacLeod and Li and Engle test the presence of volatility clustering and Tsay tests for threshold effects. The combination of the BDS and the other tests would allow us to draw more precise conclusions on the presence and nature of nonlinearity in the series. Thus, for example, if the BDS and Engle tests reject linearity whereas the others do not, we could not bear out the presence of GARCH effects.
DATA
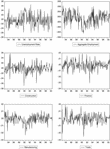
The data employed in this exercise are the U.S. and Canadian unemployment rates, the aggregate employment, and the employment sectoral shares published by the Bureau of Labor Statistics (http://www.bls.gov) and Statistics Canada (http://www.statcan.ca). These are seasonally adjusted monthly observations from 1983:01 to 2000:12 and the sectors under consideration are construction, finance, manufacturing, and trade (Figures 1 and 2). For the United States the following series were obtained: EES 00000001 Aggregate Employment, EES 20000001 Construction, EES 30000001 Manufacturing, EES 60000001 Retail Trade + EES 51000001 Wholesale Trade, EES 70000001 Finance, Insurance, and Real Estate, and LNS14000000 Un Rate, and for Canada D980745 Un Rate, D980595 Aggregate Employment, L95660 Manufacturing, L95661 Construction, L95664 Trade, and L95665 Finance, Insurance and Real Estate.

U.S. unemployment rate and sectoral shares growth rates.

Canadian unemployment rate and sectoral shares growth rates.
We follow Wallis (1987) and employ the logistic transformation for the unemployment rates [this transformation has to be preferred to the logarithmic one; for a discussion and applications see Wallis (1987)]:

We use the growth rate of the logistic transformation as a unit root.
The growth of the sectoral shares is defined as

where uti is the share of sector i at time t.
Table 1 presents the summary statistics of the series and Table 2 the unit root tests (ADF, PP, and Breitung's nonparametric unit root test).


EMPIRICAL RESULTS
As a first step we estimate the prewhitening model. The order of the AR process is chosen to minimize the SC (Table 3). The results vary from an AR(0) (regression on a constant) to a maximum AR(6) for U.S. construction. An AR(1) was the preferred specification for the U.S. unemployment rate [as opposed to an AR(2) in Brock and Sayers (1988)] and an AR(0) for the Canadian one [as opposed to the AR(2) in Frank and Stengos (1988)].

Our next step is to use the residuals of the AR(p) regression to compute the five test statistics for nonlinearity. The results are summarized in Table 4 and presented in Tables 5 and 6. Under “asymptotic theory,” the values are those based on the large sample distributions of the relevant test statistics. For the “bootstrap” results, 1,000 new samples were independently drawn from the empirical distribution of the prewhitened data. Each new sample is used to calculate a value for the test statistic under the null hypothesis of serial independence. The fraction of the 1,000 test statistics that exceed the sample value of the test statistic from the original data is then reported as the significance level at which the null hypothesis can be rejected. The outcomes from both approaches are reported for a given sample size [for a discussion on the sample size, the asymptotic theory, and the bootstrap, see Patterson and Ashley (2000)].


Most of the tests provide evidence against the hypothesis that the U.S. unemployment rate is characterized by nonlinearities. This suggests that the naïve AR(1) specification is capable of capturing the dynamics of the series. On the other hand, the Tsay tests question the above conclusion at the 10% significance level. However, there is evidence across the spectrum of tests that nonlinear dynamics are present in the case of aggregate employment. This result is further endorsed by the outcome of the sectoral shares, where a strong rejection of the linearity hypothesis emerges across the battery of tests. Construction is a noticeable exception, in the sense that linearity is rejected but ARCH (see the McLeod–Li test) and TAR (see the Tsay test) effects could be excluded from the infinite set of nonlinear specifications.
The results for Canada display a different picture. First, there is a consensus in favor of nonlinearity for the unemployment rate. In the case of aggregate employment an interesting result emerges: all tests support the linearity hypothesis except the Tsay test. As a result we could argue that the data-generating process might be captured by a TAR process. GARCH effects seem to drive the finance sector, because only the McLeod–Li and Engle tests reject the linearity hypothesis. For the remaining sectors, evidence against linearity is given by the BDS test statistic. Although we cannot argue in favor of a specific nonlinear alternative, we could exclude GARCH and TAR type of structures in the case of manufacturing. The latter can be explained by the power of some tests against specific nonlinear structures (the Engle and McLeod–Li tests against (G)ARCH processes and the Tsay test against TAR processes), whereas the BDS is defined against unspecified alternative nonlinear structures.
MULTIVARIATE ANALYSIS
In this section, we examine how the evidence on asymmetries of the previous part is affected by extending the analysis to a multivariate model. To explore this issue, we estimate a bivariate unrestricted VAR model, similar to the one presented in Campbell and Kuttner (1996). The latter does not use a dispersion proxy as a summary measure of reallocation, but models the relationship between aggregate and sectoral employment explicitly using dynamic time series models. We choose this multivariate structure because of its importance and popularity in the recent sectoral shifts literature. Though our testing is not aimed at corroborating sectoral shifts, it is of great consequence for empirical analyses of the macroeconomic impact of job reallocations. In fact, such a testing procedure may inform us about the admissibility of certain models.
Our benchmark model is a two-dimensional VAR of the Campbell and Kuttner (1996) type,

where
, y1t is the growth rate of total employment, and y3t is the growth rate of the manufacturing employment share. Furthermore, we investigate the behavior of a different specification where aggregate employment is replaced by the unemployment rate,
, where y2t is the growth rate of the unemployment rate and the ut's are the corresponding residuals. The obtained results for the United States are


whereas for Canada we obtain


Significance at the 1%, 5%, and 10% levels is denoted by ***, **, and *, respectively.
The corresponding residuals, u1t, from the total employment equation, u2t, from the unemployment rate equation, and u3t, from the manufacturing equation, were used to calculate the battery of tests (see Tables 7 and 8 and summary of the results in Table 9).


For the United States, evidence emerges in favor of linearity only for u2t (the residuals from the unemployment rate equation). In all other series there is strong evidence against linearity. This result may have interesting implications for sectoral shifts analysis. First, the results of equation (1a) suggest that, besides theoretical considerations, the linear specification chosen by Campbell and Kuttner (1996) for the United States has to be rejected. Second, we can neither support nor rule out the presence of GARCH effects in equation (1a), thus leaving open the issue of volatility clustering for sectoral shocks (conflicting results from the McLeod–Li and Engle tests). Third, the residuals in (1a) and (1b) are not shocks, but mixtures of shocks. Thus in (1a) either the nonlinear shocks dominate or all the shocks are linear, whereas in (1b) clearly we have a mixture of linear and nonlinear shocks. In the latter case, linearity is accepted for the aggregate employment residuals, whereas it is rejected for the sectoral component. Although, given the character of our analysis, it would be improper to draw further inferences, we could argue, ex ante, that the theoretical nonlinear nature of idiosyncratic shocks is compatible with the data. Thus, nonlinearity seems to be an exploitable feature for building models aimed at discriminating between the macroeconomic effects of aggregate and sectoral shocks.
For Canada, linearity is supported for u1t [equation (2a)] throughout by our five-test procedure (see Tables 7 and 8). This support was not corroborated in the case of u3t, as all the tests, except the BDS, accept linearity [equation (2a)]. Although linearity seems to be the rule, not the exception, the BDS casts doubts on whether a Campbell and Kuttner (1996) type of linear VAR could be employed in the case of Canada. Furthermore, the rejection of linearity is even stronger when aggregate employment is substituted for aggregate unemployment. The residuals of the unemployment series are clearly nonlinear (maybe threshold?) though not driven by a GARCH processes (McLeod–Li and Engle accept linearity for u2t but Tsay and BDS reject it). Overall, though, the evidence seems not to be as strong as for the United States.
CONCLUSIONS
The purpose of our work was to investigate the presence of nonlinear serial dependence in the U.S. and the Canadian labor markets. A robust methodology was employed to investigate the existence of asymmetries in aggregate and disaggregate labor market variables in the United States and Canada. Asymmetries were examined both in a univariate and a multivariate setting. Five tests for nonlinearity were employed and the statistics were estimated using both the asymptotic theory and the bootstrap. We have shown that important asymmetries exist in the sectoral labor market variables. For the U.S. univariate series, our evidence bears out linearity for aggregate unemployment, although suggesting nonlinearity for aggregate employment. At sectoral level the tests strongly reject the hypothesis of linearity. Thus the nonlinear characteristics of U.S. unemployment [Brock and Sayers (1988)] are not confirmed by our study, but important nonlinearities are uncovered at the sectoral level.
The conclusion for Canada is almost the reverse: evidence against linearity for unemployment coexists with almost unanimous evidence (with the exception of the Tsay test) in support of linearity for aggregate employment. At the sectoral level, GARCH and TAR type of effects were not detected in manufacturing, but the BDS test statistic rejected the linearity assumption in all cases. These mixed results are not in line with either Frank and Stengos (1988) or Frank et al. (1993), which failed to detect significant nonlinear structure in the Canadian labor market.
Finally, we considered the multivariate case, where specifications (dynamic time series models) already used in the sectoral shifts literature were employed to examine the power of linear structures. Evidence of significant nonlinearities rules out the use of linear VAR models for both countries and endorses the potential importance of asymmetries in testing the impact of employment reallocations.
Additionally, Clements and Krolzig (1998) show that AR models have a forecasting performance competitive with nonlinear (Markov switching and threshold autoregressive) time series. As a result, the estimated AR models can be used for forecasting. Structural breaks and outliers might be responsible for these results [see Koop and Potter (2000)], although the results of this exercise are not altered when some values (max and min) are omitted. The evidence for nonlinearity seems to suggest that asymmetric behavior is present at a disaggregate level and a fundamental asymmetry exists between the expansion and contraction phases of the sectoral shares.
APPENDIX
BDS TEST FOR RANDOMNESS
A powerful test used for independence (and, under certain circumstances, for nonlinear dependencies) was developed by Brock et al. (1996) and is based on the correlation integral. The BDS statistic tests the null hypothesis that the elements of a time series are independently and identically distributed (IID). For a time series that is IID, the distribution of the statistic

is asymptotically N(0, 1). Wm(e) is known as the BDS statistic. Cm(e) denotes the fraction of m-tuples in the series that are within a distance e of each other and σm(ε) is an estimate of the standard deviation under the null hypothesis of IID. The test statistic is asymptotically standard normal under the null of whiteness. The null is rejected if the test statistic is absolutely large (say, greater than 1.96). If the null hypothesis of IID cannot be accepted, this implies that the residuals contain some kind of hidden structure, which might be nonlinear (or even chaotic).
MCLEOD AND LI TEST
The McLeod–Li test [McLeod and Li (1983)] can be used as a portmanteau test of nonlinearity. To test for nonlinear effects in time series data, McLeod and Li proposed the statistic

where

are the autocorrelations of the squared residuals, et2, obtained from fitting a model to the data. If the series et is IID, then the asymptotic distribution of Q(m) is χ2, with m degrees of freedom.
ENGLE LM TEST
This test was suggested by Engle (1982) to detect ARCH disturbances. Bollerslev (1986) suggests that it should also have power against GARCH alternatives. Because it is a Lagrange multiplier test, the test statistic itself is based on the R2 of an auxiliary regression, which in this case can be defined as

Under the null hypothesis of a linear generating mechanism for et, NR2 for this regression is asymptotically χ2(p).
HINICH BICOVARIANCE TEST
This test assumes that {et} is a realization from a third-order stationary stochastic process and tests for serial independence using the sample bicovariances of the data. The (r, s) sample bicovariance is defined as

The sample bicovariances are thus a generalization of a skewness parameter. The C3(r, s) are all zero for zero-mean, serially IID data. One would expect nonzero values for the C3(r, s) from data in which et depends on lagged cross products, such as et−iet−j and higher-order terms.
Let G(r, s) = (N−s)1/2C3(r, s) and define X3 as

Under the null hypothesis that {et} is a serially IID process, Hinich and Patterson (1995) show that X3 is asymptotically distributed, χ2(l[l−1]/2), for l<N1/2.
Based on their simulations, they recommend using l=N4. Under the assumption that E(xt12) exists, the X3 statistic detects nonzero third-order correlations. It can be considered a generalization of the Box–Pierce portmanteau statistic.
TSAY TEST
The Tsay (1986) test is a generalization of the Keenan (1985) test. It explicitly looks for quadratic serial dependence in the data.
Let K=k(k−1)/2 column vectors V1, …, Vk, contain all of the possible cross products of the form et−iet−j, where i∈[1, k] and j∈[i, k]. Thus, vt,1 = et−12,
. And let
denote the projection of vt,i onto the orthogonal subspace et−1, …, et−k, (i.e., the residuals from a regression of vt,j on et−1, …, et−k).
The parameters γ1, …, γk are then estimated by applying OLS to the regression equation

Note that the jth regressor in this equation is
, the period t fitting error from a regression of vt,j on et−1, …, et−k. For p exceeding K, this projection is unnecessary for the dependent variable {et} if it is prewhitened using an AR(p) model. The Tsay test statistic then is just the usual F statistic for testing the null hypothesis that γ1, …, γk are all zero.
We would like to thank David Belsley, Jurgen Doornik, Giovanni Gallipoli, Paolo Giordani, Terrence C. Mills, Renzo Orsi, Eric Pentecost, Thanasis Stengos, two anonymous referees, and the participants of the 38th Annual Meeting of the Canadian Economics Association, June 4–6, 2004, Toronto, Canada, and the 8th Conference of the Society for Computational Economics, June 27–29, 2002, Aix-en-Provence, France, for their useful comments. Special thanks go to Tom Barbiero and Leo Michelis, who read the last draft and provided helpful suggestions. TP gratefully acknowledges financial help from the British Academy. GP gratefully acknowledges a Faculty Research Grant from the International Council for Canadian Studies.