Published online by Cambridge University Press: 06 April 2004
In this paper, I study the effect that switching to a voucher system of educational finance has on the distribution of income. The model is calibrated to U.S. data, and simulated for two different forms of education finance: a voucher system and a completely private system of schools. All voucher policies considered result in welfare gains and reductions in income inequality. A private system entails a welfare loss and an increase in income inequality. The more important the peer group is to future income, the smaller the welfare gains and reductions in inequality associated with voucher systems, and the greater the welfare cost and increase in inequality associated with a private system.
The U.S. federal government, along with several cities and states, has considered sweeping education reforms. One such reform is a voucher system, which gives money to qualifying parents to defray the costs of private school tuition or to send their children to other public schools. Both the cities of Milwaukee and Cleveland have started educational voucher programs. The Milwaukee program consisted of 341 students attending seven schools during the 1990–1991 school year and has grown to 10,882 students attending 106 schools during the 2001–2002 school year. The Cleveland program, which began in 1994, served 4,457 students during the 2001–2002 school year.1
Information on the Milwaukee Parental Choice Program and the Cleveland Scholarship and Tutoring Program was taken from the Black Alliance for Educational Options and the Marquette University Institute for the Transformation of Learning Web site http://www.schoolchoiceinfo.org/.
In this paper, I use a dynamic general equilibrium model to predict the welfare and distributional effects of a switch from a public system benchmark to a public system with various voucher policies. To understand the link between education policy and the income distribution, imagine that a voucher system is implemented. As a result, some students may choose to leave the public school. This will affect the peer group in the public school and the private schools that these students choose to attend. By peer group, I mean a student's classmates. Since income depends in part on the peer group, policy changes can affect the distribution of income through the peer group channel as well as the more traditional educational spending channel. I begin with a public school system that allows parents to opt out and send their children to private schools, paying tuition on top of the taxes that support the public school. I then consider the effects that a switch to a full voucher system where all parents are eligible for the voucher, a targeted voucher system where eligibility is income based, and a completely private system would have on income distribution and welfare.
To do this I need to first answer the following three questions: What is a school? What do schools produce? And, how do schools produce it? Here, a school is defined by its expenditure level and its peer group. Schools take these inputs and produce next period's income distribution. This means that, along with educational expenditures, a student's classmates, or peer group, play a role in determining his future income. To answer the third question, how these inputs affect future income, I turn to the empirical literature on estimating education production functions. This is discussed in the model and calibration sections.
The model is based on the premise that a child's peer group matters to his future income. Given this assumption, it then predicts how students will sort across schools and what the educational spending will be at those schools. There is empirical evidence that the peer group is important to educational outcomes, beginning with the Coleman Report, Equality of Educational Opportunity [Coleman et al. (1966)]. The authors find that a student's educational achievement is positively related to the educational background and aspirations of his classmates. Summers and Wolfe (1977) come to a similar conclusion using classroom-level data. Using Canadian data, Henderson et al. (1978) also find evidence that the peer effect exists. More recently, Black (1999) has found that parents are willing to pay a significant amount more for a house across the street from another, if residing in that house implies attending a school with higher average test scores. Since these identical houses are in the same school district, educational expenditures are constant. Therefore, most of the effect she finds is attributable to unobservable parental characteristics and the peer group. Not all studies conclude that peer effects are important. Hanushek (1986), in a large review of the education literature, claims that the findings on peer effects are ambiguous, due to the difficulty of separating peer effects from unobservable family background characteristics.
Whether, and how much, educational expenditures matter to future income has sparked many debates. Several studies, including Card and Krueger (1992, 1996), Grogger (1996), and Altonji and Dunn (1996), find a positive and significant relationship between expenditures and future income. However, Hanushek (1986, p. 1162) claims that “there appears to be no strong or systematic relationship between school expenditures and student performance.” He concludes that some districts appear to spend resources effectively, whereas others do not. I abstract from the issues surrounding how and if schools allocate resources effectively, and assume that schools are using their resources in an efficient way.
The model used here is based on Caucutt (2001). In an application of that static model, Caucutt (2002), all voucher policies studied lead to greater income inequality, while only some are welfare improving. Several other papers include peer effects, beginning with de Bartolome (1990) who constructs a two-community, two-type model of public education when there are peer effects. Epple and Romano (1998a) develop a model with students differing continuously over ability and income, to look at the welfare effects of implementing a voucher system. Epple and Romano (1998b) investigate the consequences of several different kinds of voucher systems, other than just the typical flat-rate system, on the stratification of students across schools. Nechyba (2000) considers a three-community model with public and private schools, migration, voting over expenditure level, and peer effects.
The paper is organized in the following way. I first lay out the model and discuss computational issues. Next, I calibrate the public system version of the model to U.S. data. I then compare the income distribution and welfare of the public-system steady state with those of a voucher-system steady state, a targeted-voucher-system steady state, and a private-system steady state. Lastly, I conclude.
The framework consists of a sequence of static problems. The static problem used here is based on Caucutt (2001). Each period, there is a continuum of families made up of a parent and a child. The parents differ across income and ability. A parent's utility depends on her consumption and her child's expected income. The key feature of this model is that the expected income of the child depends on his ability, his parent's income, his school's per-student expenditures, and his school's peer group. The schooling choices that the parents make give rise to a distribution of parents in the next generation. Consequently, each period, given the distribution from the previous period, a new distribution is generated. Because the parent cares only about her child's expected income, and not the utility he gains from that income, the only link between periods is this distribution across types.
There are 10 types of parents, who differ over five income levels, poor, lower middle class, middle class, upper middle class, and rich, hp<hlm<hm<hum<hr; and two ability levels, low and high, al<ah. There is a continuum of each type i parent, i=1, …, 10, where type 1 is poor and low ability, type 2 is poor and high ability, type 3 is lower middle class and low ability, etc. There is measure λi>0 of each type i, and [sum ]iλi=1. A parent has one child who inherits his parent's ability, and this information is public.
First, I outline the static problem, and define an equilibrium for the static problem. I then define a steady-state equilibrium for the dynamic framework. In the next section, I describe how a system of educational vouchers can be implemented.
There is a finite set, S, of private-school types. A school type, s∈S, is defined by the fraction of each student type attending, nis, i=1, …, 10, and its per-student expenditures, es. A school, s, is normalized to a size of one student, and the number of those schools, zs, is allowed to vary. So, whereas the set of possible school types, S, is exogenous, the measure of each school in S, zs ∀s, is endogenous. The idea is to choose the set S large enough to be a good approximation of a continuum.
In equilibrium, given tuition for each student type pis, per-student expenditure es, and enrollments nis, all schools operating will have zero profits,

If the school were earning negative profits, it would shut down, and if it were earning positive profits, it would be of infinite size, which is not consistent with an equilibrium. Because these are private schools, a school can charge different students different tuition.
The school's expenditure level and student body composition are combined with the student's ability and his parent's income level to produce a lognormal distribution of future income for that child at that school. The mean of the distribution depends, in a Mincer-like fashion, on the ability of the child, the income of the parent, and the type of the school,

where
, 0≤α, δ, γ, ψ≤1, and the variance is constant, σ2. The peer group here is measured by the average ability at the school. The parameters α, δ, γ, and ψ are the elasticity of mean income with respect to ability, parental income, the peer group, and educational expenditures, respectively. Mean income for a type-i student attending school s, is exp(μis). For each input, mean income increases at a decreasing rate. It is important to realize that these distributions are exogenous, depending only on n, a, e, and h. To map these continuous distributions into the five income types, I follow Fernandez and Rogerson (1998). They attach a continuous distribution of income to each type of school, and then discretize the support of the distribution and use the continuous distribution to back out the probability that the student will be one of each of the prespecified, finite types. Here, each lognormal distribution is numerically integrated over intervals containing each of the five income levels. A set of transition probabilities corresponding to the 10 parent types, qijs, ∀i, j, s, where qijs is the probability that a type-i student, attending a type-s school, becomes a type-j parent, is then constructed.
The lone public school is financed entirely through tax revenues and charges no tuition. Although political economy does play an important role in educational finance, as a first step I abstract from this issue by assuming a constant tax rate. Because total resources are fixed in the static problem, there is a fixed amount of tax revenues each period that are earmarked for the public school. These revenues are split evenly among those who attend the public school. The fewer the number of students in the public school, the higher its per-student expenditures. A polar assumption would be to assume that the expenditure level in the public school is fixed and the tax rate adjusts to balance the budget.
The public school has per-student expenditures of epub and an average ability of
. Because I assume that the peer group is defined by the average ability at the school, it is not necessary to know the fractions of each type who attend the public school. A child of a type-i parent who attends the public school has probability qijpub of becoming a type-j parent. These probabilities are constructed in the same manner as the private-school probabilities. In other words, the private schools do not have a technological advantage over the public school.
The public school can be thought of as taking the residual students; it is required to accept any student who wants to attend. Obviously, who chooses to attend the public school depends on the transition probabilities it offers, qijpub, which depend on the expenditure level, epub, and the peer group,
, which in turn depend on who attends the public school. Consequently, the qijpub are endogenously determined by two additional constraints. The public school's budget must balance:

where [sum ]szs is the measure of students attending private schools, and the
used to determine qijpub must be given by

where nipub is the fraction of type-i students in the public school.
Each school offers each student a set of transition probabilities that correspond to becoming each of the 10 parent types. Keep in mind that a low-ability child cannot become a high-ability parent, and vice versa. Therefore, 5 of the 10 probabilities will be zero. Because the choice to attend a specific school is exclusionary, in the sense that attending one school precludes a student from attending another, a lottery is introduced to convexify the problem facing each parent. A parent maximizes expected utility by choosing the probability that her child attends each private school type. If the student attends a private school, the parent pays tuition to that school on top of the taxes paid to the public school system. Cole and Prescott (1997) demonstrate the equivalence of a lottery equilibrium in this environment and a gambling equilibrium. Their gambling economy consists of two stages. In the first stage, a parent makes a fair gamble over wealth transfers, and in the second stage, conditional on her realized wealth level, the parent chooses her consumption and the single school her child will attend. The lottery assumption, in this framework, allows parents to engage in implicit wealth gambles.
In this environment, a commodity vector at each point in time is made up of consumption and a set of 10 vectors. For a type-i parent, the ith vector's components correspond to the probability that her child attends each of the possible private schools; all other vectors, j≠i, will be made up of zeros. Each parent has a set of 10 vectors in her commodity vector, even though 9 of the 10 will contain all zeros. This is because the probability that a type-i parent sends her child to a school is a different commodity, and will therefore be priced differently, than the probability that a type-j parent sends her child to the same school, i≠j.
The problem of a type-i parent is given by
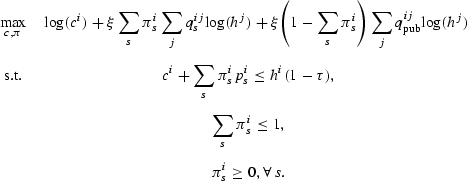
Here, ci is the consumption by parent i, and πis is the probability that parent i sends her child to private school s. The probability that a child of a type-i parent, attending private school s, becomes a type-j parent is qijs. These probabilities are exogenous: The parent chooses the probability that her child attends each private school, but not the inputs to the school. The probability that her child attends the public school is 1−[sum ]sπis. Notice that the parent does not directly choose the probability that her child attends the public school. The probability that a child of a type-i parent, attending the public school, becomes a type-j parent is qijpub. These probabilities are determined through constraints (1) and (2). The price of the consumption good is normalized to 1. The price, or tuition, that a type-i parent pays to private school s is pis, so that the total expenditure of a type-i parent on her child's education is given by [sum ]sπispis. Consumption plus expenditures on schooling must be less than or equal to after-tax income.
The first resource constraint is the consumption resource constraint:

This ensures that total resources allocated to consumption plus total resources allocated to education are not more than the total endowment. The remaining resource constraints are the probability resource constraints:

These constraints guarantee that the probabilities the parents choose match the measures the schools choose.
A competitive equilibrium, is a set of allocations, c,
, z, and prices, p, such that the parents are solving their problems, the operating schools are earning zero profits, the two public school constraints hold, and the resource constraints hold.
I follow the computational method outlined by Caucutt (2002) to find a competitive equilibrium for the static problem. I begin with the social planner's problem, and construct a mapping from the set of weights put on each type of parent in the social planner's problem to a set of transfers that support a corresponding Pareto-optimal allocation as a competitive equilibrium with transfers. I search over the set of weights using a version of Scarf's algorithm to find a Pareto-optimal allocation that can be supported as a competitive equilibrium with no transfers. Along with the corresponding price system, this Pareto allocation is a competitive equilibrium for the static problem.
Finding an equilibrium in a regime with a public school is much more computationally intensive than finding an equilibrium in a purely private regime. This is because of the public school's budget constraint (1) and the public school's peer group constraint (2). Equation (2) can hold for more than one
. Generally, if
is assumed to be the same as the ability of the low-ability students, only low-ability types will choose to attend the public school, whereas the able students will opt for the private schools. This outcome satisfies (2). In the United States, a majority of students attend the public school, so I search for the highest
that satisfies (2).
It may be desirable to consider a system of public schools that cannot price-discriminate by ability. Because I solve for the equilibrium using the social planner's problem, it is only feasible to include one public school. The tax rate is held constant, and so, the equilibria are constrained Pareto efficient. If more than one school were included, parents would have to chose a public school probability directly, and that good would have to be priced. If it is not priced, the peer group externality is not internalized, and the equilibrium is not necessarily constrained Pareto optimal. Therefore, computing equilibrium using the social planner's problem is not appropriate. Although the idea of choosing between a public sector and a private sector is still captured in this framework, considering a full set of public schools is an interesting extension that is discussed in the final section of this paper.
Each school s has a set of associated future income probabilities, qijs, i=1, … 10; j=1, …,10. Recall that qijs corresponds to the probability that a type-i student, attending a type-s school, becomes a type-j parent. Therefore, λi[sum ]sπisqijs is the measure of type-i children who become type-j adults. Summing over all i yields the measure of children who become type-j adults:

A steady-state equilibrium for the dynamic problem is a vector
, a set of allocations c,
, and z, and prices p, such that given
, the allocations c,
, and z and prices p are a competitive equilibrium for the static problem, and the resulting
.
The government may want to give poor parents the same opportunity to send their children to private schools as rich parents. One way to do this is to provide an educational voucher that can help defray the costs of private-school tuition.
2Parents are required to spend the voucher on schooling.
If a voucher-eligible parent sends her child to private school with probability 0.5 and public school with probability 0.5, she receives 0.5 of the voucher.
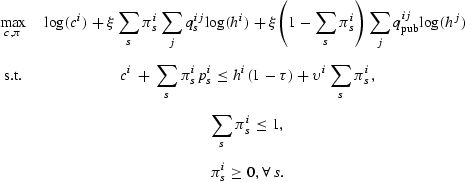
where υi is the voucher given to parent i.
Tax revenues raised for education must now be used to finance the public school and the vouchers. The public school budget constraint becomes

Here, (1−[sum ]szs)epub is the total expenditure at the public school and [sum ]i∈Elλiυi[sum ]sπis is the voucher bill, where El denotes the set of parents that are eligible for the voucher.
There are 10 types of parents, differing over five levels of income and two levels of ability. I take the nine income categories from the 1995 census on total money income of households in the United States, and combine them to create five: $0 to $15,000, $15,001 to $25,000, $25,001 to $35,000, $35,001 to $50,000, and $50,001 to some upper bound. The corresponding representative income levels are, $12,500, $22,000, $32,000, $42,000, and $85,000. I choose these so that the implied mean and median income match those reported. I assume that low learning ability corresponds to al=1, and high learning ability corresponds to ah=2, and that half of the population is high ability. The magnitudes chosen for the ability levels themselves are not crucial; how important they are in the production of human capital (the α parameter) is.
A school is defined by its per-pupil expenditures and the fraction of each type of student attending. In creating the set of possible school types, I allow the fraction of each type attending a school to vary by 0.1, between 0 and 1, and the expenditure level to vary by $500, between $100 and some nonbinding upper bound.
I calibrate the public school version of the model. My parameter choice for the human-capital production function is guided by the empirical literature on the determinants of educational outcomes. The parameter ψ, the elasticity of income with respect to educational expenditures, is chosen to be 0.1. This is based upon estimates by Card and Krueger (1992), Altonji and Dunn (1996), and Grogger (1996). I choose γ, the parameter on the peer group, using an estimate from Black (1999). She finds that parents are willing to pay 2.1% more for a house associated with a school in the same district as another identical house, but with 5% higher average test scores. People spend approximately 15% of consumption on housing services.4
See the Council of Economic Advisors (1996, Tables B12 and B13).
The Herrnstein and Murray (1994) results on the effects of AFQT scores on economic success in adulthood are supported by Korenman and Winship (2000).
A parent receives utility from log consumption plus a parameter, ξ, times the log of the expected income of her child. In the United States, between 88% and 90% of students attend the public schools. I choose ξ to match this percentage. The higher ξ, the lower the percentage in the public school. When ξ=1.72, 88% of the students attend the public school. The tax rate τ is chosen to match public educational spending of 8.2% of earnings. I choose B and σ2, to match the mean and median income levels from the 1995 census of money income of households, $44,945, and $34,219, respectively. For B=4.8625 and σ=0.63, the mean income level is $45,053, and the median is $34,212.
I begin this section by discussing the steady-state equilibrium in the public system, given the parameter choices of the previous section. Using the public system steady-state equilibrium as a benchmark, a variety of voucher policies can be evaluated in terms of their effects on welfare and the distribution of income. Because of computational burdens, I limit my comparisons to across steady states. The range of voucher policies that I consider begins with the extreme, Friedman-inspired, full voucher plan.6
See Friedman (1962, Ch. 6).fn
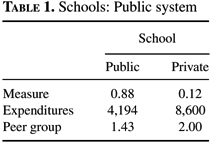
The schools that operate under a system of public school finance are shown in Table 1. There is one private school that 65% of the rich, able students attend. The per-student expenditure level at this school is high, $8,600. There is no role for a subsidy since the school is homogeneous. The students who attend pay $8,600 in tuition. The peer group measure is at its maximum. The rest of the students, including the remaining 35% of the rich, able students, attend the public school. The per-student expenditure level is lower, by over half: $4,194. The peer group measure is 1.43. If everyone attended the public school it would be 1.5. Private school spending is 2.2% of earnings. In the United States, private school spending is 0.7%. One possible explanation for this discrepancy is that in the United States many private schools are associated with churches, and it is likely that not all resources used are recorded as expenditures. Total educational spending is 10.4% of earnings. This spending consists of private and public education spending. Public spending depends on the steady-state distribution of types,
, through the public school budget constraint, τ[sum ]iλihi. The tax rate τ and the income levels hi are exogenous.
There may be some concern surrounding the discrete distribution of types, specifically the five income levels and the two ability levels. From the benchmark equilibrium, it should be apparent that due to the randomizing device, endogenous measures such as attendance in the public school are not functions of the type space. Computational limitations dictate the feasible number of types of parents.
When implementing a voucher system, it is important to constrain eligible parents to spend at least the voucher amount on education. Otherwise the policy will merely be an income transfer. I use the planner's problem to find an equilibrium. The planner's problem provides a constrained Pareto-optimal allocation, and I then construct supporting prices. It is impossible to add constraints on prices into the planner's problem. Requiring parents to pay tuition greater than the voucher that they receive is one such constraint. It is technically possible to constrain consumption to be at least as great as income, less the voucher received. Unfortunately, this is computationally infeasible. I first find an unconstrained equilibrium. I check to see if the voucher constraints are satisfied. If they are, then I have an equilibrium that satisfies the voucher constraint. If not, I remove the offending school from the set of possible schools, and solve the problem again. I continue until I have an equilibrium that satisfies the voucher constraint. In all of the full-voucher-policy experiments, the voucher constraint is initially met. In two of the three targeted-voucher-policy experiments several schools need to be removed from the set of possible schools because some parents who send their children to these schools are not spending the entire voucher on education.
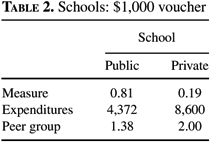
The equilibrium schooling structure when everyone is eligible for a $1,000 voucher is shown in Table 2. With this voucher, only the rich, able students attend the single, homogeneous, private school. All of the rich, able students leave the public school. The private school here is the same as the private school in the public school system, just larger. The expenditure level at the public school is $4,372, which is higher than the expenditure level at the public school in the public system, $4,194. Because the remaining rich, able students leave the public school, the number of students attending the public school falls. The mean income increases slightly, from $45,053 to $45,489, and so, average tax revenue rises nearly $35. Both of these changes cause the per-student expenditures to rise, even though some of the public school budget is now spent on vouchers. The peer group is worse in the public school after a voucher is implemented. The only students who leave the public school are able students. This, of course, brings down the average ability in the public school. Total educational spending is 11.4% of earnings. The fact that this is higher than under the public school system highlights that parents supplement the voucher with their own income and that public education spending rises.
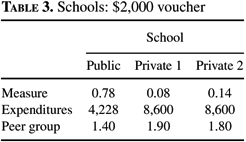
When the voucher is $2,000, some of the rich, unable students leave the public school; see Table 3. All of the rich, able students and 32% of the rich, unable students attend one of the two private schools. Both of the private schools are mixed. The unable students subsidize the able students. In the first private school, the able students pay $8,261 while the unable students pay $11,649. In the second private school, the able students pay $7,934 and the unable students pay $11,264. The only difference between the two private schools is the peer group. If the grid of possible school types were enlarged, these two private schools would collapse into one with an expenditure level of $8,600 and a peer group measure somewhere in between 1.8 and 1.9. The public school is made up of everyone else. The expenditure level is $4,228, and the peer group measure is 1.4. Notice that relative to a voucher of $1,000, expenditures in the public school fall and the peer group measure increases. The peer group measure increases because some unable students leave the public school, bringing up the average ability. The expenditure falls, because even though some students leave the public school, the voucher that all of the students already attending private schools receive is $1,000 more. Educational spending is 11.4% of earnings.
When the voucher is $3,000 (see Table 4), all of the rich students and all of the upper-middle-class, able students leave the public school. The upper-middle-class, able students mix with some of the rich, unable students in the third private school. The expenditure level at that school is $6,600, the upper-middle-class, able students pay $5,788 in tuition and the rich, unable students pay $8,494 in tuition. The other two private schools contain mixes of the two rich types. The expenditure level is $9,100 in both schools, with the unable students subsidizing the able students. The public school is smaller, with just 59% of the population attending. The expenditure level is $4,325. The peer group measure falls to 1.35. Educational spending is 12.9% of earnings, which is substantially higher than under the other two voucher plans. This is due to two facts. First, this voucher is high enough to motivate the rich, unable and the upper-middle-class, able students to leave the public school, and they then supplement the voucher that they receive. And second, the policy causes a rightward shift in the distribution of types, increasing the mean tax revenues $998.

Voucher policies are generally proposed as a way to give poor parents the same educational choices for their children as rich parents. When all parents are eligible for the voucher, only the rich and upper-middle-class parents make use of it. This is hardly the group that policymakers are attempting to target. In this section, I investigate a voucher system where only the two poorest types of parents, the poor and the lower middle class, are eligible for the voucher.
When the voucher is below $3,000, no one uses it. Recall that when there was a full voucher of $3,000, only the rich and upper-middle-class parents used it, and here only the poor and lower-middle-class parents are eligible. I begin with a voucher of $4,000. Table 5 contains the schooling equilibrium. The rich, able types continue to be taxed at the same rate and they do not receive the voucher. However, the private elite school attended by the rich, able types grows relative to the public system. This is because the public school is worse now because the poorer, able types leave the public school causing the peer group measure to fall. Even though per-student expenditures in the public school rise, the fall in the peer group measure is sufficient to make outcomes in the public school worse. All the poor, able and the lower-middle-class, able parents who qualify for the voucher use it while none of the unable parents, who qualify for the voucher, use it. All of the poor, able students and all of the lower-middle-class, able students attend a second private school with educational spending below that in the public school, $4,100, but with a peer group measure that is higher, 2. This school could be referred to as a voucher school, since it contains only students who receive a voucher, and the expenditure level is basically the voucher level. Here, the voucher does not encourage any additional educational spending. In fact, another way to think about what is happening is that the public school splits into two. One school has all of the poor and lower-middle-class, able students and the other has everyone else. Resources aren't split exactly evenly across the schools and, obviously, the peer group differs. Educational spending is 10.9% of total earnings.
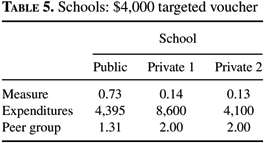
Table 6 contains the results for a targeted voucher of $5,000. The outcome differs somewhat from that when the targeted voucher is $4,000. Almost all of the rich, able students attend the elite private school. Again, even though they do not receive a voucher, the public school option is worse on both the expenditure and peer group dimensions than when the voucher is $4,000. All of the lower-middle-class, able students attend the homogeneous second private school, where they do not supplement the voucher. The third private school is composed of all of the poor, able students and about 5% of the poor, unable students. The poor, unable students subsidize the poor, able students, but not so much that the poor, able students spend less than the voucher. Educational spending is 11.4% of total earnings.

When the targeted voucher is $6,000, all of the rich, able students attend private schools; see Table 7. One of these, School 2, is made up of 6% of the rich, unable as well. The declining quality of the public school encourages even some of the unable, rich to attend private schools. All of those who qualify for the voucher use it. School 4 is homogeneous and is made up of all of the lower-middle-class, able students. School 6 is homogeneous as well and consists of all of the lower-middle-class, unable students and most of the poor, unable students. School 5 is a mix of all of the poor, able students, and the remaining poor, unable students. No one who receives the voucher is supplementing it. Educational spending is 12% of total earnings. Notice that the increase in educational spending that results from increasing the targeted voucher is coming from the additional rich students who are driven from the declining public school and who supplement their voucher with private spending, and the slight increase in mean tax revenues of $44.

I compute a steady-state equilibrium for the perfectly private system of schools. There are seven kinds of schools in equilibrium, which means that some mixing of student types occurs. In fact, only one of the schools is homogeneous, a school with all the poor, unable students. The expenditure levels range from $1,600 to $8,600 per student, and the peer group measure ranges from 1 to 1.8. In all of the heterogeneous schools, there is a subsidy from the unable students to the able students. For instance, in the school that consists of half middle-class, able students and half upper-middle-class, unable students, and that spends $5,600 per student, the able students pay $3,957 in tuition and the unable students pay $6,243 in tuition. The spending on education is 11.6% of earnings, which is higher than the 10.4% in the public system, but lower than most of the voucher plans.
Measuring welfare costs in an environment with heterogeneity is not straightforward. For each policy, I compute the expected utility of a hypothetical individual whose income is a random draw:

where Ui is the utility of a type-i parent. Notice that in using this measure, there could be a policy that yields Ui<Uibenchmark, ∀i. However, the change in the distribution
could be such that W>Wbenchmark. In other words, utility could be lower for every type of parent, but the measure of poor could decrease enough to increase welfare. Given W, I then calculate the percentage by which the vector of consumption must change under the new policy in order for the hypothetical individual to be indifferent to the benchmark policy. I use consumption instead of income. Using income would require the individual to reoptimize over consumption and schooling. Because utility over consumption is log, this is an easy calculation to make, exp{Wbenchmark−Wpolicy}. I translate this into a welfare measure, k, in terms of the percentage change in consumption of moving to the new policy from the public school benchmark. The two measures of inequality that I use are the coefficient of variation, or the standard deviation of the distribution divided by its mean, and the Gini coefficient.
Table 8 contains the mean and the median of the income distribution; the measures of inequality, CV and Gini; a measure of the correlation between parent's income and child's income, ρ; measures pertaining to the public school, λpub, epub,
; and the welfare measure, k.

There are two channels through which a policy change affects welfare. First, such a change will cause the distribution of types of parents to shift. Second, it will affect the utility of each type. Even if a representative parent of each type is made worse off by a policy change, if the distribution of types shifts to the right, there could be an increase in welfare. The policy changes considered here tend to have very small effects on utility within types. Because there are much larger differences in utility across types, small rightward shifts in the distribution will increase welfare. Shifts in the distribution also affect welfare indirectly through changes in utility. If the average income rises, due to a rightward shift in the distribution, average tax revenues rise and hence public education spending rises. This can only affect utility through educational spending since the tax rate is unchanged.
Implementing a $1,000 voucher in a public school system has almost identical effects on inequality and welfare as a $2,000 voucher. Both imply a welfare gain of around 2% of consumption each period, a decrease in the Gini coefficient of a third of a percent, and a decrease in the coefficient of variation of a half of a percent. They also both result in an increase in the correlation between parent and child income, 0.40 to 0.41. The primary difference is that when the voucher is $1,000, the mean incomes of those who attend the public school actually rise. Those who make use of the voucher are better off and those who remain in the public school are better off. There is a rightward shift in the distribution over types because the voucher increases the mean income of all types. When the voucher is $2,000, the incomes of those in the public school fall, but those on the upper end of the distribution benefit from a larger voucher. Both of the rich types use the voucher. Therefore, both the able and unable, rich types are more likely to be rich. The distribution shifts to the right. When the voucher is $3,000, there is a large welfare gain of over 5% each period. The Gini coefficient falls 1.12% and the coefficient of variation falls 1.52%. The welfare gains and reductions in inequality are substantially larger for this voucher. This results from the dramatic increase in the number of people actually using the voucher and the large increase in tax revenues. Here, some of the upper-middle-class, able and all of the rich use the voucher. So, while those who attend the public school get a small decrease in their mean incomes (this decrease is tempered by the increase in tax revenues), those who attend private school get a much larger increase in mean incomes. This gives rise to a more dramatic rightward shift in the distribution of types.
The changes in welfare and inequality associated with implementing a targeted voucher are smoother, as the voucher increases, than under the full voucher plan. The welfare gains increase with the size of the voucher, ranging from just over 1% to just over 2.5%. The reductions in inequality also increase with the size of the voucher. They range from 0.31% to 0.87% reductions in the coefficient of variation and 0.21% to 0.71% reductions in the Gini coefficient. The correlation between parent and child income is unchanged. All of the targeted voucher plans reduce the mean incomes of those in the public school by more than even the largest full voucher. This is because the targeted voucher plans cause all of the low-income, able students to leave the public school. The largest full voucher only induces some of the rich, able students (some are initially in the private school), the rich, unable students, and the upper-middle-class, able students to leave the public school. Because some of the unable are leaving as well, this keeps the public school peer group measure from falling very much. The increases in educational spending under the targeted voucher plan are not enough to make up for the large losses in the peer group. The reduction in mean income for all of the unable students in the public school, combined with the fact that few unable students use the voucher, implies that the distribution over unable types shifts to the left. However, the distribution over able types shifts to the right because the poor, able and lower-middle-class, able students are using the voucher. Overall, the distribution shifts to the right, but the gains are smaller than under a full-voucher policy. It is important to highlight that the full-voucher plan does better than the targeted plan, because under the full-voucher plan fewer people use a smaller voucher.
A switch from the public school steady state to the private school steady state implies a substantial increase in the correlation between parent and child income: 0.40 to 0.45. There are also increases in the mean and median income and both measures of income inequality. There is a welfare loss of 3% of consumption. The welfare loss is predominantly due the fact that there is no redistribution in the private system.
The results here contrast somewhat with the results of Caucutt (2002). That model is static with only two income levels and two ability levels. In that framework welfare is increasing in the size of the voucher, but initially it is negative. Income inequality, measured in a variety of ways, is greater under the three voucher systems considered. When comparing welfare results across the two papers, it is important to keep in mind that in the current paper the distribution of types is endogenous. This affects the welfare measure directly, and indirectly through changes in utility resulting from a change in the tax-base used to finance education. Neither the compositional effect nor the tax-base effect were present in the purely static framework. The voucher policies in the current paper all shift the distribution to the right, creating upward pressure on the welfare measure directly and indirectly through the increase in educational spending.
A second difference is the number of types being considered: 10 types as opposed to 4 types. In the static framework, all the voucher policies cause the peer group in the public school to bottom out at the level of the unable type. The expenditure level at the public school rises, but not enough to compensate for the fall in the peer group. With 10 types, the distribution is finer so that some of the poor, able types remain in the public school even with vouchers. This keeps the peer effect from falling drastically. Combined with the increase in tax base putting upward pressure on the public school expenditures, this means that while the utility of those left in the public school may fall, it does not fall as much. This is also a reason why inequality falls in the repeated framework. At the low-voucher level, the public school is actually better than before, and so, the distribution over income levels shifts to the right. As the voucher level grows, the fact that the public school is a little worse than before is compensated by the number of families in the middle of the distribution who make use of the voucher so that the distribution still shifts to the right. In the static framework, with an exogenous distribution of types, the public school outcomes fall while the voucher outcomes rise, causing an increase in inequality.
There is not a lot of empirical evidence about the strength of the peer group parameter, and so, I perform a sensitivity analysis over γ. I choose a value higher than the benchmark, 0.1, and a value lower than the benchmark, 0.05, recall the benchmark was γ=$0.07. I recalibrate the model, adjusting ξ, B, and σ, to match the percentage in the public school, and the mean and the median income levels, respectively. The welfare and distributional results are given in Tables 9 and 10. It is hard to compare exactly across the peer group parameter, holding a voucher level fixed, because in some cases the voucher will induce slightly more or slightly less mixing. However, some basic patterns exist. First, as the peer effect gets stronger, relative to the other inputs, the welfare gains from switching to a voucher system are not as large and the welfare cost associated with switching to a private system is greater. When switching from a public system to a $3,000 full voucher, there is a welfare gain of 6.12% when γ is 0.05, 5.46% when γ is 0.07, and 3.81% when γ is 0.1. Switching to a private system implies a welfare cost of 1.59% when γ is 0.05, 3.07% when γ is 0.07, and 5.52% when γ is 0.1. It also appears that as the peer group parameter gets larger, switching to a voucher system implies smaller decreases in inequality, and switching to a private system implies a greater increase in inequality. For example, when switching to a private system, the coefficient of variation does not change when γ is 0.05, and it rises by 0.67% and 1.96% when γ is 0.07 and 0.1, respectively.


The smaller γ is, the less important the peer group is to future earnings. This means that when a voucher system is adopted, a decrease in the quality of the peer group of the public school is less costly to those who remain in the public school. For instance, when γ is 0.05, those remaining in the public school are better off in all of the full voucher cases. In the other two cases this is only true when the voucher is $1,000. Therefore, as γ rises, voucher policies are more costly for those who remain in the public school. For an able student in the private school system, a higher γ means the potential for a greater subsidy (their ability is now more valuable to others), while the converse is true for an unable student. The fraction of the population who either remain in the public school or who are unable students in a private school is larger than those who are able students and in a private school. Unless those in the latter category gain disproportionately more, the welfare gain should fall as γ rises.
In this paper, I study the effect that switching to a voucher system of educational finance has on the distribution of income. The framework that I use extends Caucutt (2001) to a dynamic setting. A parent who cares about her own consumption and her child's future income makes schooling decisions for her child, knowing that his expected income depends on his own ability, his parent's income, his peer group, and his educational expenditures. Given these schooling decisions, a distribution of income for the next generation of parents is generated. I calibrate a public system benchmark to U.S. data and simulate two different forms of education finance. The first is a system that offers educational vouchers to eligible parents, and the second is a completely private system of schools.
I compare policies across steady states. All voucher policies considered result in welfare gains and reductions in income inequality, relative to the public school benchmark. The voucher policies that are targeted to the two poorest types give rise to smaller welfare gains and reductions in income inequality than do the full-voucher policies. Interestingly, this is mainly because more people use the larger voucher when it is targeted to the poor, causing a greater decline in public school outcomes. A switch to a private school system entails a welfare loss and an increase in income inequality. Lastly, the more important the peer group is to future income, the smaller the welfare gains and reductions in inequality associated with voucher systems, and the greater the welfare cost and increase in inequality associated with a private system.
I greatly appreciate the comments of Charles de Bartolome, Stephen Coate, Narayana Kocherlakota, Lance Lochner, Antonio Merlo, Edward Prescott, Victor Rios-Rull, and two anonymous referees. Of course, any errors are mine.
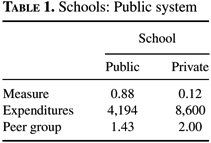
Schools: Public system
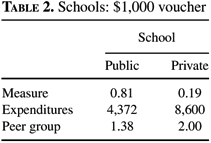
Schools: $1,000 voucher
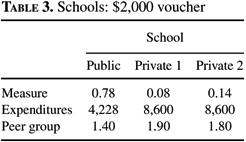
Schools: $2,000 voucher

Schools: $3,000 voucher
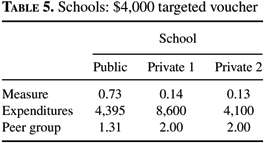
Schools: $4,000 targeted voucher

Schools: $5,000 targeted voucher

Schools: $6,000 targeted voucher

Steady-state comparisons to the public system (percentage changes are in parentheses)

Steady-state comparisons to the public system, γ=0.05 (percentage changes are in parentheses)

Steady-state comparisons to the public system, γ=0.1 (percentage changes are in parentheses)