INTRODUCTION
The recent theoretical literature on finance and development establishes that financial development and long-run economic growth are linked phenomena. Various models within this literature predict that the development of financial intermediation services contributes to growth since, by creating liquidity and risk diversification opportunities and mitigating informational asymmetries by means of monitoring and screening technologies, it favors the allocation of financial resources toward the most productive investment projects.1
Greenwood and Jovanovic (1990), Bencivenga and Smith (1991, 1993, 1995), Levine (1991), Saint-Paul (1992), De Gregorio (1993), King and Levine (1993b), Roubini and Sala-ì-Martin (1995), Acemoglu and Zilibotti (1997), Boyd and Smith (1998), and Khan (2001) are key examples of this strand of literature. Comprehensive surveys on the topic are those by Pagano (1993) and Levine (1997).
An extensive amount of empirical work offers support for this leading view. Cross-country linear econometric analyses, such as that by King and Levine (
1993a,
b), document the existence of a strong relationship between initial financial development and subsequent growth. More recent studies such as those by Rajan and Zingales (
1998) and Levine et al. (
2000) confirm that financial development can have a causal role in the growth process.
Comparatively less attention has been paid to the issue of whether the provision of growth-inducing banking intermediation services is affected by the structure of the credit market. The traditional argument suggests that departures from perfect competition are detrimental for growth insofar as they are bound to generate inefficiencies in the allocation mechanism provided by the credit market. However, in a second-best world, moving toward perfect competition does not necessarily guarantee Pareto improvements. Hence, to the extent that financial intermediaries emerge as a second-best response to the (informational) imperfections endemically associated with financial transactions, there is no reason why an increase in the degree of competition and a reduction of concentration in the credit industry would necessarily improve the efficiency of intermediation.
On this account, Manove et al. (2001) and Gehrig (1998) find that competition in the credit industry has an ambiguous effect on socially valuable screening activity by financial intermediaries. Along similar lines, Petersen and Rajan (1995) argue that monopolistic power facilitates the establishment of lending relationships, which makes firms' access to credit easier.2
Other contributions on the subject include Shaffer (1998) and Riordan (1993).
Cetorelli and Peretto (
2000) elaborate further on this line of thought by proposing a model in which the type of lending relationship emerging in the context of competitive credit markets can have negative consequences for capital accumulation, whereas banks' market power can be beneficial for growth. The argument is that in the presence of market power, banks have more incentive to undertake screening activities since they can extract a rent from the information advantage this would generate. However, associated with this rent is the typical inefficiency in quantities generated by monopolistic behavior. Under specific conditions, the optimal trade-off between the two effects is achieved by an oligopolistic structure of the credit market.
Empirical tests of the relationship between market structure and growth offer mixed evidence. Petersen and Rajan (1995) offer evidence that firms are less credit constrained and face cheaper credit the more concentrated the credit market is. On the other hand, Cetorelli and Gambera (2001) find that, although some firms and industries benefit from greater banking concentration, the overall impact on industrial growth is negative. Black and Stranhan (2002) find that less concentration is associated with higher levels of newly created firms.
In this paper, we provide new theoretical insights and empirical evidence on how the relationship between banking concentration and growth might vary along the process of economic development. We abstract from lending relationhips and other specific sources of inefficiency that competition might induce in the presence of asymmetric information. Instead, we develop a model that focuses on the effects of bank proliferation when banks' intermediation technology makes use of accumulable inputs. On the one hand, banks improve the allocation of financial resources to investment, which promotes economic growth. On the other hand, they also absorb accumulable inputs at the expense of the real sector. This reduces the availability of inputs used by the real sector to generate output, with adverse consequences for growth.
We analyze explicitly these two effects induced by the presence of banks, by modeling a two-sector economy that comprises a real sector, where perfectly competitive firms produce the final good, and a banking sector where banks compete in providing an intermediation service by pooling savings and channeling them toward firms.3
Two-sector models are commonly used in other strands of the literature on growth, such as that on growth and research and development and human capital accumulation. See Aghion and Howitt (1998) and Barro and Sala-ì-Martin (1995) for a discussion.
The aggregate firms' production is governed by an “AK” production function, so that the concept of capital is interpreted in a broad manner to include both physical and human capital. Banks' intermediation technology is also capital-intensive. Thus, banks and firms compete for the use of capital, which is the only source of growth. In particular, we assume that banks' technology displays both economies of scale and economies of specialization. Modern banking systems are characterized by a variety of institutions, including specialized banks that deal with sector-specific and geographic-specific needs of savers and borrowers.
4 On the existence of economies of specialization in the banking industry with reference to the U.S. economy and their significance, see Sussman and Zeira (1995) and Harrison et al. (1999). For an interesting microeconometric study on Belgium, see Degryse and Ongena (2002).
Accordingly, in our model, the heterogeneity of financial needs, whether geographic or of any other source, coupled with the assumption of economies of specialization, justifies the exitence of many banks.
Within this setup, a reduction in the level of concentration in the banking industry due to an exogenous change in the level of credit market contestability has two opposite effects. On the one hand, it induces duplication of fixed capital allocated to financial services, which is detrimental for economic growth.5
Banks' fixed capital includes both physical and human capital as well as financial resources that banks retain for liquidity reasons and other considerations related to risk management [see Pagano 1993].
On the other hand, it increases banks' specialization, which enhances efficiency (the average working capital of banks is reduced) and growth. The trade-off between the two opposing effects induced by concentration changes along the process of economic development. For instance, if there are decreasing returns to specialization, the specialization effect dominates at sufficiently low levels of economic development, when the equilibrium number of banks is low. Hence, at low levels of per-capita income, the net-growth effect of a reduction in concentration is positive. However, the specialization effect becomes weaker as the number of banks increases with economic development. Therefore, as development proceeds, the net benefits of bank proliferation will gradually decline. Eventually, at sufficiently high levels of economic development, the net-growth effect of a further reduction in the level of concentration could become negative, when the specialization effect is finally dominated by the duplication effect.
Accordingly, the model suggests that whether an increase in the level of concentration negatively or positively affects the growth rate of the economy might depend on the level of economic development. We explore this main implication using two data sets. Specifically, after controlling for other potential determinants of growth, we test whether the effect of banking concentration is different across low-income and high-income countries using both cross-country per-capita income growth data and cross-country industry growth data. We find that concentration in the banking industry is negatively associated with both real per-capita income growth and industry growth only in low-income countries, but there is no significant relationship between banking concentration and growth in high-income countries. We also find that the specialization effect is weaker in high-income countries. These findings are highly relevant for policy recommendations. They suggest that reducing concentration is more likely to promote growth in low-income countries, whereas in high-income countries the benefits that arise from further specialization may not be important enough to offset the costs associated with the duplication effect.
The paper is organized as follows. Section 2 presents the model and Section 3 discusses the empirical framework and results. The last section concludes.
MODEL
We consider an economy with two sectors: a real sector, where output is produced by perfectly competitive firms, and a banking sector, where savings are intermediated by banks and channeled toward firms' investments. There is a continuum of size 1 of individuals and a continuum of size 1 of firms. Firms share the same production technology, which is described by the production function, yt=AkαtBt, where yt is GDP per unit of labor, kt is capital per unit of labor, and Bt=k1−αt is a standard learning-by-doing externality. Since the mass of firms also equals 1, yt and kt measure both firms' individual income and capital per unit of labor as well as aggregate product and capital per unit of labor. Moreover, we assume that each individual supplies one unit of labor. Hence, given the size of the overall population, aggregate labor supply is also normalized to 1. This implies that yt and kt measure both income and capital per capita as well as income and capital per unit of labor.
Because of the externality effect, given the level of kt, the equilibrium aggregate product is yt=Akt. Coherent with the AK form of the equilibrium production function, we interpret capital in a broad sense to include both physical capital and human capital.6
For a discussion of the AK model and the underlying broad concept of capital, see Aghion and Howitt (1988).
Since firms are perfectly competitive, at each time t a fraction 1−α of the aggregate income yt is appropriated by labor while the rest goes to remunerate capital. At each time t, aggregate savings are given by st=syt, where s is the marginal propensity to save.7
As shown in the Appendix, Section A.1 the model can be interpreted as a reduced form of an OLG model.
Savings are channeled to the banking sector in the form of deposits.
Firms have no internal resources to finance capital accumulation and therefore need to be externally financed. Although firms share the same production function, they are heterogeneous in their financial needs. External finance is provided by banks. Banks' technology uses capital. Accordingly, the banking sector and the real sector compete for the use of capital. Each bank requires a fixed amount F of capital. Moreover, each bank uses an amount of working capital h(z) per unit of savings channeled to firms in the form of loans, where z is the mass of financed firms. We assume h′(z)>0: The higher the mass of firms being financed, the higher the degree of heterogeneity, and this is reflected in higher working capital requirements.
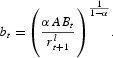
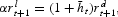
Given the gross interest rate on loans to be paid at time t+1, rłt+1, firms' individual demand for loans at time t is
Both banks and depositors take the interest rate on deposits rdt+1 as given. Differently, the market for loans has a monopolistically competitive structure.8
Since the model focuses on the banking sector as a whole rather than on a specific banking product, monopolistic competition allows us to model the macroeconomic equilibrium of the banking sector in a robust and simple way.
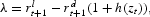
Hence, banks set the interest rate on loans
rłt+1 to maximize profits.
As shown in the Appendix, Section A.2, this implies
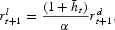
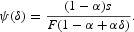
where
is the average working capital per unit of funds allocated to firms. According to equation (2), the interest rate on loans is obtained by applying a markup to the interest rate on deposits. As for the choice of market share, zt, we restrict our attention to equilibrium situations in which banks face competition, so that each individual bank serves a market share zt=1/nt; more details are provided in the Appendix, Section A.2.
At time t, individual savings are st=syt. Note that st also measures aggregate savings since the individuals' population is normalized to 1. At each time t, aggregate savings, st, finance investment in capital made by firms and banks. Assuming full capital depreciation,
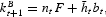
must hold in equilibrium, where kt+1=bt is firms' aggregate capital, bt, and kBt+1 is banks' aggregate capital. Note that firms' capital equals firms' investment, which in turn is equal to loans bt, where bt and kt+1 refer to aggregate as well as individual loans and capital, respectively, since firms' population is normalized to 1. Given the equilibrium number of banks operating at period t, nt, we have
where
is banks' aggregate investment in working capital, and ntF is banks' aggregate investment in fixed capital. Substituting for the expressions of kBt+1 and st in equation (4) using bt=kt+1, and given yt=Akt, we find
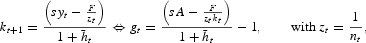
where gt is the growth rate of both capital and output per capita.
According to expression (6), gt depends on the number of banks nt via zt and
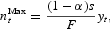
. For a given level of yt, the equilibrium number of banks will depend on the degree of market contestability, which we assume to be exogenously determined by institutional and regulatory factors. As derived in Section A.3 of the Appendix, by imposing free entry into the credit market, the equilibrium number of banks in the case of a perfectly contestable market turns out to be
where, by perfectly contestable market, we mean a market in which banks make zero profits. We can immediately verify that nMaxt is an increasing function of yt: Economic development induces entry in the banking sector.
Banking Concentration, Economic Development, and Growth
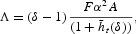
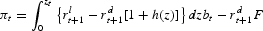
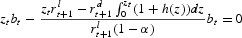
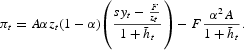
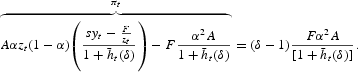
If the banking sector is less then perfectly contestable, profits will not be equal to zero, in equilibrium. Hence, the corresponding number of banks should be less than nMaxt. Let us define nt(δ) as the number of banks such that the resulting equilibrium level of banks' individual profits πt(nt(δ)) equals Λ[ges ]0 where
with δ[ges ]1. Then, as discussed in the Appendix, Section A.3,
holds, where
A comparison between (9) and (7) indicates that nt(δ) can be interpreted as the equilibrium number of banks associated with a degree of market contestability 1/δ[les ]1, with δ[ges ]1, such that the equilibrium level of individual banks' profits is Λ[ges ]0. Accordingly, δ=1 indicates perfect market contestability—for δ=1, Δ=0 follows—while δ>1 means less than perfect market contestability. In fact, we note that nt(δ) approaches nMaxt as δ approaches 1 with nt(δ)=nMaxt for δ=1 and nt(δ)<nMaxt for δ>1.
Higher market contestability (lower δ) is associated with a higher number of banks [nt(δ)], which in turns means a lower degree of market concentration, as measured by zt(δ)=1/nt(δ). Using these definitions, we can analyze, for a given level of economic development proxied by either yt or kt, the growth effects of having a lower level of market contestability, that is, a lower δ and more concentration, as opposed to having higher market contestability and less concentration. In simpler terms, we can tackle the issue of how the growth effect of concentration might vary along the process of economic development.
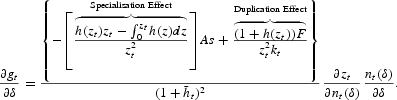
For a given value of yt, the growth rate of the economy, gt, depends on the degree of concentration in the credit market, zt, in two opposite ways. On the one hand, a reduction in zt translates into a higher degree of specialization, since the market share served by each bank, measured simply by either zt or ztst, shrinks. Other things equal, this specialization effect reduces the amount of working capital used by the banking sector,
, so that more capital can be allocated to firms' production, which increases the growth rate. On the other hand, a reduction in zt requires an increase in nt, which implies an increase in the stock of fixed capital absorbed by banks, ntB. This duplication effect reduces the net stock of capital available for production with a negative impact on gt.
Other things equal, the growth effect of an increase in the degree of concentration zt induced by a marginal increase in δ is given by
The term [∂zt/∂nt(δ)][nt(δ)/∂δ] is positive, so that the above expression confirms that an increase in the level of concentration induced by lower market contestability increases (reduces) growth if the specialization effect is dominated (dominates) the duplication effect.
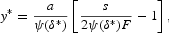
The specialization effect declines in the level of specialization already achieved by the economy as inversely measured by zt. Since economic development promotes entry, more developed economies have comparatively more specialized banks than developing ones. Hence, if the specialization effect declines faster than the duplication effect as economic development increases, we should observe an increase of concentration to have a negative growth effect at sufficiently low levels of economic development and a positive one otherwise. In any case, we should observe a different relationship between concentration and growth at different levels of economic development. For instance, assume that working capital requirements increase linearly with the degree of heterogeneity; that is, h=za. Then, the degree of market contestability δ* leads to an inefficiently high degree of market concentration for levels of per-capita income below y*, where
while it induces insufficiently low concentration for levels of per capita income above that threshold. Correspondingly, an increase in the level of market contestability and a reduction of concentration would be beneficial for yt<y* and detrimental otherwise.9
Note that y*>0 holds for any δ[ges ]1 so long as α>1/2.
To summarize, the model's main implication is that the growth impact of a change in the level of banking concentration induced by an exogenous change in the level of market contestability is dependent on the level of economic development. If the specialization effect declines sufficiently fast compared to the duplication effect, we expect, for a change in the level of banking concentration, to have a negative impact on growth at sufficiently low levels of income, but a positive or no significant impact on growth at sufficiently high levels of income [see also equation (12), which refers to the linearity case].
EMPIRICAL SPECIFICATION, DATA AND RESULTS
In this section, we examine the model's main implication of a potential nonlinear relationship between banking concentration and economic growth using two data sets. The first data set focuses on cross-country industry growth data. The use of this data set allows us to draw comparisons with the existing literature, mainly with the study by Cetorelli and Gambera (2001), which examined the empirical relationship between banking concentration and industrial growth. Specifically, we test whether the negative relatinship between banking concentration and industrial growth obtained from linear specifications holds for both high-income and low-income countries.10
Following the literature, we use the level of per-capita output (a proxy for economic development) as the threshold variable. We group the countries into high income or low income based on the World Bank classification (see the World Development Indicators Database). The list of high-income and low-income countries is reported in Tables 1–4.
Furthermore, the focus on industry growth rates can provide us with valuable evidence on the relation between concentration and economic growth since, as emphasized by Rajan and Zingales (
1998), industry growth constitutes an important element of economic growth [see also Beck et al. (
2001)].
11 Testing industry growth data is not inconsistent with our model. In the model the industry growth and country growth rates are the same. Specifically, firms are identical and grow at the same rate as the economy.
The second data set focuses on cross-country per capita growth rates. The use of this additional data set generates at least two main benefits. First, it allows us to test the robustness of our results. If we are able to establish similar patterns using very different data sets that use different growth measures, then this will increase our confidence about the obtained empirical results. Second, it allows us to use a wider set of proxies for banking market structure, such as the degree of specialization and competition, which are not available for the cross-sectional industry growth data set. The use of finer measures on banking market structure is likely to enhance our understanding of the relationship between the structure of the banking sector and economic growth.
Banking Concentration and Industry Growth
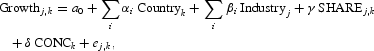
Cetorelli and Gambera (2001) use the following model to assess the impact of banking concentration on industrial growth:
where ej,k is the error term, Growthj,k is the rate of growth of real value added of the industrial sector j in country k, Industryj is the dummy for industrial sector j, Countryk is a country control, SHAREj,k is the initial industry j share of manufacturing value added, and CONCk is a measure of banking concentration. Initial income per capita, a measure of initial human capital, and a measure of banking development are used as country control variables to control for potential growth determinants. It is expected that industries in initially richer countries will grow slower, higher initial secondary school enrollment rates will be associated with faster subsequent industrial growth, and higher levels of banking development will be associated with higher industrial growth rates. To compare our results with those of Cetorelli and Gambera (2001), we also include a measure of initial stock market capitalization and an index of the quality of accounting standards as additional control variables. The stock market capitalization controls for the relative importance of alternative sources to banking finance and is expected to be positively correlated with industrial growth. The accounting standards measure is an index reflecting the quality of disclosure of firms' annual reports. The stronger are these standards, the lower the information costs that banks have to incur in monitoring firms.
The industry dummies are used to control for industry-specific effects, whereas the industry share of manufacturing value added (SHARE) is used to control for the the industry-specific convergence effect and, as such, plays a role similar to that of per-capita income in cross-country growth regressions. We expect industries with a large share to grow more slowly, and therefore, we expect a negative coefficient on this variable. In this, it is implied that all countries will conditionally converge to the same industrial structure.
The level of banking concentration in each country (CONC) is used to test for the effect of banking market structure on industry growth. Our theoretical discussion suggests that the effect of banking concentration on industry growth can be different depending on the level of economic development. To test whether the relationship is different across low-income and high-income countries, we introduce a dummy variable that takes the value of 1 for high-income countries and 0 for low-income countries (DUMH) and an interactive term between the measure of banking concentration and the constructed dummy variable (DUMH*CONC). Hence, we modify equation (13) as follows:
The main hypothesis that a different relationship between banking concentration and industrial growth exists between high- and low-income countries implies predictions about the significance of the estimate for coefficient on the interactive term, δ2. If δ2 is statistically significant, then we reject the null hypothesis that the coefficients on banking concentration are the same between high-income and low-income groups. In this case, the coefficient on banking concentration for low-income countries is δ1, whereas that for high-income countries is δ1+δ2. To assess the significance of banking concentration for the high-income group, we test whether the sum of the coefficients δ1+δ2 is significantly different from zero using an F-test.
We use Rajan and Zingales's (1998) cross-country industry data set obtained from the Industrial Statistics Yearbook database and augmented recently by Cetorelli and Gambera (2001) to include various concentration measures of the banking sector.12
For detailed descriptions of the data set, see Cetorelli and Gambera (2001).
The data set consists of 36 industries (all belonging to the manufacturing sector) from 41 countries, yielding a large sample consisting of 1,150 observations. The relevant growth variable is the rate of growth of real value added for each industrial sector, averaged over the 1980–1990 period. Initial human capital is measured by the average school years in the population over 25 in 1980. Initial income per capita is measured by the logarithm of per-capita income in 1980. Banking development is the ratio of private credit to GDP averaged over the 1980–1990 period. Stock market capitalization is the ratio of stock market to GDP in 1980. Banking concentration is measured by the sum of market shares (in terms of total assets) of the three largest banks, averaged over the 1989–1996 period.
Empirical results
Both ordinary least squares (OLS) and instrumental variables (IV) estimations are used to estimate equation (14). One could argue that the banking market structure adjusts to a level that is optimal for a country's industrial structure, implying potential endogeneity of the banking concentration measure. However, this argument neglects the fact that there are political and regulatory institutions that may affect the natural development of the market structure of the banking sector. Furthermore, in many countries, especially those that have witnessed extensive periods of severe financial repression, the market structure of the banking sector may be a favorite policy variable not necessary related to industrial growth [Cetorelli and Gambera (2001)]. Despite these arguments, to compare our results with those of Cetorelli and Gambera, we address the issue of endogeneity by means of IR estimation, using their instruments which proxy for the country's institutional characteristics and the size of the market [see Levine et al. (2000)].13
In addition to the legal origin, we included at first the rule of law (a measure of the extent to which rules are enforced in a country) used by Cetorelli and Gambera (2001). However, the Sargan (1964) misspecification test suggested that the rule of law should be included in the original equation and hence cannot act as a valid instrument. The full list of instruments used is reported in Tables 1 and 2.
We report the Durbin-Wu-Hausamn test of overidentifying restrictions [Davidson and MacKinnon (
1993)] to test the null hypothesis that the use of instrumental variables does not change the estimation outcome.
Table 1 reports the OLS and IV regressions with the full set of control variables.14
The set of full results including the introduction of each of the country controls sequentially are available from the authors upon request. The results are very similar to those reported in Table 1 and hence we focus only on the specification in which all variables are significant.
The results suggest that industries in initially richer countries tend to have slower industrial growth; sectors that have witnessed high growth rates in the past are likely to grow at slower rates; countries with a higher law-and-order tradition tend to have higher industrial growth rates; and a higher level of initial stock market development and a higher level of banking development are associated with higher industrial growth rates. Interestingly, the coefficient on the interactive term (δ
2) is highly significant, indicating that the impact of bankingconcentration on industrial growth is different across high-income and low-income countries. Specifically, based on the OLS regressions, concentration enters with a significantly negative and large coefficient (–0.13) in low-income countries. On the other hand, for the high-income group, the coefficient on banking concentration is positive and very small in magnitude (0.006), but is not statistically significant at conventional levels.
15 To assess the significance of banking concentration for the high-income group, we test whether the sum of the coefficients δ1+δ2=0 is different from zero using an F-test. The F-tests are reported in Table 1.
The results from IV regressions are very similar to those of OLS where concentration enters with a significantly negative and even a slightly larger coefficient for low-income countries. On the other hand, the coefficient on banking concentration for high-income countries is not statistically significant.
Our results are robust to a number of sensitivity checks. As indicated previously, the main conclusions are not sensitive to the inclusion of a wide list of country controls. In addition to estimating joint regressions with common coefficients for all variables except banking concentration, we also split the sample into high-income and low-income countries and we estimate for each subsample the empirical specification (1) via OLS and IV. We then employ the Chow test statistic to test the null hypothesis that the coefficients on banking concentration are the same across the high-income and low-income groups. The conclusions do not change when we find that the effect of banking concentration on industrial growth is negative and highly significant in low-income countries, but not significant in high-income countries (see Table 2). The Chow test, which tests the null hypothesis that the coefficients on banking concentration are the same across the high-income and low-income countries, suggests a similar conclusion.
In short, the empirical results using industry growth rates clearly suggest that the negative relationship between banking concentration and industrial growth derived from linear specifications holds only for low-income countries. On the other hand, there is no statistically significant relationship between concentration and industrial growth in high-income countries. These results are consistent with our theoretical model, which highlights the limitations of using linear empirical specifications to study the relationship between banking concentration and economic growth.
Banking Concentration and Cross-Country Growth Rates
In addition to industry growth regressions, we test the implications of our model using cross-country growth data. We estimate a model similar to that found in Barro and Sala-ì-Martin (1992) and King and Levine (1993a,b), where the real growth of per-capita income is regressed on a vector of country controls and measures of banking concentration. To assess whether the impact of banking concentration is different across low-income and high-income groups, we introduce DUMH*CONC, as before. Hence, the standard growth regression is modified as follows:
The dependent variable is the growth rate of real GDP per capita, averaged over the 1990–1999 period. We include country control variables widely used in cross-sectional regressions to control for other potential determinants of cross-country growth rates [see, e.g., Barro and Sala-ì-Martin (1992), Beck et al. (2001)]. Specifically, we include initial income per capita (LINITIAL90), banking development, trade openness, government size, and the inflation rate as country control variables. Initial income per capita is measured by the logarithm of real GDP per capita in 1990. Trade openness is measured by real exports and imports as share of real GDP averaged over 1990–1999. Banking development is measured by domestic private credit provided by banking sector as a share of GDP averaged over the 1980–1995 period. Government size is measured by government expenditure as a share of GDP averaged over the 1990–1999 period. The inflation rate is calculated as the annual rate of the change in the GDP deflator averaged over 1990–1999. The World Bank World Development Indicators database 2003 was used to construct all these country control variables.
For banking structure indicators, we rely on the data set recently constructed by Demirguc-Kunt et al. (in press), which covers more than 70 countries. Banking concentration is measured by the fraction of assets held by the three largest commercial banks in each country averaged over the period 1995–1999. For robustness, we also use the fraction of assets held by the five largest commercial banks in each country. In addition to these measures of concentration, we construct indicators for specialization and competition. These indicators are used to test whether specialization and competition follow a different pattern between high-income and low-income countries and to separate the effect of specialization from the effect of competition. We use the net interest margin (NET) as an indicator of competition defined as interest income minus interest expense divided by interest-bearing assets averaged over the period 1995–1999. It measures the gap between what the bank pays for depositors and what the bank gets from users of bank credit. Other things held equal, the higher the net interest margin, the lower is the degree of competition. The measures of specialization used is banks per capita (BANKPOP), measured by the number of banks per 100,000 people. In a small country with a large number of banks, the banks can serve quite a small population and thus be quite specialized relative to a large country with a small number of banks, each serving large populations.
The data set also allows us to construct a wide list of instrumental variables. We select two sets of instrumental variables to proxy for the country's regulatory and institutional environment. The first set consists of regulatory and policy variables that directly affect the structure of banking system. The first variable within this set is financial activity restrictions. This measures bank's ability to engage in lending, the businesses of underwriting, insurance, and real estate. Such regulatory restrictions are likely to affect the structure of the banking industry, especially the degree of competition within the national banking system as these restrictions insulate banks from competition from other financial players. As another instrument, we also use the number of entry applications denied as a fraction of the number of applications received from domestic and foreign entities. This influences the entry barriers into the banking industry affecting the degree of both competition and concentration in the banking industry. Within the regulatory environment set, we also use a measure of banking freedom, which is an indicator of relative openness of banking and financial system. The ability of foreign banks and financial services firms to operate freely, the difficulty to open domestic banks and other financial services firms, the regulation of the financial system, the presence of state-owned banks, and the ability of banks to freely provide customers with a wide list of financial instruments influence the structure of the banking industry. In addition to regulatory factors, various studies have suggested that institutional factors such as protection of property rights and legal origin also influence the structure and level of development of the banking industry level. In this study, we use an indicator of the protection of private property rights to proxy for the institutional environment. A detailed description of all the instruments and variables is given in Table 3.
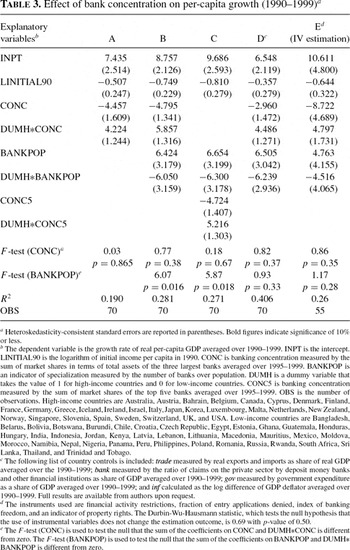
Empirical results
Column A in Table 3 reports the regression results for the basic specification which includes initial income per capita to control for the convergence effect across countries, bank concentration, and the banking concentration interactive term (DUMH*CONC). As can be seen from column A, the coefficient on the interactive term is highly significant, indicating that the coefficient on banking concentration is different across high-income and low-income countries. Specifically, in this regression, concentration enters with a significantly negative and large coefficient in low-income countries. For the high-income group, on the other hand, the coefficient on banking concentration is statistically insignificant at the conventional levels.
In column B, a measure of bank specialization (BANKPOP) is introduced to the basic regression model. As with the measure of concentration, we interact (BANKPOP) with a dummy variable that takes the value of 1 for high-income countries and 0 for low-income countries (DUMH*BANKPOP). The regression results, reported in column B, are quite interesting. As before, the coefficient on the interactive term DUMH*CONC is highly significant, indicating that the impact of banking concentration is different across high-income and low-income countries with a significant negative relationship between concentration and growth only in the group of low-income countries. Interestingly, the coefficient on the interactive term DUMH*BANKPOP is also highly significant, indicating that the impact of specialization on growth is different across high-income and low-income countries. Specifically, our specialization indicator enters with a significantly large positive coefficient for low-income countries. On the other hand, though significant, the coefficient on the specialization indicator is very small for high-income countries. One interpretation of these results consistent with our theoretical model is that in high-income countries, there are a large number of banks that are already highly specialized, and thus efficiency gains from further specialization are likely to be comparatively lower. This is in contrast with the low-income group, where there is likely to be only a few banks that are not well specialized, and thus efficiency gains from further specialization are likely to be very large for this group of countries.
In column C, we use an alternative measure of concentration based on the fraction of assets held by the five largest commercial banks in each country (CONC5). The results do not change significantly using this alternative definition of concentration.
In column D, we include the full set of country control variables (BANK, TRADE, GOV, INF) to control for other potential determinants for growth. The empirical results are highly robust to the inclusion of a wide list of country control variables, with the impact of concentration and specialization following the same patterns as those obtained previously.
Finally, in column E, we report the IV regression results using the set of regulatory and institutional variables as instruments for banking concentration. The IV results are similar to those of OLS, where the impact of banking concentration is negative only in low-income countries, whereas the coefficient on banking concentration for high-income countries is not statistically significant.
Next, for indicators of concentration we substitute indicators of competition. Specifically, in the basic specification we include initial income per capita, net interest margin as an indicator of competition, and an interactive term between net interest margin and DUMH (DUMH*NET). If banking concentration is associated with lower competition, as our model suggests, then the impact of net interest margin on growth should be similar to that of banking concentration. Table 4 shows that this is the case indeed. In all the specifications used, we find that the net interest margin enters with a significantly negative and large coefficient for low-income countries, whereas the coefficient on net interest margin is not significant for the high-income group. These results indicate that lack of competition is likely to have a much more adverse impact on growth in low-income countries. Interstingly, the results concerning specialization in column B do not change from those in Table 3, where the interactive term DUMH*BANKPOP is highly significant in all specifications, indicating that the impact of specialization on growth is different across high-income and low-income countries with that impact being much larger in low-income countries. In column C, we include the full set of country control variables to control for other potential determinants for growth. The empirical results are highly robust to the inclusion of a wide list of country control variables. Finally, in column D, we report the IV regression results.