Introduction
To date, approximately 20 000 lichen species have been recognized, but this number probably grossly underestimates their real diversity (Lumbsch et al. Reference Lumbsch, Ahti, Altermann, Amo de Paz, Aptroot, Arup, Bárcenas Peña, Bawingan, Benatti and Betancourt2011; Lücking et al. Reference Lücking, Dal-Forno, Sikaroodi, Gillevet, Bungartz, Moncada, Yánez-Ayabaca, Chaves, Coca and Lawrey2014). One major problem in detecting and describing lichen diversity has always been the identification of consistent diagnostic characters. Since differences in anatomical and morphological characters might be very subtle and subject to extreme morphological plasticity (Pintado et al. Reference Pintado, Valladares and Sancho1997; Pino-Bodas et al. Reference Pino-Bodas, Burgaz, Martin and Lumbsch2011; Pérez-Ortega et al. Reference Pérez-Ortega, Fernández-Mendoza, Raggio, Vivas, Ascaso, Sancho, Printzen and de los Ríos2012; Muggia et al. Reference Muggia, Pérez-Ortega, Fryday, Spribille and Grube2013), lichenologists are continually trying to widen the scope of taxonomically useful characters.
Ever since Nylander introduced simple spot tests to detect secondary metabolites, lichen systematics has also relied on chemical characters (Nylander Reference Nylander1866; see also reviews by Lumbsch Reference Lumbsch1998; Printzen Reference Printzen2010). At higher systematic levels, the widespread occurrence and consequent homoplasy of most secondary metabolites usually limits their usefulness (but see e.g. Schmitt & Lumbsch Reference Schmitt and Lumbsch2004; Lumbsch et al. Reference Lumbsch, Schmitt, Barker and Pagel2006). At lower taxonomic levels, their value as distinctive phenotypic characters has also been questioned (Velmala et al. Reference Velmala, Myllys, Halonen, Goward and Ahti2009; Leavitt et al. Reference Leavitt, Johnson and St. Clair2011; Pino-Bodas et al. Reference Pino-Bodas, Burgaz, Martin and Lumbsch2011). Depending on the magnitude of the difference (e.g. substitution of biochemically related metabolites, chemosyndromic variation), some authors have either attributed specific (e.g. Culberson Reference Culberson1967), subspecific (e.g. Lumbsch et al. Reference Lumbsch, Feige and Elix1994) or varietal rank (e.g. Skult Reference Skult1993) to chemical variants, while others avoided taxonomic conclusions altogether by treating them as chemotypes of the same species (e.g. Knoph et al. Reference Knoph, Schmidt and Elix1995). Recently, DNA sequence data have become an important additional tool to study the diversity, evolution and species delimitation of lichens (e.g. Hibbett et al. Reference Hibbett, Binder, Bischoff, Blackwell, Cannon, Eriksson, Huhndorf, James, Kirk and Lücking2007; Schoch et al. Reference Schoch, Sung, Lopez-Giraldez, Townsend, Miadlikowska, Hofstetter, Robbertse, Matheny, Kauff and Wang2009; Crespo & Lumbsch Reference Crespo and Lumbsch2010; Wirtz et al. Reference Wirtz, Printzen and Lumbsch2012). This not only raised hopes that single gene sequences could be used to identify existing and detect new lichen taxa (Hebert et al. Reference Hebert, Cywinska, Ball and deWaard2003; Kelly et al. Reference Kelly, Hollingsworth, Coppins, Ellis, Harrold, Tosh and Yahr2011; Lumbsch & Leavitt Reference Lumbsch and Leavitt2011), it also offered the opportunity to test existing species concepts. Most studies mapped characters on phylogenetic trees from DNA sequence data (e.g. Lohtander et al. Reference Lohtander, Myllys, Källersjö, Moberg, Stenroos and Tehler2009) and often found chemically uniform monophyletic groups of samples that were recognized as separate taxa (Kroken & Taylor Reference Kroken and Taylor2001; Tehler & Källersjö Reference Tehler and Källersjö2001; Elix et al. Reference Elix, Corush and Lumbsch2009). Concurrently, some studies based on population genetic datasets demonstrated considerable infraspecific genetic variability in lichens (Zoller et al. Reference Zoller, Lutzoni and Scheidegger1999; Printzen et al. Reference Printzen, Ekman and Tonsberg2003; Palice & Printzen Reference Palice and Printzen2004; Werth & Sork Reference Werth and Sork2008; Spribille et al. Reference Spribille, Klug and Mayrhofer2011). Some authors ascribed this high variability to the presence of cryptic lichen species (Divakar et al. Reference Divakar, Crespo, Blanco and Lumbsch2006; Crespo & Pérez-Ortega Reference Crespo and Pérez-Ortega2009; Crespo & Lumbsch Reference Crespo and Lumbsch2010; Leavitt et al. Reference Leavitt, Johnson and St. Clair2011; Parnmen et al. Reference Parnmen, Rangsiruji, Mongkolsuk and Boonpragob2011) with the potential danger that infraspecific lineages might be misinterpreted as separate species. However, there is an alternative danger of failing to recognize species-level lineages. Lichens appear to retain ancestral polymorphisms (Printzen et al. Reference Printzen, Ekman and Tonsberg2003, Fernández-Mendoza & Printzen Reference Fernández-Mendoza and Printzen2013). Unsorted polymorphisms between sibling taxa cause gene trees to deviate from the true species tree. In this case, chemically distinct lineages could appear para- or polyphyletic on phylogenetic trees and might be overlooked.
The interpretation of chemical patterns with the background of molecular genetic data is a complex issue. If variation of chemical characters has a genetic basis, it could be associated with 1) phylogenetic groups, 2) groups of individuals sharing a genealogical history and 3) certain genotypes that would not necessarily form monophyletic groups on phylogenetic trees. Alternatively, the production of certain secondary metabolites could be triggered by ecological factors or, in the case of lichens, features of the symbiotic lifestyle, such as association with certain photobiont or bacterial symbionts (Nützmann et al. Reference Nützmann, Reyes-Dominguez, Scherlach, Schroeckh, Horn, Gacek, Schümann, Hertweck, Strauss and Brakhage2011). In this latter case, no association with the genetically defined groups 1–3 would be observed. However, populations that occur along the same ecological gradient might demonstrate some commonality in the expression of secondary metabolites. In this case, clear genetic groupings might not automatically be evidence for a genetic basis for chemical differences.
In this study we use Cetraria aculeata and associated species as a model to test if there is a relationship between norstictic acid production and genetic groupings. We investigate whether the presence of norstictic acid can serve as a diagnostic character for the separation of genetic lineages that have been treated as two different taxa: C. aculeata (Schreb.) Fr. and C. steppae Savicz. Previous studies on this group have only considered morphological and ecological differences in relation to chemical variability (Nadyeina et al. Reference Nadyeina, Lutsak, Blum, Grakhov and Scheidegger2013). The C. aculeata group is particularly well suited as a model group for this kind of study because it is widely distributed along a broad ecological gradient and its population genetics has been studied intensively in recent years (Fernández-Mendoza et al. Reference Fernández-Mendoza, Domaschke, García, Jordan, Martin and Printzen2011; Domaschke et al. Reference Domaschke, Fernández-Mendoza, García, Martín and Printzen2012; Pérez-Ortega et al. Reference Pérez-Ortega, Fernández-Mendoza, Raggio, Vivas, Ascaso, Sancho, Printzen and de los Ríos2012; Fernández-Mendoza & Printzen Reference Fernández-Mendoza and Printzen2013; Nadyeina et al. Reference Nadyeina, Lutsak, Blum, Grakhov and Scheidegger2013; Printzen et al. Reference Printzen, Domaschke, Fernández-Mendoza and Pérez-Ortega2013; Lutsak et al. Reference Lutsak, Fernández-Mendoza, Kirika, Wondafrash and Printzen2015).
Cetraria aculeata is a dark brown fruticose soil lichen that forms shrubby tufts 1–5 cm high (Kärnefelt Reference Kärnefelt1986). It is rarely found fertile, and seems to propagate mainly by thallus fragmentation (Heinken Reference Heinken1999). This species is frequent in open polar and boreal environments from the high Arctic southwards to the maritime Antarctic. At intermediate latitudes it is mostly found in high mountain ecosystems, but its distributional range also extends into forest gaps, woodland and steppe ecosystems, or coastal and riparian sand deposits of the Mediterranean and temperate zones.
The delimitation of C. aculeata from the rather similar C. steppae has always been challenging. Cetraria steppae was first described as a morph of C. aculeata occurring in steppes and short grass habitats of Ukraine, Russia and Kazakhstan (Mereschkowsky Reference Mereschkowsky1921; Savicz Reference Savicz1924). More recently, the presence of norstictic acid in the thallus of C. steppae has been regarded as a crucial character for its delimitation from C. aculeata (Kärnefelt Reference Kärnefelt1986; Randlane & Saag Reference Randlane and Saag2006). In a recent study of Ukrainian populations, Nadyeina et al. (Reference Nadyeina, Lutsak, Blum, Grakhov and Scheidegger2013) showed that concentrations of norstictic acid found in individual thalli vary considerably among populations. They observed that the presence of norstictic acid depends on the size of the thallus and concluded that chemical and morphological differences between thalli represent ontogenetic rather than fixed phenotypic differences, and thus should not be considered for taxonomic purposes. Consequently, they suggested that C. steppae is conspecific with C. aculeata, which was essentially assumed in recent population genetic studies on C. aculeata (Fernández-Mendoza et al. Reference Fernández-Mendoza, Domaschke, García, Jordan, Martin and Printzen2011; Fernández-Mendoza & Printzen Reference Fernández-Mendoza and Printzen2013). Cetraria muricata, a third species from the group, differs slightly from C. aculeata in morphological features, such as narrower, more evenly rounded branches and more scattered, rounded and superficial pseudocyphellae, but both species may be difficult to distinguish in the field (Poelt Reference Poelt1969; Kärnefelt Reference Kärnefelt1986). Norstictic acid has never been reported from C. muricata. According to phylogenetic reconstructions, it appears as a sister clade to C. aculeata and its status as a separate species has usually not been doubted (Thell et al. Reference Thell, Stenroos, Feuerer, Kärnefelt, Myllys and Hyvönen2002, Reference Thell, Högnabba, Elix, Feuerer, Kärnefelt, Myllys, Randlane, Saag, Stenroos and Ahti2009; Printzen et al. Reference Printzen, Domaschke, Fernández-Mendoza and Pérez-Ortega2013).
In this study we use a broad sample of lichens from the C. aculeata group across Western Eurasia, and phylogenetic and population genetic methods to investigate whether norstictic acid production reflects evolutionary history or whether the presence of norstictic acid is correlated with genetic differences between individuals and populations of lichens.
Material and Methods
Sampling
A total of 594 specimens morphologically and chemically identified as Cetraria aculeata (435), C. muricata (61) and C. steppae (98) from 54 sampling localities were used for this study (Table 1). Specimens regarded as C. muricata were included in the dataset to test whether the production of norstictic acid is restricted to C. aculeata/steppae. Sampling covers a wide latitudinal and longitudinal gradient from Svalbard in the north to the Canary Islands in the south, and Greenland in the west to the Russian part of the Altai Mountains in the east. Species of the C. aculeata group disperse mostly by thallus fragmentation, consequently lichen thalli were sampled at intervals with a minimum distance of 0·5 m between samples within each population to avoid collecting clonal offspring. All specimens collected in one locality were considered as one population and were given names that refer to the collection localities.
Table 1 Collection data for Cetraria aculeata, C. muricata and C. steppae from the 54 sampling localities used in this study

nst+ =number of individuals with detectable amounts of norstictic acid in each sampling locality; N=total number of specimens from each country; n=number of specimens per locality.
DNA extraction and sequencing
Single branches of an average dry mass of 2 mg were cut off the thallus, cleaned from all visible contaminants, frozen in liquid nitrogen and ground manually. Total genomic DNA was extracted using the DNeasy™ Plant Mini Kit (Qiagen) following the manufacturer’s protocol or the PrepEase DNA Isolation Kit (USB, Cleveland, Ohio, USA) using the plant leaf extraction protocol. As in previous studies, three fungal genetic markers were used: the internal transcribed spacer region of the nuclear ribosomal DNA (ITS), a partial sequence of the large subunit of the mitochondrial ribosomal DNA (mtLSU) and a fragment of the glyceraldehyde-3-phosphate dehydrogenase (GPD) gene. Amplification, purification and sequencing were performed following Fernández-Mendoza et al. (Reference Fernández-Mendoza, Domaschke, García, Jordan, Martin and Printzen2011). Sequences were assembled, aligned and alignments manually refined using Geneious v.7.1.4 (Drummond et al. Reference Drummond, Ashton, Buxton, Cheung and Cooper2013). Sequences of each unique haplotype were deposited in GenBank (Accession numbers provided in Appendix I) and all alignments were submitted to the TreeBASE database under submission number 18951.
Chemistry
The secondary metabolite content of all samples was tested with TLC and HPLC using different thallus lobes. In a few cases we observed that HPLC could not detect norstictic acid, while TLC showed a clear spot. More rarely the opposite pattern was observed. In order to avoid false negatives we extracted secondary compounds from 2–3 branches (20 mg) for all further TLC analyses. Lichen compounds were extracted in 0·4 ml of acetone and run using the standard solvent system C (one volume of acetic acid in five volumes of toluene) following Orange et al. (Reference Orange, James and White2001). For 311 samples HPLC was used to double-check for the presence of secondary metabolites undetected by TLC. HPLC analyses were carried out using the Agilent 1260 Infinity System and the method described by Feige et al. (Reference Feige, Lumbsch, Huneck and Elix1993) on 1–6 mg of dry tissue. TLC proved to be the more reliable method as it detected norstictic acid in all samples that were positive in HPLC, and in some where HPLC failed to detect this substance.
Inference of admixture clusters
In order to reveal genetic clusters within the three loci sequence dataset, admixture fractions were inferred with STRUCTURE v.2.3.4 (Pritchard et al. Reference Pritchard, Stephens and Donnelly2000; Falush et al. Reference Falush, Stephens and Pritchard2003) using these three loci and counting different haplotypes as alleles per locus (Fernández-Mendoza & Printzen Reference Fernández-Mendoza and Printzen2013). To estimate the optimum number of admixture clusters we used the summary likelihood statistics ΔK proposed by Evanno et al. (Reference Evanno, Regnaut and Goudet2005). The analyses were based on ten serial runs for each number of clusters (K) between one and ten. Admixture models used a uniform alpha prior, independent allele frequencies and no prior population information. All analyses were run for 5×10⁵ generations after a burn-in period of 2·5×105 iterations. Using longer runs did not improve likelihood estimates or clustering solutions. The results were evaluated using a custom R script. Clustering solutions were summarized using CLUMPP (Jakobsson & Rosenberg Reference Jakobsson and Rosenberg2007) and are presented as clustergrams in Fig. 1. Average admixture proportions per locality were mapped (Fig. 2) using R packages rworldmaps (South Reference South2011) and mapplots (Gerritsen Reference Gerritsen2012), and later manually refined in Adobe Illustrator CS5.
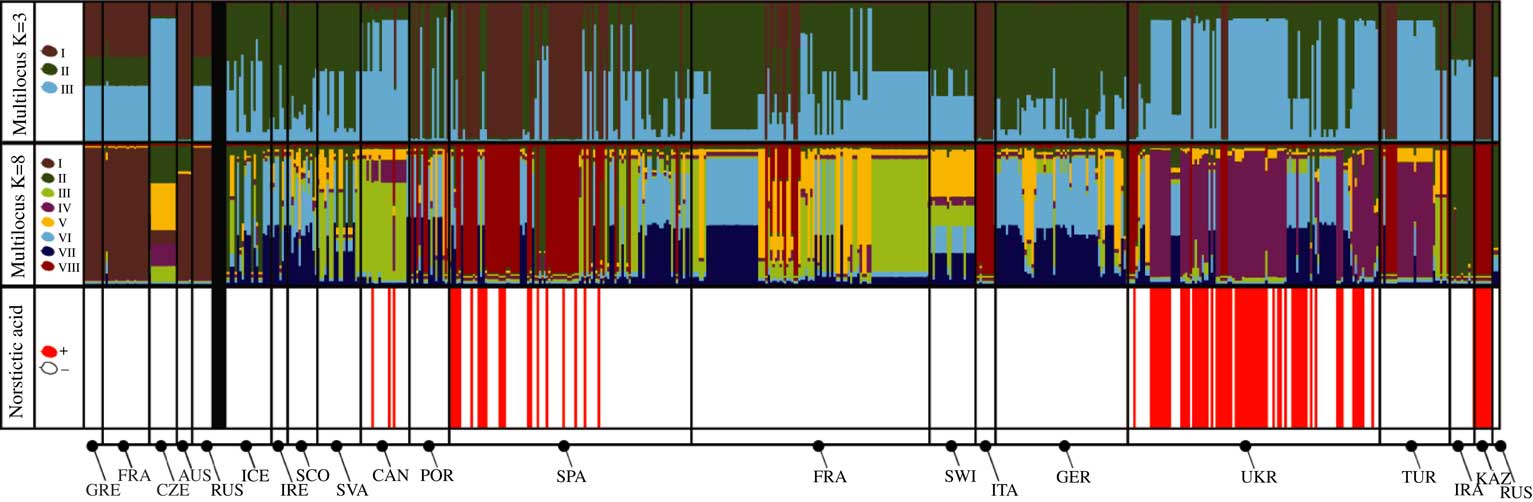
Fig. 1 Assignment of individuals to genetic clusters inferred from the datasets of three fungal loci using Structure. Each multicoloured bar represents an individual, the height of each colour corresponds to the estimated probability of the individual belonging to the respective genetic cluster (indicated by the colour legend and roman numerals on the left). K=3 and K=8 refer to the two clustering solutions. Populations are sorted geographically and arranged by country (see Table 1 for abbreviations), black vertical lines separate populations from different countries. The bold black vertical line separates the specimens identified as Cetraria muricata (on the left) from those of C. aculeata and C. steppae (on the right).

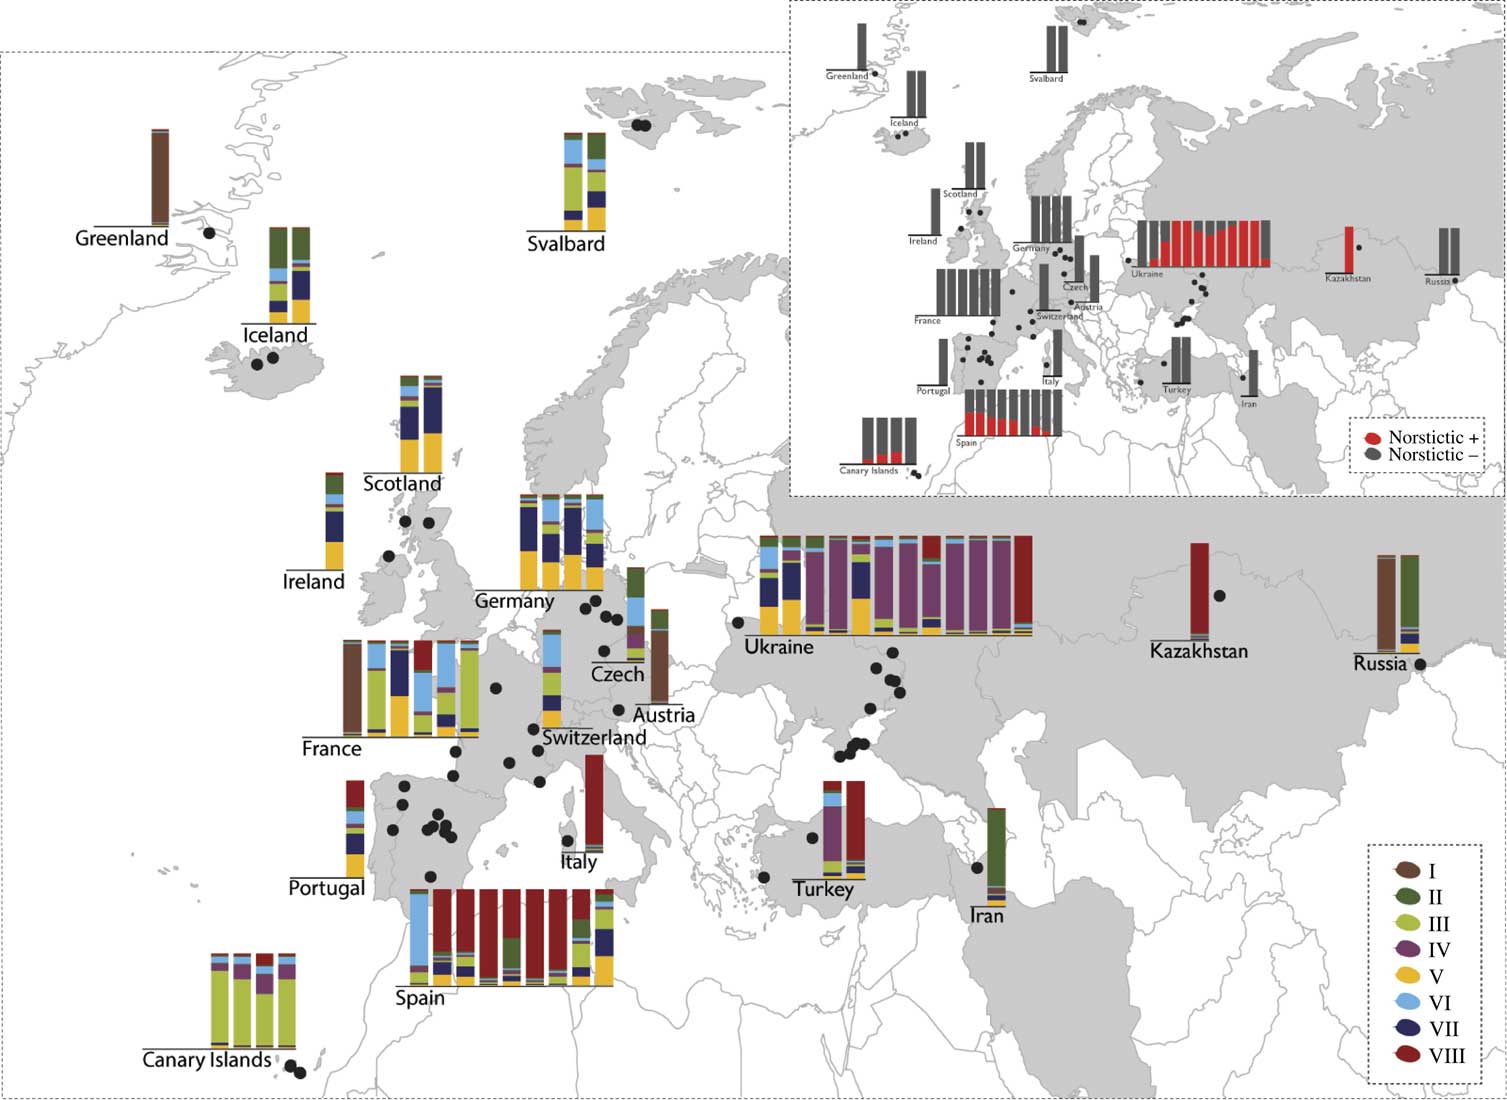
Fig. 2 Multilocus genetic clusters assessed with Structure per population together with their geographical distribution. Each bar plot represents a single population from the respective country; populations within countries are sorted from west to east. The height of each colour reflects the proportion of genetic clusters assignment. The inset shows the proportion of individuals with norstictic acid for each locality.
Phylogenetic trees
Phylogenetic reconstructions were carried out for each locus independently using the Bayesian method implemented in BEAST v.1.8.1 (Drummond et al. Reference Drummond, Suchard, Xie and Rambaut2012). For each locus datasets were collapsed to haplotypes. If members of the same haplotype differed in the content of norstictic acid, one individual with and one without norstictic acid were kept in the dataset (those are terminal nodes of the trees). The suitability of alternative nucleotide substitution models was approximated using jModelTest v.2 (Posada Reference Posada2008); optimum models were chosen under a corrected Akaike information criterion (cAIC). The appropriateness of molecular clock models was tested in MEGA 5 (Tamura et al. Reference Tamura, Peterson, Peterson, Stecher, Nei and Kumar2011). We used a strict clock for GPD and mtLSU, but an exponential relaxed clock for ITS. Information about the final datasets and the selected models is summarized in Table 2. Two independent runs of 55 M generations sampling every 5000th tree were run for each locus. After convergence was checked in Tracer v.1.6.1 both runs were pooled using Logcombiner v.1.8.2 (Drummond et al. Reference Drummond, Suchard, Xie and Rambaut2012). An 18% burn-in fraction was removed from the sample. Posterior tree distributions were summarized in maximum clade credibility trees also displaying the median of branch lengths at each node (Fig. 3).

Fig. 3 Maximum clade credibility trees for the gene loci used in this study of the Cetraria aculeata group. Terminal nodes do not directly refer to haplotype numbers because several haplotypes are represented twice (once for each chemotype). Branches in bold received ≥0·95 posterior probability support. *=terminal nodes with norstictic acid
Table 2 Summary statistics, PCR settings and optimum substitution models for the three gene loci used in this study

Correlation of norstictic acid content with genetic structure
We tested the association between norstictic acid expression and the percentage of assignment to admixture clusters by means of a Welch’s t-test, as implemented in the Base package of R. To avoid pseudoreplication, the dataset was collapsed to unique combinations of multilocus genotypes and norstictic acid phenotypes (see above). Graphical and statistical summaries of these tests are shown in Fig. 4. In order to test the phylogenetic signal in the expression of norstictic acid we used the D statistic developed by Fritz & Purvis (Reference Fritz and Purvis2010), implemented by the authors in function phylo.d of R package caper. We made a recursive use of this function to account for phylogenetic uncertainty in which the D statistic was calculated on a subsample of 1000 trees from the posterior tree distribution for each locus and processed to obtain average D-estimates and 95% confidence intervals (Table 3).

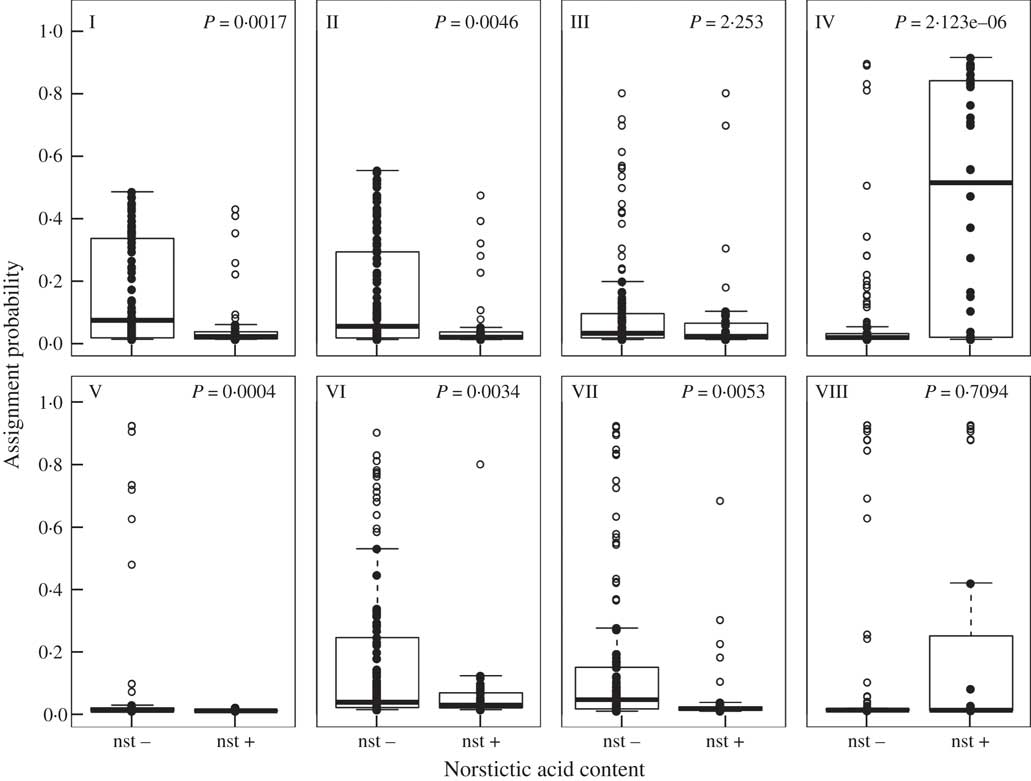
Fig. 4 Boxplots and summary of Welch’s t-tests showing association between the inferred admixture clusters and the presence and absence of norstictic acid. The y-axis indicates the assignment probability of individuals to that admixture cluster. The bold line indicates the median; the box, the upper and lower quartile and whiskers extend to 1·5 times the interquartile range. Raw data points are denoted by filled black circles and those considered to be outliers by open black circles. P values are shown where the difference between presence and absence of norstictic acid was statistically significant.
Table 3 D-estimates and 95% confidence intervals for the ITS, GPD and mtLSU loci used in this study of the Cetraria aculeata group

The D value is a measure of phylogenetic signal in a binary trait, resulting from both random association and the clumping expected under a Brownian evolution threshold model. The value of D can be both smaller than 0 (highly conserved) and greater than 1 (overdispersed).
Results
Datasets
A total of 1782 gene sequences were used for this study, of which 1320 were newly generated, and 462 generated during previous studies (Fernández-Mendoza et al. Reference Fernández-Mendoza, Domaschke, García, Jordan, Martin and Printzen2011; Fernández-Mendoza & Printzen Reference Fernández-Mendoza and Printzen2013). Information on aspects of the datasets is summarized in Table 2. Nucleotide diversity for the three markers ranged between 0·006 (mtLSU) and 0·016 (ITS), and haplotype richness varied from 19 (mtLSU, plus 4 haplotypes of C. muricata) to 68 (ITS, plus 12 haplotypes of C. muricata).
Geographical structure of norstictic acid production
Norstictic acid was detected in 98 out of 594 samples and exclusively in specimens identified as C. aculeata/steppae, and never in C. muricata from the temperate regions of the broader Mediterranean (populations from Spain, Canary Islands, Ukraine) and Central Asia (Kazakhstan, Figs 1 & 2). As observed previously (Nadyeina et al. Reference Nadyeina, Lutsak, Blum, Grakhov and Scheidegger2013), specimens with and without norstictic acid were often found within the same populations. There were a few populations in Kazakhstan and Ukraine (Arabat, Kerch, Novoplatonivka, Trehizbenska) in which all individuals studied (3–8) contained norstictic acid. The population from Kazakhstan and one Ukrainian population (Arabat) turned out to be genetically homogeneous, with all samples belonging to the same single gene haplotypes. All the other populations were genetically heterogeneous.
Inference of multilocus clusters
Using the ΔK criterion of Evanno et al. (Reference Evanno, Regnaut and Goudet2005) we estimated two clustering solutions to be optimal for the three-gene dataset: with three and eight admixture clusters. The model with three clusters meant a steep increase in likelihood from the models with one and two populations, but did not render a reasonable clustering solution, especially regarding the specimens identified as C. muricata, which were misleadingly assigned equally to each of the clusters (multilocus K=3, Fig. 1). Moreover, Mediterranean and Central Asian specimens are assigned to two different clusters that do not correlate with geographical location. For example, individuals from the Canary Islands are lumped together with most from Ukraine, and about half the specimens from Spain with those from Kazakhstan. For this reason, we preferred the maximum likelihood model with eight populations (Fig. 1), which also provided a clustering solution more compatible with our previous estimate (Fernández-Mendoza & Printzen Reference Fernández-Mendoza and Printzen2013). The K=8 model assigned all specimens of C. muricata to admixture cluster I, with the exception of the Czech population that could not be assigned to any of the clusters with certainty.
Correlation of norstictic acid production with genetic structure
The map (Fig. 2) shows a geographical pattern in the distribution of norstictic acid across the study area. This pattern largely coincides with the distribution of C. steppae, which Kärnefelt (Reference Kärnefelt1986) reported from Ukraine and Central Asia, and Crespo & Barreno (Reference Crespo and Barreno1978) from Spain. While the association between the norstictic acid chemotypes and multilocus clusters is generally weak, norstictic acid-containing specimens tended to be assigned to admixture cluster IV, and to a lesser extent cluster VIII. The Welch’s t-test showed that only the association of norstictic acid chemotypes with cluster IV was statistically supported (Fig. 4). More than 50% of this cluster’s samples were from Ukraine. The association with cluster VIII, containing specimens from Spain, Kazakhstan and Ukraine, was not significant. Statistical tests coupled with the D statistic showed a lack of phylogenetic signal in the expression of norstictic acid across the phylogenies studied (Table 3, Fig. 3).
Discussion
Since the 19th century, secondary metabolites have played an important role in delimiting lichen species. However, the question of whether chemical variants should be acknowledged taxonomic ranks, and if so at which levels, has never really abated (Lumbsch & Leavitt Reference Lumbsch and Leavitt2011). In the absence of genetic data and evidence from crossing experiments, lichenologists had to rely on indirect evidence to infer the taxonomic value of chemical characters that were not clearly associated with morphological traits. In such cases the presence of separate lineages was sometimes inferred based on differences in distributional ranges, as for example in Cetraria ciliaris (Hale Reference Hale1963; Culberson & Culberson Reference Culberson and Culberson1976; Brodo Reference Brodo1984). Phylogenetic trees based on molecular data facilitate the detection of evolutionary lineages. However, due to incomplete lineage sorting, hybridization or horizontal gene transfer, gene trees do not necessarily resemble the species phylogeny. At the level of sibling species, phylogenetic methods may therefore not be the most powerful analytical tools. And so, in this paper we attempted to assess the association between a chemical character (production of norstictic acid) and genetic groups from the population level to the level of phylogenetic lineages (admixture clusters and gene phylogenies).
One unambiguous result of our analyses is the finding that norstictic acid was detected exclusively in specimens identified as C. aculeata/steppae and never in C. muricata. Within C. aculeata/steppae, however, no clear phylogenetic pattern in the occurrence of norstictic acid was detected in any of the phylogenies. Instead, statistical tests support the idea of random occurrence of the trait across phylogenetic trees. Several recent studies have reported a similar picture with chemically different individuals appearing non-monophyletic on gene trees (Articus et al. Reference Articus, Mattsson, Tibell, Grube and Wedin2002; Myllys et al. Reference Myllys, Högnabba, Lohtander, Thell, Stenroos and Hyvönen2005; Nelsen & Gargas Reference Nelsen and Gargas2008, Reference Nelsen and Gargas2009; Lendemer et al. Reference Lendemer, Allen and Noell2015). These authors concluded that chemotypes did not represent different evolutionary lineages. Reports of unsorted ancestral polymorphism in closely related lichens (Printzen et al. Reference Printzen, Ekman and Tonsberg2003; Wirtz et al. Reference Wirtz, Printzen and Lumbsch2012), however, show that evolutionary lineages are not necessarily identical to monophyletic groups on trees.
Using niche modelling, Lendemer et al. (Reference Lendemer, Allen and Noell2015) showed that chemotypes of Parmotrema subrigidum with norstictic acid restricted to Florida occupied a different ecological niche than the genetically similar acid-deficient strain that is also found further north. Our dataset on Cetraria aculeata displays a very similar pattern in that norstictic acid was detected only in the southern part of the study area. In contrast to Lendemer et al. (Reference Lendemer, Allen and Noell2015), we observed a significant correlation of norstictic acid production with certain genetic groups, namely admixture clusters IV and VIII. However, these two groups are almost totally restricted to the Mediterranean and Central Asian range of C. aculeata/steppae. More than 50% of the samples from admixture cluster IV are from Ukraine; cluster VIII is restricted to Spain, France, Italy, Kazakhstan, Ukraine and Turkey. Hence, genetic and geographical structure co-vary in our dataset, and it remains unclear with which of these variables norstictic acid is actually correlated. The frequently observed disjunct or only partly overlapping ranges of lichen chemotypes leave room for various interpretations (e. g. Hale Reference Hale1956; Culberson et al. Reference Culberson, Culberson and Johnson1977; Sheard Reference Sheard1977; Lumbsch et al. Reference Lumbsch, Feige and Elix1994; Lendemer et al. Reference Lendemer, Allen and Noell2015). Sometimes, but not always, differences in distribution were interpreted as supporting evidence for the presence of different taxa. For example, Lumbsch et al. (Reference Lumbsch, Feige and Elix1994) treated the three morphologically indistinguishable chemotypes of Lecanora epibryon as subspecies. Chemical differences were also regarded as sufficient to distinguish species within the Parmotrema perforatum group (Lendemer et al. Reference Lendemer, Allen and Noell2015), whereas several chemotypes from the Ramalina siliquosa group displaying slightly different distributional ranges (Culberson et al. Reference Culberson, Culberson and Johnson1977) are not acknowledged at taxonomic rank (Fletcher et al. Reference Fletcher, James and Purvis2009).
The production of certain secondary metabolites has also been connected with ecological factors such as light and moisture regime, metal content, pH and the substratum preferences of lichens (Nash & Zavada Reference Nash and Zavada1977; Armaleo et al. Reference Armaleo, Zhang and Cheung2008; Hauck et al. Reference Hauck, Jurgens and Leuschner2010). Those ecological factors that were studied in C. aculeata (altitude above sea level, bioclimatic zone, habitat and substratum type) showed no correlation with the production of norstictic acid (Nadyeina et al. Reference Nadyeina, Lutsak, Blum, Grakhov and Scheidegger2013). Whether pH or metal content of substrata triggers the expression of norstictic acid is at least doubtful. Most populations studied by Nadyeina et al. (Reference Nadyeina, Lutsak, Blum, Grakhov and Scheidegger2013) were sampled on small patches of a few hundred square metres at most. Yet only four localities in Ukraine and one in Kazakhstan were fixed for norstictic acid. In all other temperate populations chemotypes were either mixed or only the acid-deficient chemotype was found (Fig. 2). Armaleo et al. (Reference Armaleo, Zhang and Cheung2008) showed that the norstictic acid content of Parmotrema hypotropum is negatively correlated with annual light levels and concluded that higher moisture levels trigger the production of norstictic acid. Our finding that norstictic acid is produced only in southern populations of C. aculeata runs counter to this and shows that correlations found in one species cannot be automatically transferred to another. Likewise, Asplund & Gauslaa (Reference Asplund and Gauslaa2007) found a positive correlation between thallus size and total concentration of secondary metabolites, including norstictic acid, in Lobaria pulmonaria. Yet Nadyeina et al. (Reference Nadyeina, Lutsak, Blum, Grakhov and Scheidegger2013) observed the opposite in Ukrainian populations of C. aculeata, where norstictic acid was more frequently found in smaller individuals with wider branches. Schroeckh et al. (Reference Schroeckh, Scherlach, Nützmann, Shelest, Schmidt-Heck, Schuemann, Martin, Hertweck and Brakhage2009) found that the production of orsellinic acid in Aspergillus nidulans was triggered by the co-cultivation of certain Actinomycetes. Whether the symbiosis with certain bacteria is a trigger for the production of secondary metabolites in the C. aculeata group would be worth studying.
At present, we can only speculate why norstictic acid is produced exclusively in the Mediterranean and Central Asian part of the study area. Our results show that the distinction of Cetraria steppae at species level based on the production of norstictic acid, as postulated by Kärnefelt (Reference Kärnefelt1986), has no phylogenetic background. This is in line with the results from Nadyeina et al. (Reference Nadyeina, Lutsak, Blum, Grakhov and Scheidegger2013). We do not, however, fully agree with their conclusion that both names should be synonymized, as Savicz (Reference Savicz1924) distinguished C. steppae using morphological differences. Our data, and that from previous studies, show that the Mediterranean and Central Asian populations are genetically differentiated from others (Fernández-Mendoza et al. Reference Fernández-Mendoza, Domaschke, García, Jordan, Martin and Printzen2011; Fernández-Mendoza & Printzen Reference Fernández-Mendoza and Printzen2013) and might be interpreted as a separate evolutionary lineage. Genetic data with finer resolution is needed to assess whether this just reflects geographical structure within the wider species C. aculeata or whether gene flow between temperate populations and those in other regions is absent.
Conclusions
It was found that norstictic acid occurrence in lichens of the Cetraria aculeata group is associated with geographical, but not phylogenetic differences. The few positive associations of norstictic acid production with Mediterranean and Central Asian lineages at the population level probably reflect spatial genetic structure. We conclude that chemical differences observed in our dataset are most likely driven by the environment and do not delineate evolutionary lineages.
We are grateful to the staff of the Grunelius-Möllgaard Laboratory for Molecular Evolution, especially H. Kappes. Financial support from the Marga und Kurt Möllgaard-Stiftung, the Adolf Messer-Stiftung and the research funding programme LOEWE (Landes-Offensive zur Entwicklung wissenschaftlich-ökonomischer Exzellenz) of Hesse’s Ministry of Higher Education, Research and the Arts is also gratefully acknowledged. The work of TL is supported by a grant from the German Academic Exchange Service (DAAD).
Appendix 1 GenBank Accession numbers for all fungal multigene haplotypes of Cetraria aculeata s. lat. used in the study. One sample for each unique combination of the three single gene haplotypes (h) is listed