


Introduction
Habitat loss and degradation are amongst the major threats to biodiversity (Groom et al. Reference Groom, Meffe and Carroll2006). Along rivers, prevention of natural hazards, such as floods, and the spread of human disease, including malaria, have been used to justify major dam constructions and the replacement of dynamic floodplain forests with economically more valuable forests and agricultural land (Speich Reference Speich2002). Currently, floodplains are considered one of the most endangered ecological systems on Earth (Tockner & Stanford Reference Tockner and Stanford2002). However, human management has led to the formation of novel habitat types, such as traditionally managed agroforestry landscapes, that host specific communities not currently known to occur in natural environments (Rois-Diaz et al. Reference Rois-Diaz, Mosquera-Losada and Rigueiro-Rodriguez2006).
The epiphytic lichen-forming fungus Bactrospora dryina (Ach.) Massal. (Roccellaceae, Arthoniomycetes, Ascomycota) is an indicator of old-growth lowland forests, where its main threats are habitat loss and eutrophication due to the way in which forests or rivers are managed (Prigodina-Lukošienė & Naujalis Reference Prigodina-Lukošienė and Naujalis2009). It is a habitat specialist of forest stands with a high structural diversity and grows on trees older than 100 years, mainly on pedunculate oak, Quercus robur L. Bactrospora dryina forms large colonies up to several square metres in area on the rain-protected side of the host tree (Fig. 1A). The trunks of old oak trees that harbour colonies of B. dryina are often slightly inclined or have asymmetric canopy architectures with dead or broken main branches. Both characteristics lead to rain-exposed and rain-sheltered trunk sides which enable cryptogam communities with distinct water relations to develop. Furthermore, old oak trees develop a bark structure with deep crevices and ridges (Fig. 1B), providing distinct microhabitats in relation to light availability and stem water run-off. This strong differentiation into diverse microhabitats only on the trunk is present on trees older than 90 years (Ranius et al. Reference Ranius, Niklasson and Berg2009). Younger trees have more acidic, smooth bark which supports different epiphytic lichen communities that are strongly light dependent. Bactrospora dryina tolerates neither continuous bright light nor continuous shade; instead, it requires cycles of light availability that reflect particular natural or anthropogenic forest dynamics.
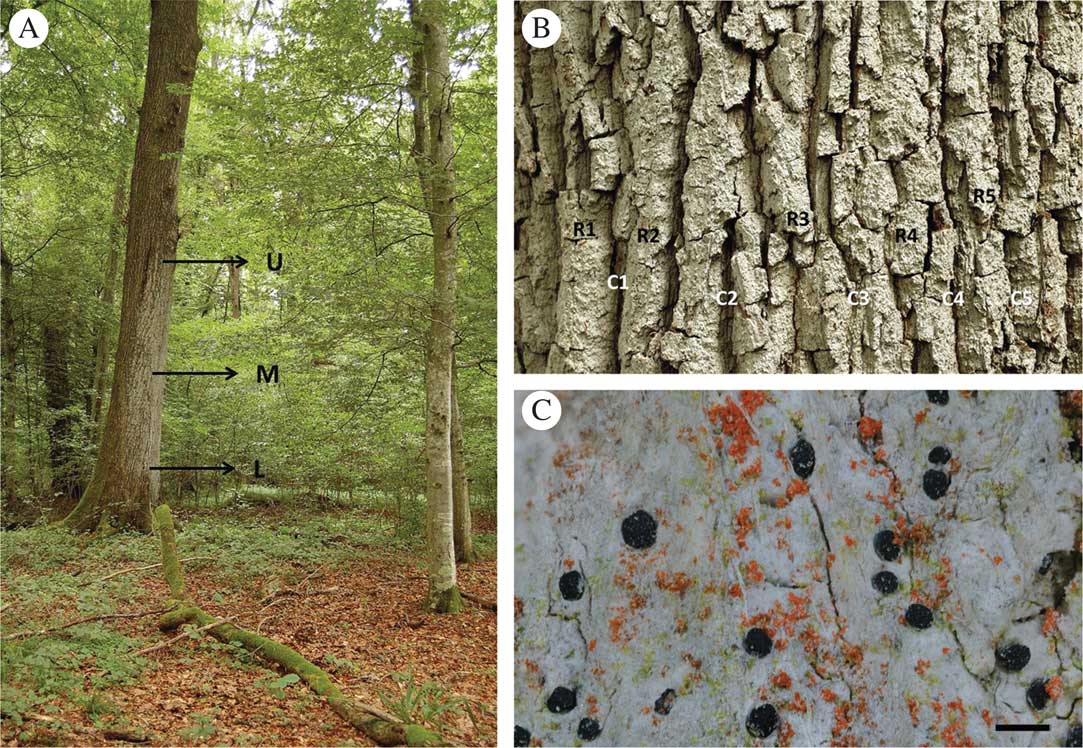
Fig. 1 A, Bactrospora dryina colony on the rain-protected side of an old pedunculate oak (Quercus robur) tree; letters indicate upper (U), middle (M) and lower (L) vertical levels of the ‘comprehensive’ sampling used in the study. B, thallus of B. dryina on the textured bark of oak; letters indicate one horizontal level in the ‘comprehensive’ sampling: R1–5=ridge numbers, C1–5=crevice numbers (two specimens were taken from each of the five ridges and crevices at each of the three vertical levels (U, M, L)). C, B. dryina thallus with fruiting bodies; trentepohlioid photobionts (greenish) and epiphytic free-living algae (orange) are visible. Scale=1 mm.
In Central Europe, B. dryina is rare and scattered in mesic, oak-dominated broadleaved forests with a diverse forest stand structure. Its natural habitats are largely limited to small numbers of localities situated in floodplain forests (Wirth et al. Reference Wirth, Hauck and Schultz2013; Scheidegger et al. Reference Scheidegger, Ziegler and Helbling2014) where flood dynamics, sediment translocations and ice drift have caused cyclic changes in light availability. Approximately decadal cycles of high light availability in forests is also characteristic of coppiced forests, where shoots regrow rapidly and form dense stands within 10–15 years before the next cycle of coppicing opens the canopy again. Old trees, which provide habitat for B. dryina, are generally lacking in coppiced forests. However, these forests were traditionally managed as coppice-with-standards where 10–30 mature, often oak, trees per hectare were retained as a source of construction wood, and other tree species, such as Carpinus betulus L. and Fraxinus excelsior L., were coppiced at regular intervals as a source of fencing material and firewood (Nyland Reference Nyland1996). This type of forest management was widespread in the European lowlands before the 20th century but has now largely disappeared for economic reasons. In Switzerland, the majority of localities where B. dryina is known to occur are remnant forest stands of coppice-with-standards and most of these are now protected and managed in order to maintain their structure and biodiversity characteristics (Pasinelli et al. Reference Pasinelli, Weggler and Mulhauser2008).
As a habitat specialist of such lowland forests, B. dryina has suffered a steep decline during the last century. It is now rare in Central and Eastern Europe, and threatened in most countries (Türk & Hafellner Reference Türk and Hafellner1999; Scheidegger et al. Reference Scheidegger, Groner, Keller and Stofer2002; Motiejünaite et al. Reference Motiejünaite, Czyzewska and Cieśliński2004; Cieśliński et al. Reference Cieśliński, Czyżewska and Fabiszewski2006; Wirth et al. Reference Wirth, Hauck, Brackel, Cezanne, De Bruyn, Dürhammer, Eichler, Gnüchtel, John and Litterski2011). The species reproduces with ascospores and/or conidia, and it associates with a green-algal, trentepohlioid photobiont (Egea & Torrente Reference Egea and Torrente1993; Fig. 1C). No vegetative, symbiotic propagules have been reported so far. The strong habitat specialization and the rarity of this species make it a good model for providing guidelines for conservation management in floodplain forests.
Conservation management aims to improve habitat quality and eliminate dispersal and migration barriers for habitat specialist species. A detailed understanding of dispersal properties, critical levels of genetic diversity and levels of genetic differentiation of populations among regions is crucial for conservation strategies (Naiman et al. Reference Naiman, Décamps and McClain2005). However, little is currently known about the dispersal traits of B. dryina within suitable habitats and across complex land- and riverscapes, or about its genetic diversity and regional genetic differentiation.
In lichen-forming fungi, symbiont-specific microsatellite markers facilitate the investigation of dispersal distances, recent colonization events at various spatial scales (Werth et al. 2006 Reference Werth, Wagner, Holderegger, Kalwij and Scheideggerb ), past population bottlenecks (Nadyeina et al. 2014 Reference Nadyeina, Dymytrova, Naumovych, Postoyalkin, Werth, Cheenacharoen and Scheideggerb ) and phylogeographical patterns (Scheidegger et al. Reference Scheidegger, Bilovitz, Werth, Widmer and Mayrhofer2012; Widmer et al. Reference Widmer, Dal Grande, Excoffier, Holderegger, Keller, Mikryukov and Scheidegger2012; Sork & Werth Reference Sork and Werth2014). Moreover, molecular markers help to clarify the reproductive mode (Walser et al. Reference Walser, Sperisen, Soliva and Scheidegger2003, Reference Walser, Gugerli, Holderegger, Kuonen and Scheidegger2004; Mansournia et al. Reference Mansournia, Bingyun, Matsushita and Hogetsu2012; Singh et al. Reference Singh, Dal Grande, Cornejo, Schmitt and Scheidegger2012) and dispersal strategies of lichen-forming fungi (Werth et al. 2006 Reference Werth, Wagner, Gugerli, Holderegger, Csencsics, Kalwij and Scheideggera ; Belinchón et al. Reference Belinchón, Ellis and Yahr2014). In this paper, we aimed to 1) develop highly variable molecular markers for the mycobiont of B. dryina, 2) establish a sampling design for further population genetics studies of this habitat specialist lichen, and 3) test if the degree of polymorphism of the newly developed markers provides the information necessary to compare genetic diversity and levels of differentiation at the tree, stand and landscape levels. Three localities in north-eastern Switzerland were used for this test. The results will support planning processes in river revitalization which aim to re-establish longitudinal connectivity along riverscapes and lateral connectivity to coppice-with-standards forests, where B. dryina currently occurs.
Materials and Methods
Assembling a genomic library
To develop microsatellite markers, a total of 3269 fruiting bodies (apothecia) of Bactrospora dryina from 57 oak trees (Quercus robur L.) were sampled in the Romanshorn forest near Spitz in NE Switzerland (red circles, Fig. 2). As B. dryina is rare and threatened in Europe, we wanted to obtain markers with a high genetic resolution at the local scale. For the development of markers, we therefore sampled B. dryina on multiple trees within one forest stand but using several classes of distance. Specifically, we sampled neighbouring trees and then gradually increased the distance between sampled trees up to 1 km within an area of 0·5 km2 in one forest patch. Thus, samples were taken at various distances between target trees, to the forest edge and to rivulets.
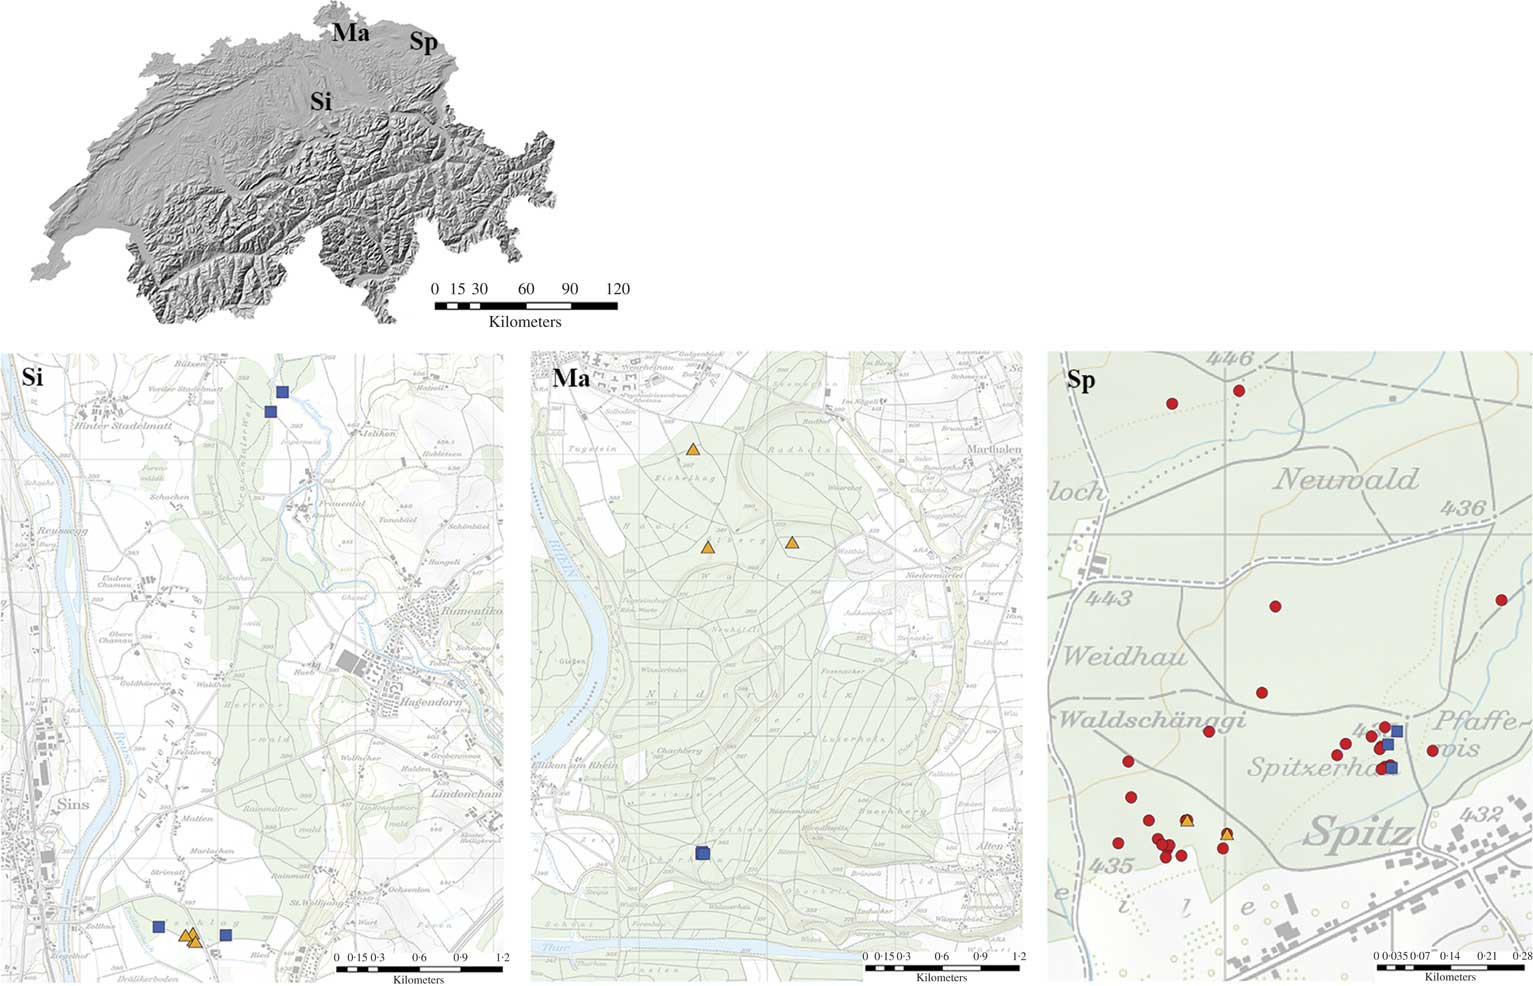
Fig. 2 Sampled localities and trees with Bactrospora dryina in north-eastern Switzerland. Sampled localities: Si=Sins; Ma=Marthalen; Sp=Spitz. Sampled trees: ![]() =454 sequencing;
=454 sequencing; ![]() =polymorphism;
=polymorphism; ![]() =variation. Swiss Map Raster 25 © 2017 swisstopo (5704 000 000). Reproduced with permission from swisstopo (JA100118). Maps drawn in ArcMap10.4.
=variation. Swiss Map Raster 25 © 2017 swisstopo (5704 000 000). Reproduced with permission from swisstopo (JA100118). Maps drawn in ArcMap10.4.
The fruiting bodies of B. dryina are apothecia without algal cells in the margins (Egea & Torrente Reference Egea and Torrente1993; Wirth et al. Reference Wirth, Hauck and Schultz2013). Based on previous experience with Lobaria pulmonaria apothecia (Walser et al. Reference Walser, Sperisen, Soliva and Scheidegger2003), we assume that the major part of the apothecial tissue is composed of maternal vegetative, haploid hyphae. Should the species be outcrossing, a small proportion of the apothecial tissue is hypothesized to be of paternal origin or dikaryotic during the formation of young asci. The ascospores are largely produced in B. dryina during winter and spring (Hilfiker Reference Hilfiker2000). We therefore collected material from January to early April (2011), when we expected a higher content of DNA in the apothecia. Apothecia were carefully removed from the thalli using forceps in order to prevent damage to natural colonies. Between 100 and 200 fruiting bodies were sampled in separate tubes. Samples were then cleaned manually in the laboratory: drops of water were placed on each fruiting body for better removal of vegetative thallus fragments, bark and other contaminants overlooked during fieldwork. In parallel, DNA was isolated in 30 tubes, each containing between 100–200 clean fruiting bodies. The total genomic DNA was isolated using PowerSoil DNA Isolation Kit (MoBio Laboratories, Carlsbad, California, USA) according to the manufacturer’s instructions. DNA extracts were pooled to 1 ml of c. 5 ng/µl DNA, which was used for genome assembly. Library preparation and whole genome 454 pyrosequencing of pooled DNA samples were performed by Microsynth (Balgach, Switzerland) using a Roche GS FLX sequencer to generate random sequences and to isolate a sufficient number of microsatellite loci. Shotgun libraries were prepared using the GS FLX Titanium Rapid Library Preparation Kit (Roche Diagnostics, Basel, Switzerland) and Microsynth provided barcode adapters. We obtained 15 903 reads of an average length of 268 bp. The unassembled sequences were screened for di-, tri-, tetra- and pentanucleotide microsatellites using MSATCOMMANDER 1.0.2 alpha (Rozen & Skaletsky Reference Rozen and Skaletsky1999; Faircloth Reference Faircloth2008), with a minimum repeat length of 8 bp for dinucleotides and 6 bp for all others. Out of all reads, MSATCOMMANDER recovered 52 primer pairs that corresponded to the default microsatellite primer parameters.
Fungal specificity
The development of species-specific markers for symbiotic assemblages (such as lichens) is complicated by the risk of contamination of the target DNA with symbiotic genomes. The fruiting bodies of B. dryina contain only fungal tissue, algal cells being generally lacking (Wirth et al. Reference Wirth, Hauck and Schultz2013). However, in order to exclude amplification with symbiotic or epiphytic co-habitants of B. dryina, we carried out additional tests. The symbiotic algal partners of B. dryina are “trentepohlioid” (Egea & Torrente Reference Egea and Torrente1993), but no precise genus or species information is available. Therefore, we isolated and cultivated the algal partners of B. dryina on agar medium following the method reported in Yoshimura et al. (Reference Yoshimura, Yamamoto, Nakano and Finnie2002). For algal cultures, bark with lichen was sampled at Sins, NE Switzerland (yellow triangles in Fig. 2, the same trees as those used for polymorphism). Lichen thalli were washed in the laboratory with distilled water and then sectioned with sterile razor blades under a laminar flow hood, and algal cells were manually transferred to agar medium. The incubation took place under equal diurnal light/dark periods of 12 hours. for five months before the algal culture was harvested. The DNA from mature cultures (well-developed tissue with typical filaments and zoosporangia) was isolated with the PowerSoil DNA Isolation Kit (MoBio Laboratories, Carlsbad, California, USA) according to the manufacturer’s instructions. For amplifying nuclear ITS from cultured photobionts, we used the primer pair combination of nr-SSU-1780-5 (Piercey-Normore & DePriest Reference Piercey-Normore and DePriest2001) and ITS4T (Kroken & Taylor Reference Kroken and Taylor2000). All PCR runs were performed on Veriti Thermal Cyclers (Life Technologies, Carlsbad, California, USA) in a total volume of 25 μl containing 1 μl of c.5 ng genomic DNA, 1·25 μl each of reverse and forward primers and 9 μl of JumpStart REDTaq ReadyMix (Sigma-Aldrich, St. Louis, Missouri, USA) with the following conditions: denaturation for 2 min at 94°C, followed by 30 cycles of 30 s at 94°C, 30 s at 57°C and 30 s at 72°C, with a final extension of 10 min at 72°C. All PCR products were labelled with the BigDye Terminator v3.1 Cycle Sequencing Kit (Life Technologies, Carlsbad, CA, USA) and cycle sequenced as follows: 1) 1 min at 96°C; 2) 26 cycles of 20 s at 96°C, 5 s at 50°C and 2 min at 60°C. Products were then purified using the BigDye XTerminator Purification Kit (Life Technologies). The sequences were detected on a 3130xl Genetic Analyzer (Life Technologies) and analyzed with the Sequencing Analysis Software 3.4 (Life Technologies). Sequences were then identified using the ntBLAST search on http://www.ncbi.nlm.gov as Trentepohlia annulata (KY006475, KY006480, KY006481, identity value 79–87%), Trentepohlia. spp. (KY006476, KY006478, KY006479, 83–98%) and Printzina spp. (KY006477, 93%). The DNA samples from those algal cultures were pooled and used to test the specificity of the 52 microsatellite primer pairs with microsatellite motif (see Supplementary Material Table S1, available online).
For testing symbiont specificity, we used cost-effective M13 tag labelling of forward primers for PCR amplification (Schuelke Reference Schuelke2000) of the 52 primer pairs selected. The PCR reactions were run in a total volume of 10 μl containing 0·5 μl of c.5 ng genomic DNA, 0·3 μl each of reverse and M13-labelled HEX primers, 0·1 μl of forward M13-tailed primer and 5 μl of JumpStart REDTaq ReadyMix (Sigma-Aldrich, St. Louis, Missouri, USA), and evaluated in a temperature gradient with 1° increments between 56–61°C, performed with the following conditions: denaturation for 2 min at 94°C, followed by 30 cycles of 30 s at 94°C, 45 s at 56–61°C, and 45 s at 72°C. For the M13-tag binding, an additional eight cycles of 30 s at 94°C, 45 s at 53°C and 45 s at 72°C were performed, with a final extension of 30 min at 72°C. In total, 15 primer pairs were amplified with at least one of the identified photobionts of B. dryina. Hence these primers were considered algal but not fungal-specific and were therefore excluded from further analyses.
Polymorphism
The fungal component of B. dryina was tested for polymorphism with the 37 remaining primer pairs under the same M13 tag labelling and PCR conditions with the temperature gradient described above. Polymorphism of those 37 primer pairs was tested on four samples from each of Marthalen, Sins and Spitz (yellow triangles in Fig. 2), which are situated 50–80 km from each other in NE Switzerland. We sampled neighbouring trees (Sins), or trees growing in the same forest stand at a distance of c. 70–100 m (Spitz) or 700–1000 m (Marthalen) from each other. There were 30 loci that showed products at an annealing temperature of 56°C, three at 57°C and four at 58°C. Twenty-one primer pairs were monomorphic and were therefore excluded from further analyses.
Multiplexing
We obtained 16 polymorphic primer pairs with satisfactory amplification. All PCR products were multiplexed (Table 1). PCR reactions were performed in a total volume of 10 μl containing 1 μl of c.5 ng genomic DNA, 1 μl each of forward and reverse primers of varying concentrations (0·2–1·0 μM; Table 1), and 5 μl of Type-it Multiplex PCR Master Mix (QIAGEN, Hilden, Germany). The PCR protocol used fluorescent forward primers (Table 1) and the reaction was performed under the following conditions: 5 min at 95°C, followed by 30 cycles of 30 s at 95°C, 90 s at 56 or 58°C and 30 s at 72°C, with a final extension of 60 min at 60°C. PCR products were diluted in 10 μl of sterile H2O and 1 μl of this diluted solution was taken for capillary electrophoresis, run on a 3130xl DNA Analyzer with GeneScan 500 LIZ as the size standard for fragment analysis (both by Life Technologies, Carlsbad, California, USA), according to the manufacturer’s instruction. An injection time of 6 s was used to generate data.
Table 1 Characterization of 16 microsatellite loci developed for Bactrospora dryina and the genetic variation of these loci among three localities in north-eastern Switzerland. For explanation of abbreviations see footnotes.

Si=Sins; Sp=Spitz; Ma=Marthalen, sites within NE Switzerland. Ta=annealing temperature; Na=number of alleles; He=Nei’s unbiased gene diversity. FAM™, VIC®, NED™=fluorescent dyes for oligonucleotides, proprietary to Thermo Fisher Scientific.
Intraspecific and cross-species amplification
Amplification of the 16 fungus-specific microsatellite markers was tested with specimens of B. dryina from other geographical regions, such as Ukraine, Belarus and Iran (see Supplementary Material Table S1, available online). Cross-species amplification was carried out with Bactrospora patellarioides, the bark of Quercus robur (to exclude the possibility that DNA contamination from the phorophyte influenced the 454 library) and 11 crustose lichen species that co-occur with B. dryina in the epiphytic community: Arthonia cinnabarina, Anisomeridium polypori, Bacidia polychroa, Chaenotheca trichialis, Felipes leucopellaeus, Graphis scripta, Inoderma byssaceum, Lecanactis abietina, Opegrapha vermicellifera, Reichlingia leopoldii and Strigula sp. (Supplementary Material Table S1, available online).
Genetic variation
To determine genetic variation 1) at the tree level, 2) among trees within stands and 3) among regions with the 16 newly developed polymorphic and species-specific microsatellite markers, we used 264 specimens from three localities in NE Switzerland (Table 1, Fig. 2). The specimens were collected from the same three localities as above, but different trees were sampled (blue squares in Fig. 2). Neighbouring trees were sampled in Marthalen, trees growing 30–70 m from each other were selected at Spitz, and specimens from trees located 150, 500 and 4000 m from each other were sampled at Sins. In each of the three localities, we sampled one tree according to ‘comprehensive sampling’ (60 samples per tree) and two to three additional trees with ‘reduced sampling’ (12 samples per tree). For the ‘comprehensive sampling’, we stratified the B. dryina colony on the trunk into an upper (c. 165–400 cm above ground), middle (140–160 cm) and lower (40–135 cm) level (Fig. 1A). We collected 20 samples from each level: two specimens were sampled from five bark crevices and five ridges, keeping 5–10 cm between the fruiting bodies (Fig. 1B). Here, and in all further analyses, a “specimen” consisted of a single fruiting body or 1–5 mm2 of vegetative thallus (Fig. 1C). In total, 180 specimens were collected for the “comprehensive sampling” dataset. For the “reduced sampling” (two trees in Marthalen and Spitz, three trees in Sins) we sampled 12 specimens from each tree, six from the upper and six from the lower level of the B. dryina colony (84 specimens in total). The genomic DNA was isolated from specimens using PowerPlant® Pro-htp 96 Well DNA Isolation Kit (MoBio Laboratories, Carlsbad, California, USA) according to the manufacturer’s instructions.
Alleles were sized using GeneMapper 5.0 (Life Technologies). The variability between microsatellite loci (numbers of alleles and Nei’s unbiased gene diversity), linkage disequilibrium (LD), hierarchical AMOVA among populations and Mantel tests were calculated in Arlequin 3.11 (Excoffier et al. Reference Excoffier, Laval and Schneider2005) with 1000 permutations selected for AMOVA and Mantel tests. The index of association (Ia) was calculated and plotted for full (including clones) and clone-corrected data in the R package “poppr” (Kamvar et al. Reference Kamvar, Tabima and Grünwald2014) with 999 permutations. The number of multilocus genotypes (G), the proportion of different multilocus genotypes and the minimum number of colonization events (C) per stratum (tree, locality or sampling approach) were calculated in R (R Core Team 2014) using a script originally written by Werth et al. (2006 Reference Werth, Wagner, Holderegger, Kalwij and Scheideggerb ) and adapted by S. Werth to handle individuals with missing data (Nadyeina et al. 2014 Reference Nadyeina, Dymytrova, Naumovych, Postoyalkin, Werth, Cheenacharoen and Scheideggerb ). The minimum number of colonization, or founder, events was introduced by Walser et al. (Reference Walser, Sperisen, Soliva and Scheidegger2003) and corresponds to the number of alleles at the most variable locus. The differences in mean G and C per stratum were tested with ANOVA in R.
Sampling design at the tree level
To establish a sampling design for future studies on the population genetics of B. dryina (i.e. to evaluate if our sampling approach was suitable for characterizing genetic diversity at the tree level), we produced genotype rarefaction curves using the R package “iNEXT” (Hsieh et al. Reference Hsieh, Ma and Chao2016), which uses plotting scripts from “ggplot2” (Wickham Reference Wickham2016). Sample-size-based rarefaction curves were computed and plotted for species richness (here genotype richness) with 95% bootstrap confidence bands around the sampling curves (1000 permutations were used), facilitating the comparison of diversities across multiple assemblages. The curves can be rarefied to smaller sample sizes or extrapolated to larger sample sizes, guided by an estimated asymptotic species richness. In this paper, we show two types of rarefaction: 1) sample-size-based rarefaction curves plot the diversity estimates with respect to sample size; 2) coverage-based rarefaction curves plot sample completeness, defined as the proportion of the total number of individuals that belong to the species (genotype), detected per tree with respect to sample size. We specified the maximum sample size as 100 specimens per tree. For this analysis, we used the same dataset that was used to test genetic variation (264 specimens, originating from three localities in NE Switzerland). However, three trees covered by a single genotype were omitted here because confidence intervals could not be calculated.
Results
Specificity and polymorphism of the new microsatellite markers
The 454 genetic sequencing resulted in 52 primer pairs with microsatellite motifs. From these, we excluded 15 pairs that appeared to be algal-specific and 21 pairs that were monomorphic. The screening resulted in 16 polymorphic and fungus-specific microsatellite markers for Bactrospora dryina. None of the 11 crustose lichen species selected for cross-species testing amplified with the new microsatellite markers. All markers amplified with B. dryina from Ukraine and Belarus; however, samples from Iran amplified irregularly, from 67% (bd17, bd35 and bd48) to 33% (bd37) to no amplification (bd40) (Supplementary Material Table S1, available online). Furthermore, our results showed that B. dryina forms symbiotic associations with Trentepohlia annulata, Trentepohlia spp. and Printzina spp. in NE Switzerland.
Trinucleotide microsatellites were dominant among the 16 loci (Table 1). All loci revealed significant pairwise LD based on 1000 permutations (P≤0·001), except for the pair bd42-bd46. The observed index of association (Ia) significantly deviates from an expected distribution under no linkage for the full dataset (not shown here) as well as for the clone-corrected dataset (Fig. 3). There were two (bd16, bd45, bd46, bd49, bd51) to five (bd12) alleles per locus, with a mean of 3·13, and unbiased gene diversity varied from 0·06 (bd45) to 0·71 (bd28) among the three Swiss sites (Table 1).

Fig. 3 The observed index of association (Ia, dashed line) for three regions in north-eastern Switzerland: Si=Sins; Ma=Marthalen; Sp=Spitz. The resampled distribution plotted with histogram. Data are clone corrected.
Genetic diversity and differentiation revealed by the new microsatellite markers
The analysis of 264 specimens from three localities in NE Switzerland revealed 31 multilocus genotypes with 4–18 genotypes per locality and 1–13 genotypes per tree (Table 2, Fig. 4). The microsatellite data showed that sections of the trees were colonized more than once. The highest genotype diversity was detected for the Marthalen site: more than 20% of the specimens analyzed belonged to different multilocus genotypes on each tree. The number of multilocus genotypes was not statistically different between sites (ANOVA, P≤0·0656). The minimum number of colonization events per tree was three and did not differ among sites (Table 2). The number of multilocus genotypes did not depend on the area occupied by the B. dryina colony (r 2=0·004, P≤0·8605).

Fig. 4 Diversity and spatial pattern of multilocus genotypes in Bactrospora dryina for 10 sampled trees in three localities in north-eastern Switzerland. A, comprehensively sampled trees BD01, BD05, BD09; B, trees with reduced sampling BD02, BD03, BD04, BD06, BD07, BD10, BD11.
Table 2 Number of unique multilocus genotypes, percentage of different genotypes and minimum number of colonization events per tree for Bactrospora dryina at three sites in north-eastern Switzerland

* =trees sampled comprehensively, see Materials and Methods for explanation.
The hierarchical analysis of molecular variance (AMOVA) indicated that 70% of the genetic variation was found within trees (P≤0·001; Table 3). Analyses also showed significant differentiation between trees within the three Swiss localities (18%, P≤0·001; Table 3) and between localities (12%, P≤0·001; Table 3). Mantel tests revealed a significant correlation between genetic and geographical distances, and indicated a non-random spatial structure of genotypes (r 2=0·16, P≤0·001).
Table 3 Hierarchical analysis of molecular variance (AMOVA)in Bactrospora dryina in north-eastern Switzerland, showing the mean statistics for 16 fungal loci

*only trees sampled comprehensively were included in the tree level analyses. ***indicates P≤0·001.
Completeness of the sampling design at the tree level
The number of multilocus genotypes and the minimum number of colonizations were not statistically different for the trees with either comprehensive or with reduced sampling (P≤0·3292 and P≤0·6111, respectively).
Multilocus genotype rarefaction curves at the tree level reached saturation at around 20–25 samples per tree for four studied trees (BD09, BD10, BD11 in Marthalen and BD07 in Spitz) and indicated 7–8 multilocus genotypes present on those individual trees (Fig. 5A). However, for three other trees (BD01, BD04, BD05), the curves reached an asymptote at 10–15 samples per tree, meaning that increasing the sampling effort would not reveal a higher multilocus genotype diversity. Sample completeness curves, based on sample-size-based rarefaction, showed that more than 60% of the genotype diversity is captured with 5–10 samples per tree (Fig. 5B).
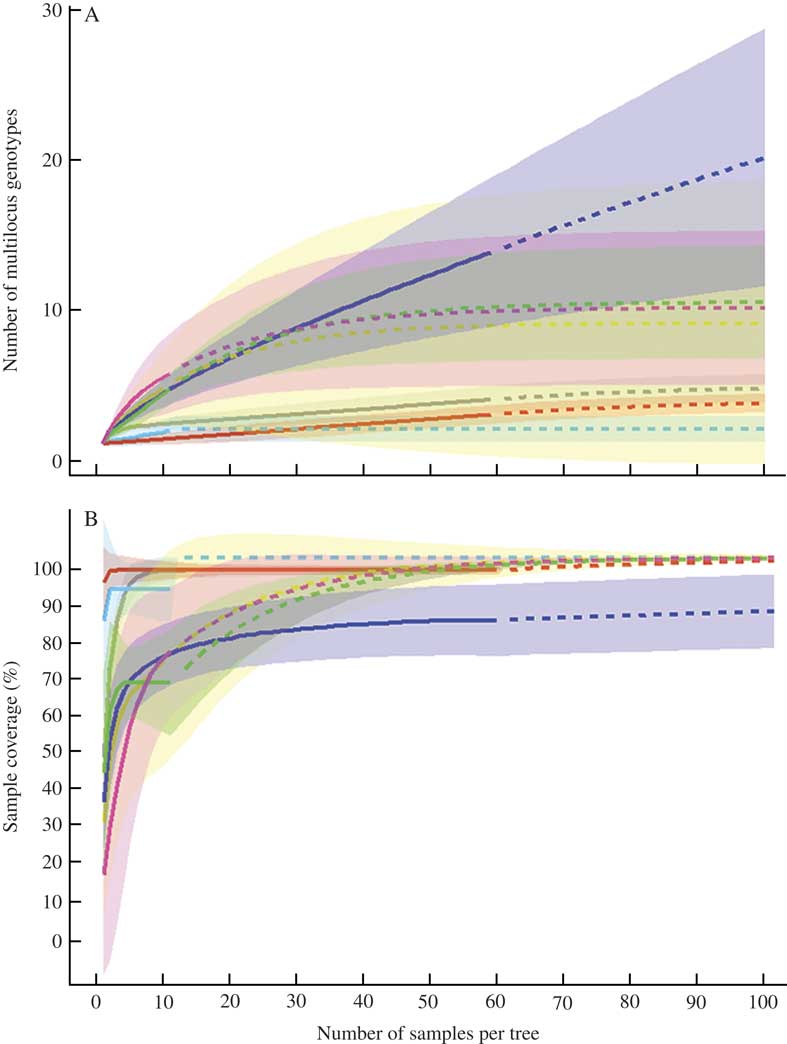
Fig. 5 A, sample-size-based rarefaction curves for the numbers of multilocus genotypes, found on each of seven trees with Bactrospora dryina; B, sample completeness curves, based on the rarefaction curves shown in A. Solid line=interpolation, dotted line=extrapolation. “Grey” curve and shadow=BD01, “blue”=BD04, “red”=BD05, “yellow”=BD07, “dark blue”=BD09, “green”=BD10, “magenta”=BD11. Rarefaction and completeness curves are shown together with 95% confidence intervals (shaded areas).
Discussion
Conservation actions should ideally be based on a careful investigation of dispersal range, genetic diversity and differentiation in populations of habitat specialist species (Naiman et al. Reference Naiman, Décamps and McClain2005). We developed 16 new microsatellite markers for the epiphytic lichen Bactrospora dryina, which is an indicator of old-growth lowland forests, and demonstrated the applicability of the new markers for the study of population genetics at different spatial scales. Tree-level analysis revealed a complex multi-genotype structure for continuous lichen colonies and showed that 70% of the genetic variation was within trees. At the same time, we found high regional differentiation caused by isolation by distance. Finally, we established a sampling design for future population genetics studies on B. dryina.
Specificity and polymorphism of the new microsatellite markers
The 16 newly developed, species-specific, polymorphic microsatellite markers amplified reliably with the mycobiont of B. dryina from different European geographical regions and partly amplified specimens from Iran (Supplementary Material Table S1, available online). We hypothesize that the incomplete amplification of the microsatellites in three apothecia from one sample (piece of bark), collected in Iran in 2011, was caused by a partial degradation of the DNA, although mutations in the primer regions of the unsuccessfully amplified markers should also be considered in a future study.
The microsatellite markers did not cross-amplify with other species of Bactrospora and 11 lichen species which often share the same habitat and can easily be misidentified since they are sterile (Supplementary Material Table S1, available online). This indicates a high species-specificity of the markers for the mycobiont of B. dryina and means that these markers can potentially be used for the identification of poorly developed colonies or juvenile, sterile individuals. Preliminary analyses showed that the markers can successfully be used to screen for B. dryina in stands where no fertile thalli are known to exist. Small thalli of sterile crusts associated with trentepohlioid photobionts were successfully identified as early B. dryina colonizations in such stands. The DNA extraction protocol and the PCR conditions used here make the analysis of single fruiting bodies or a few square millimetres of sterile thallus possible, which is essential for the study and conservation of this rare and threatened species.
The maximum number of alleles of the most variable marker found in the 264 specimens analyzed was five. This is considerably lower than the 11 alleles found in Lobaria pindarensis (Devkota et al. Reference Devkota, Cornejo, Werth, Chaudhary and Scheidegger2014), 13 in both Nephroma laevigatum (Belinchón et al. Reference Belinchón, Ellis and Yahr2014) and Bryoria section Implexae (Nadyeina et al. 2014 Reference Nadyeina, Cornejo, Boluda, Myllys, Rico, Crespo and Scheideggera ), 15 in Usnea subfloridana (Tõrra et al. Reference Tõrra, Cornejo, Cheenacharoen, Dal Grande, Marmor and Scheidegger2014) and 16 in Lobaria pulmonaria (Walser et al. Reference Walser, Sperisen, Soliva and Scheidegger2003; Werth et al. Reference Werth, Cornejo and Scheidegger2013). However, the values are comparable to the three alleles found in Parmotrema tinctorum (Mansournia et al. Reference Mansournia, Bingyun, Matsushita and Hogetsu2012), six in both Nephroma parile (Belinchón et al. Reference Belinchón, Ellis and Yahr2014) and Protoparmeliopsis muralis (Guzow-Krzemińska & Stocker-Wörgötter Reference Guzow-Krzemińska and Stocker-Wörgötter2013) and eight in Lobarina scrobiculata (Prieto et al. Reference Prieto, Romera, Merinero, Aragón and Martínez2015). Different levels of genetic variability of microsatellite markers might be related to the different types of microsatellite motifs, such as di- and trinucleotides, or to the number of developed microsatellite markers per species. Low numbers of alleles could, however, also reflect natural or anthropogenic demographic processes of the populations studied, such as past bottlenecks, which might have limited dispersal or a specific reproductive mode. We speculate that the low number of alleles observed in B. dryina is related to the small geographical area considered in this study and to the demographic history of the populations. Since early mediaeval times, a substantial part of deciduous forests in the European lowlands has been intensively managed (Küster Reference Küster1998) and partly transformed into coppice-with-standards forests. Such forests are usually coppiced at the lower canopy level, but “standards” were traditionally maintained that led to an uneven-aged stand structure at the higher canopy level (Nyland Reference Nyland1996). This complex forest stand structure reflects the multifunctional forest management of the past, where frequent cutting for firewood led to rapidly changing light availability on the trunks of pedunculate oaks (Quercus robur) that were managed for the demand for construction timber. Thus, coppice-with-standards forests have high structural diversity and represent an important habitat type for rare and threatened forest species (Scherzinger Reference Scherzinger1996) such as B. dryina. However, floodplain forests were originally the major habitats of B. dryina, where floods, including infrequent ice drift, led to a forest structure similar to that of the current coppice-with-standards forests. Therefore, the relatively low number of alleles found in current B. dryina populations is a possible consequence of the secondary colonization of habitats created by forest management. Primary habitats of this species in floodplain forests have largely disappeared over the centuries.
For B. dryina, we found significant linkage of loci (P≤0·001, Fig. 3). The observed Ia significantly deviates from the expected distribution under no linkage for both the full dataset and the clone-corrected dataset. Such a finding is often reported for clonal organisms (Kamvar et al. Reference Kamvar, Tabima and Grünwald2014) but it has also been documented for populations with partial self-fertilization (Nordborg Reference Nordborg2000; Cutter Reference Cutter2006). We conjecture that sexual reproduction in the B. dryina populations in NE Switzerland is based on partial selfing, or that the species can disperse clonally with thallus fragments in addition to frequently developed apothecia. Conidia, which are formed in pycnidia, might also play an important role in dispersal, although germination of conidia has never been tested for this species. Partial selfing may also explain the low numbers of alleles discussed above: Belinchón et al. (Reference Belinchón, Ellis and Yahr2014) reported that the sexually reproducing Nephroma laevigatum had a higher genetic diversity than the predominantly asexual N. parile.
Multiple colonization events on single trees
Comprehensive and reduced sampling schemes of tree-level analyses identified a complex multi-genotype structure within continuous lichen colonies (Table 2, Fig. 4) and revealed a high genotype diversity that accounted for 70% of the overall genetic variation (Table 3). Similar examples are known for Cladonia chlorophaea (DePriest Reference DePriest1993), Haematomma ochroleucum (Laundon Reference Laundon1978), Ochrolechia parella (Murtagh et al. Reference Murtagh, Dyer and Crittenden2000) and Parmelia omphalodes (Skult Reference Skult1984), where several genotypes coexist within a single aggregate. Baloch & Grube (Reference Baloch and Grube2009) reported the occurrence of different haplotypes of foliicolous lichens on single leaves, but their study involved morphologically distinct thalli. Our study of B. dryina is the first population genetics investigation of crustose lichens showing genetic heterogeneity of spatially uniform thalli based on microsatellite markers.
This result demonstrates multiple colonization events, sensu Walser et al. (Reference Walser, Sperisen, Soliva and Scheidegger2003), of single trees (Table 2, Figs 4 & 5). A low number of colonizations may indicate low levels of connectivity in isolated habitat islands, such as phorophyte trees in fragmented landscapes. Spatial aggregation has been related to dispersal limitation (Löbel et al. Reference Löbel, Snäll and Rydin2006; Scheidegger & Werth Reference Scheidegger and Werth2009) and is considered less pronounced in sexually dispersing species. The spatial pattern of distinct multilocus genotypes on single trees can also reflect the colonization history. For instance, tree BD05 at Spitz hosted a single dominant genotype that colonized the entire niche over several square metres, suggesting it was the result of one successful colonization event (Table 2, Fig. 4A). One additional genotype colonized the same tree but did not spread over a large area. This distinct genotype, restricted to ridge “3” in the middle of the trunk, was likely the result of a later colonization event with a limited spread because the suitable area on the tree was already occupied by another genotype. Tree BD01 at Sins experienced two colonization events by B. dryina. These colonies spread equally in vertical and horizontal directions but did not form admixed thalli. The most complex pattern was found on tree BD09 at Marthalen, where one dominant genotype spread over the entire B. dryina habitat and several additional genotypes developed on bark ridges and crevices, indicating continuing colonization during the existence of B. dryina on this tree.
Our analyses showed that the number of multilocus genotypes did not depend on the area occupied by the B. dryina colony. Thus, the size of a colony is not the result of an aggregation of multiple individuals of restricted thallus size that can gradually fill the developing area of the habitat; instead, the suitable habitat on the bark can be colonized relatively quickly by competitive individuals once they have established. The rate of colonization is related to the establishment success of propagules settling on a host tree (Gjerde et al. Reference Gjerde, Blom, Heegaard and Sætersdal2015). This success depends on several factors, such as morphological and physiological traits of the diaspores (Hilmo et al. Reference Hilmo, Rocha, Holien and Gauslaa2011) and the reproductive mode of the species (Hedenås et al. Reference Hedenås, Bolyukh and Jonsson2003), as well as physical-chemical characteristics of the tree bark related to tree size/age, microclimatic conditions and forest quality (Snäll et al. Reference Snäll, Riberiro and Rydin2003; Belinchón et al. Reference Belinchón, Martínez, Aragón, Escudero and De la Cruz2011). Microhabitat quality and history are likely to play important roles in B. dryina colonization and establishment. Future studies should investigate the degree of intraspecific competitive exclusion between individuals forming a continuous colony.
Notes on sampling design for the study of tree-level colonization
Our data showed little difference in the number of multilocus genotypes and colonization events between the ‘comprehensive’ and ‘reduced’ sampling schemes. Both sampling approaches resulted in the detection of, on average, 3–6 genotypes per tree which implies that there were three founder events per locality in the past. Specifically, this result indicates that the trees in Marthalen were typically colonized a minimum of three times in the past, whereas trees in Sins were colonized one to two times and those in Spitz one to three times (Table 2). A larger number of colonization events indicates frequent colonizations of single trees in the past and is an indication of a high level of functional connectivity at the stand level. A low number of colonization events indicates higher degrees of isolation and highlights the existence of dispersal barriers that hamper the colonization potential in a patch-tracking metapopulation such as B. dryina individuals living on oak trees. For further study of population genetics, we recommend the collection of 5–15 specimens per tree which would allow detection of 60–80% of the multilocus genotypes on each tree (Fig. 5B).
Stand level and regional genetic differentiation
Through hierarchical analysis of molecular variance (AMOVA), we determined that 70% of the total genetic variation occurred within trees. In comparison, 12% of the molecular variance was partitioned among several host trees within three Swiss localities and 18% was partitioned among these sites. A Mantel test indicated a significant isolation-by-distance among the localities, which are 50–80 km apart, suggesting limited gene flow between them. Similar results have been shown for populations of other sexually reproducing lichens (Belinchón et al. Reference Belinchón, Ellis and Yahr2014) and for species with combined reproductive strategies (Printzen & Ekman Reference Printzen and Ekman2003). The ascospores of B. dryina are small phragmospores (Egea & Torrente Reference Egea and Torrente1993; Wirth et al. Reference Wirth, Hauck and Schultz2013) capable of breaking apart when leaving the ascus. The species also produces small conidia but their ability to germinate has not yet been studied. As we did not find shared genotypes among the three studied localities, long-distance dispersal of both spore types may be limited. Snails, insects and water run-off along the tree trunk may play a more important, but spatially limited, role in the spread of B. dryina. Such passively dispersed species with numerous small propagules have been found to exhibit patchy populations with limited dispersal at the landscape scale (Gjerde et al. Reference Gjerde, Blom, Heegaard and Sætersdal2015). In general, the distribution of lichen-forming fungi depends on habitat quality, the availability of compatible photobiont populations and the spatial configuration of habitat patches. Hence, habitat and landscape dynamics heavily influence the metapopulation dynamics of this species. Functioning metapopulations are an important prerequisite for the long-term conservation of epiphytic lichens in forest stands (Snäll et al. Reference Snäll, Pennanen, Kivistö and Hanski2005; Wagner et al. Reference Wagner, Werth, Kalwij, Bolli and Scheidegger2006). Patchy populations of B. dryina in NE Switzerland, which have a high level of genetic differentiation at the regional level, might indicate strong genetic drift and genetically isolated populations. This highlights the importance of conservation measures, such as increasing habitat patch size and restoring connectivity among habitats.
We thank Carlos Galan Boluda and Victor Rico (Madrid), Sergiy Kondratyuk (Kyiv), Lyudmyla Dymytrova (Birmensdorf) and Jan Vondrak (Ceske Budejovice) for providing specimens, Majid Iravani (Isfahan) for organizing a fieldtrip in Iran, two anonymous reviewers, whose comments helped us to improve this paper, and Melissa Dawes (Birmensdorf) for correcting the English. We acknowledge support from the Genetic Diversity Centre (ETH Zurich). This study was financially supported by the Federal Office of the Environment (FOEN) as part of the project “River Engineering and Ecology – Sediment and Habitat Dynamics” granted to CS.
Supplementary Material
For supplementary material accompanying this paper visit https://doi.org/10.1017/S0024282917000548


