Introduction
Many lichens synthesize unique secondary metabolites not found in other organisms. Atranorin is one of the most prevalent of these lichen chemicals and one of only a small number of compounds that are primarily cortical. Due to its ubiquity, especially within parmelioid lichens, the taxonomic significance of atranorin at the generic level and above is limited. However, the trait for atranorin synthesis has been gained and lost numerous times throughout the evolutionary development of this group and can thus be useful for species determinations (Blanco et al. Reference Blanco, Crespo, Ree and Lumbsch2006).
Numerous studies have demonstrated that lichens use atranorin as a photo-buffer. Atranorin crystals on the thallus surface reflect harmful UV radiation (BeGora & Fahselt Reference BeGora and Fahselt2001; Hall et al. Reference Hall, Bornman and Björn2002; Solhaug et al. Reference Solhaug, Larsson and Gauslaa2010; Lohézic-Le Dévéhat et al. Reference Lohézic-Le Dévéhat, Legouin, Couteau, Boustie and Coiffard2013) which enables lichens to inhabit areas receiving high insolation. Less frequently, atranorin has been noted as a herbivore deterrent (Pöykkö et al. Reference Pöykkö, Hyvärinen and Bačkor2005; Nimis & Skert Reference Nimis and Skert2006), an inhibitor of competitive species (Whiton & Lawrey Reference Whiton and Lawrey1984) and a reducing agent to facilitate iron and phosphate uptake in acidic soils (Paul et al. Reference Paul, Hauck and Leuschner2009). Atranorin also has many potential human health applications, including anti-cancer (Bačkorová et al. Reference Bačkorová, Jendželovský, Kello, Bačkor, Mikeš and Fedoročko2012), antimicrobial (Türk et al. Reference Türk, Yılmaz, Tay, Türk and Kıvanç2006; Kosanić et al. Reference Kosanić, Manojlović, Janković, Stanojković and Ranković2013), pro-oxidant and antioxidant (Melo et al. Reference Melo, dos Santos, Serafini, Caregnato, de Bittencourt Pasquali, Rabelo, da Rocha, Quintans, de Souza Araújo and da Silva2011), gastroprotective (Sepulveda et al. Reference Sepulveda, Chamy, Piovano and Areche2013) and analgesic (Bugni et al. Reference Bugni, Andjelic, Pole, Rai, Ireland and Barrows2009) properties as well as wound healing (Barreto et al. Reference Barreto, Albuquerque-Júnior, Pereira-Filho, Quintans, Barreto, DeSantana, Santana-Filho, Santos, Bonjardim and Araújo2013), biofilm inhibition (Pompilio et al. Reference Pompilio, Pomponio, Di Vincenzo, Crocetta, Nicoletti, Piovano, Garbarino and Di Bonaventura2013) and mosquito abatement as a larvicide (Cetin et al. Reference Cetin, Tufan-Cetin, Turk, Tay, Candan, Yanikoglu and Sumbul2012).
Atranorin concentrations in lichens fluctuate seasonally (Marante et al. Reference Marante, Castellano, Rosas, Aguiar and Barrera2003; Bjerke et al. Reference Bjerke, Elvebakk, Domínguez and Dahlback2005) and vary with habitat (Solhaug et al. Reference Solhaug, Lind, Nybakken and Gauslaa2009), suggesting that this metabolite is actively synthesized or degraded over short periods of time. While there has been some previous work on the synthesis of atranorin (Neelakantan et al. Reference Neelakantan, Padmasani and Seshadri1965; Garcia-Junceda et al. Reference Garcia-Junceda, Gonzalez and Vicente1987; BeGora & Fahselt Reference BeGora and Fahselt2001; McEvoy et al. Reference McEvoy, Nybakken, Solhaug and Gauslaa2006), there has been scant research on its breakdown. Armaleo et al. (Reference Armaleo, Zhang and Cheung2008) even contend that decomposition of depsides, including atranorin, is negligible in healthy lichens in nature.
The assumed stability of atranorin has encouraged many studies to use it as a marker of metabolic response to changes in light (BeGora & Fahselt Reference BeGora and Fahselt2001; Hall et al. Reference Hall, Bornman and Björn2002; McEvoy et al. Reference McEvoy, Nybakken, Solhaug and Gauslaa2006). However, atranorin has been shown to degrade under laboratory conditions due to its thermal lability (Hiserodt et al. Reference Hiserodt, Swijter and Mussinan2000; Armaleo et al. Reference Armaleo, Zhang and Cheung2008). The present research, therefore, aims to identify laboratory conditions under which atranorin breaks down and under which it is most stable. A common technique for identifying and quantifying atranorin is high-performance liquid chromatography (HPLC). Despite standardized protocols for HPLC analysis of lichen compounds (Huovinen Reference Huovinen1987; Feige et al. Reference Feige, Lumbsch, Huneck and Elix1993), studies in recent decades have used varying extraction methods which may influence HPLC analysis and study findings.
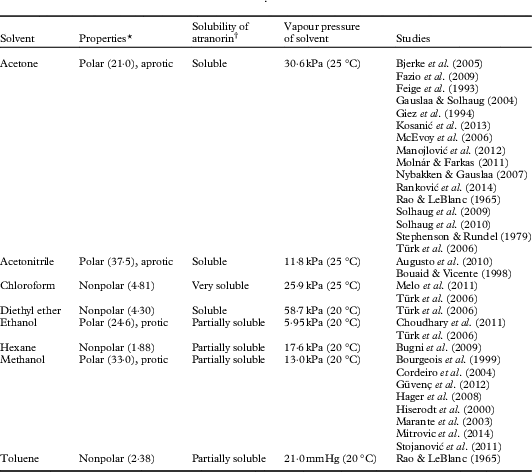
Specifically, atranorin has been extracted from lichen thalli using various solvents (Table 1). While Türk et al. (Reference Türk, Yılmaz, Tay, Türk and Kıvanç2006) investigated the resulting residues and minimal inhibitory concentration of atranorin extracted with different solvents, no study to date has compared the relative breakdown of atranorin by solvent. Further, previous research has reported atranorin extraction times ranging from less than ten minutes (Huovinen Reference Huovinen1987) to three days (Manojlović et al. Reference Manojlović, Ranković, Kosanić, Vasiljević and Stanojković2012). Yet the literature does not unequivocally document how long atranorin remains stable, or if unstable, how rapidly it degrades. Finally, pH has been another proposed factor contributing to atranorin degradation that has not been thoroughly investigated (Armaleo et al. Reference Armaleo, Zhang and Cheung2008). Therefore, our primary research questions are: does atranorin breakdown vary 1) with time and extraction solvent and 2) with pH over time? By answering both of these questions we may help identify the mechanism of breakdown.
Table 1 Solvents reported in the literature as atranorin extractants

* Dielectric constant provided in parentheses
† Qualitative observations made during experiments by the authors
Materials and Methods
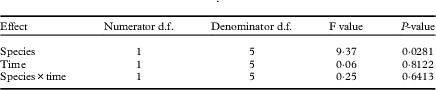
In this study we conducted four laboratory experiments to address our research questions: a solvent experiment, a pH experiment, a benzoic acid experiment and a fresh lichen extract experiment, using Hypogymnia physodes (L.) Nyl and Physcia adscendens (Fr.) H. Olivier.
HPLC protocol
For most experiments we used a commercially available atranorin standard (Chromadex, Irvine, CA). Atranorin is a semi-polar compound with a molecular mass of 374 amu and a reported solubility of 5 mg l−1 in water (Rundel Reference Rundel1978). Several 200 μl aliquots of each solution were analyzed by HPLC (Agilent 1200 Series with 1260 DAD). Separation was achieved using an Eclipse XDB-C18, 5 μm, 4.6 x 150 mm, Agilent column. For the fresh lichen experiment, we used 99·9% H2O/0·1% trifluoroacetic acid and 99·9% acetonitrile/0·1% trifluoroacetic acid mixtures as the mobile phase and a flow rate of 1 ml min−1. The detection wavelength was 272 nm and compound identification was based on retention times reported in the literature or using thin-layer chromatography (TLC). The gradient program started at 40% H2O/60% acetonitrile and increased to 100% acetonitrile in 7 min. The total runtime for the fresh lichen analysis was 15 min. In the solvent experiment, 4 mg of atranorin standard was added to 25 ml of each of six different solvents. The solutions were sonicated until the atranorin had visibly dissolved. For the experiments using atranorin standard (i.e. solvent, pH, benzoic acid) a shortened HPLC runtime of 3·5 min was used. The separation was carried out isocratically using 99·9% acetonitrile/0·1% trifluoroacetic acid mixture as the mobile phase and a flow rate of 1 ml min−1. This was done to get a time point every 5 min for the stability of atranorin. Atranorin eluted at 2·5 min while breakdown products, when present, eluted between 1–2 min. Benzoic acid, a common internal standard in atranorin experiments, eluted at 1·5 min.
In the solvent and pH experiments, each solution containing the atranorin standard was analyzed immediately following sonication, then every 15 min for 2 h and then at 4, 6, 8, 12 and 16 h. In the benzoic acid experiment, the solution was analyzed immediately following sonication, then every 5 min for 90 min. In the fresh lichen extract experiment, purified samples were analyzed immediately after resuspension in methanol and every 5 min thereafter for 75 min. Results for the first and final time points only were used for comparison. Leached but not purified fresh lichen samples were analyzed immediately prior to resuspension in methanol and then again after 20 min. These times do not include extraction or preparation times for the samples. Three independent runs or replicates were run for each factor level in all four experiments. We determined that this sample size was reasonable to balance logistics (i.e. time and expense) and the ability to detect a difference; standard errors computed from our data suggested an adequate statistical power to detect differences. The solvents tested (methanol, ethanol, acetonitrile, diethyl ether, chloroform and acetone) were HPLC-grade (Fischer Scientific, Fair Lawn, NJ). The pH experiment was performed in methanol with added hydrochloric acid or sodium hydroxide (Fischer Scientific, Fair Lawn, NJ). The benzoic acid experiment was performed in methanol with added benzoic acid (Fischer Scientific, Fair Lawn, NJ).
GCMS
For the mass spectrometric determination of the breakdown products, a gas chromatograph (Agilent Technologies 6850) coupled with a mass spectrometer (Agilent Technologies 5975C) were used. A sample of atranorin standard in methanol, where the breakdown products were observed using HPLC, was injected onto an HP-5MS 5% Phenyl Methyl Siloxane capillary column (30 m×250 µm×0·25 µm nominal) using helium at a flow rate of 1 ml min−1 as carrier. The initial temperature of the column was 100 °C which was held for 5 min, after which it was increased to 250 °C at a rate of 25 °C min−1 and held for 10 min. The column temperature was then increased to 300 °C at a rate of 20 °C min−1 and held for 6 min. The total runtime was 29·5 min. The mass spectrometer was set to scan between 50 and 500 after a solvent delay of 1 min. The NIST/EPA/NIH Mass Spectral Library version 2.0d (built 2 December 2005) was used to determine the identity of unknown compounds.
Fresh lichen samples
Physcia adscendens samples were collected from the Dixie National Forest near Brian Head, Utah (38·18534°N, 111·17883°W) on 4 October 2013. Samples of H. physodes were collected by B. McCune from Chichagof Island near Sitka, Alaska (57·5229°N, 135·1875°W) during August 2013. TLC was used to identify compounds in fresh lichen samples. The leached samples were spotted onto a silica Selecto™ Flexible-Backed TLC Plate (Fischer Scientific, Fair Lawn, NJ) and run in a solution of 180 ml toluene, 45 ml 1-4 dioxane and 5 ml acetic acid for 30 min (Culberson Reference Culberson1972; Culberson & Johnson Reference Culberson and Johnson1982). For purification of atranorin from fresh lichen using TLC, we used a 75% hexane and 25% ethyl acetate solution. The dried plates were inspected under long and shortwave UV sources. Identification of compounds was carried out by comparing their measured retention factors (R f) to published values (Arup et al. Reference Arup, Ekman, Lindblom and Mattsson1993) in solvent A, and also by comparison with a control lichen sample. The spots were scraped off the plate and analyzed separately by HPLC to identify the peaks. Retention times of these isolated peaks were compared to the fresh leached samples to identify atranorin among the other compounds present.
In the fresh lichen extract experiment, atranorin was analyzed in two ways. First, lichen fragments, ranging in mass from 7–14 mg, were leached in 1 ml acetonitrile for 1 h. Following the addition of benzoic acid as an internal standard, this solution, which contains naturally occurring atranorin and any other compounds present in situ in lichens, was analyzed by HPLC using the protocol described earlier. This measure represented the initial, raw levels of the ratios of atranorin:benzoic acid in leached fresh lichens. The sample was dried under a stream of dry nitrogen, resuspended in methanol and then quantified again by HPLC c. 10 min after resuspension. Second, to remove potential confounding effects of other compounds present in the leached sample, we also prepared a purified sample of atranorin from fresh material. Using TLC, the atranorin spot was scraped off the plate and resuspended in methanol. An aliquot of this purified fresh lichen extract was analyzed by HPLC.
Other solvents
Although hexane has been reported in the literature as a solvent used for extracting atranorin (Bugni et al. Reference Bugni, Andjelic, Pole, Rai, Ireland and Barrows2009), we opted not to include it as a solvent in our analyses. This decision was based on the low solubility of atranorin in hexane; 4 mg of atranorin never completely dissolved in the 25 ml of hexane, suggesting that hexane would not be as effective as the other solvents for extracting atranorin from lichens (Table 1). Similarly, we chose not to test toluene due to its toxicity and the last documented use in this capacity being half a century ago (Rao & LeBlanc Reference Rao and LeBlanc1965).
Statistical analysis
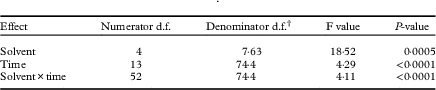
To quantify atranorin stability or degradation over time, we modelled the area under the atranorin response curve from the chromatogram at each given time interval. Three replicates were run of all conditions in each experiment. A repeated measures split-plot design was used to describe atranorin response in SAS 9.3. Separate analyses were run for each experiment. In the pH and solvent experiments, the whole-plot factor was solvent or pH and the split-plot factor was time. The interaction effects between solvent and time, and pH and time, were the main foci of this study. In the benzoic acid and purified fresh lichen experiments, time was the only independent variable. For the leached fresh lichen experiment, we again used a repeated measures split-plot design with species as the whole-plot factor and time as the split-plot factor. Due to potential correlation between repeated measures, the best correlation structure, as determined by the Akaike Information Criterion, was the first-order autoregressive model. Tukey’s post hoc procedure was used to make pairwise comparisons between atranorin concentrations at every time period in all experiments.
Results and Discussion
Solvent experiment
Commercial atranorin standard was found to have varying solubility (Table 1). In the solvent experiment, atranorin concentrations changed with time and, more importantly, the solvent×time interaction supports the variation in solvent induced breakdown of atranorin with time (Table 2).
Table 2 First-order autoregressive model test results for fixed effects in solvent experiment

† Adjusted using Satterthwaite’s approximation, appropriate for repeated measures designs.
Breakdown in methanol and ethanol
Atranorin had very low solubility in methanol and ethanol (Table 1), both polar solvents, which is likely owing to the semi-polar nature of the molecule. Using HPLC to detect a change in the concentration of atranorin over 16h, we found that in these two solvents the atranorin concentration was significantly higher at 0 and 15 min compared to 30 through to 960 min, indicating its breakdown or transformation into another compound. Despite this initial change, the atranorin concentration had stabilized by 30 min and its concentration was not significantly different thereafter (Fig. 1 A & B).
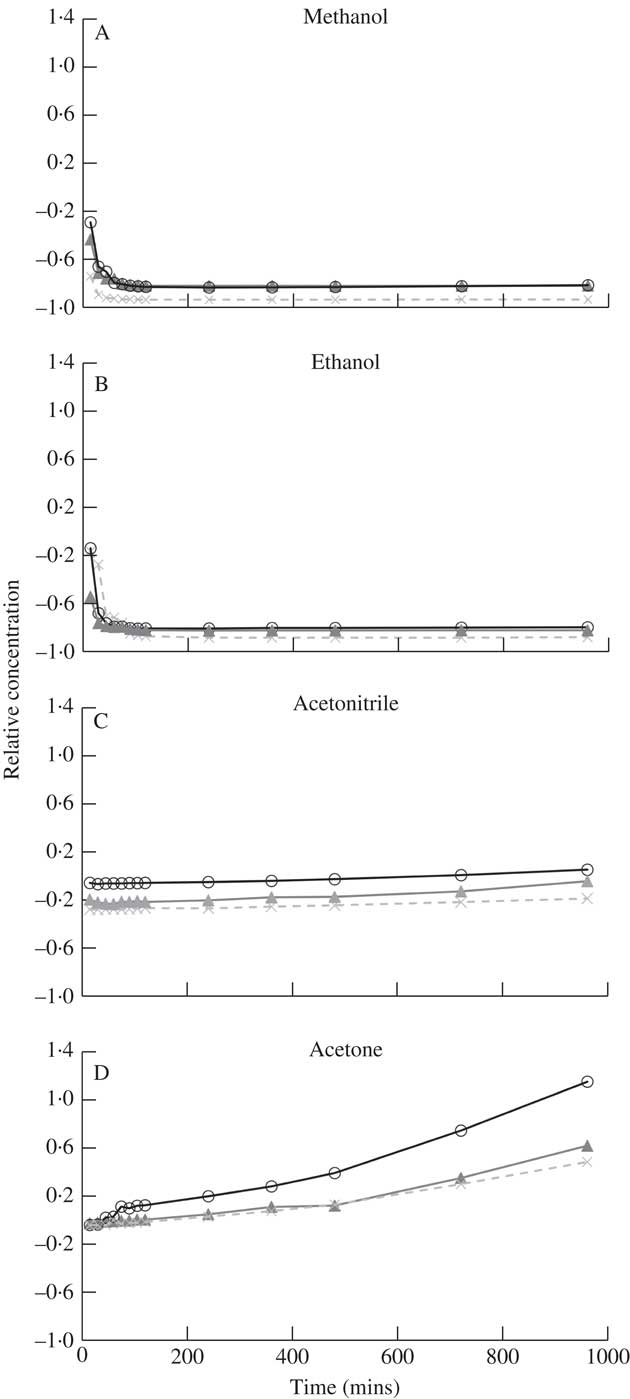
Fig. 1 Time dependent change in relative concentration of atranorin in methanol (A), ethanol (B), acetonitrile (C) and acetone (D). Relative concentration is the change in concentration expressed as a fraction of the concentration at time zero (i.e. (x t – x 0 )/x 0 ). Raw values were used in analyses but standardized values are presented here to show similarity among the three replicates (open circles, closed triangles and crosses).
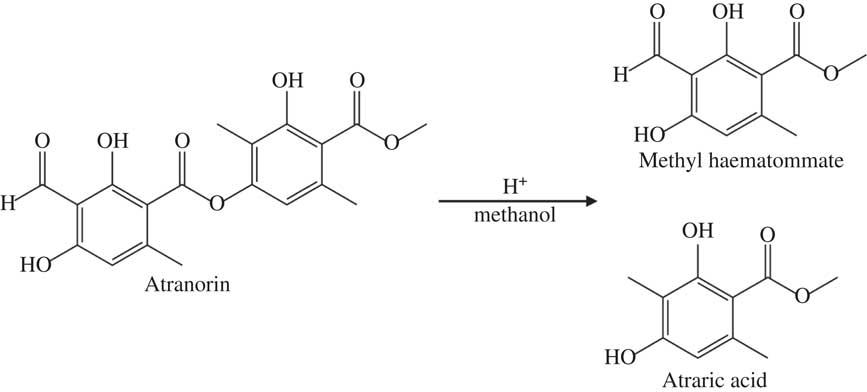
Marante et al. (Reference Marante, Castellano, Rosas, Aguiar and Barrera2003) suggest that atranorin breaks down via hydrolysis or transesterification. In an alcohol, such as methanol or ethanol used here, transesterification is more likely than hydrolysis because it only needs an acid catalyst, which atranorin itself can provide, and one reactant is also the solvent (Fig. 2). The atranorin breakdown observed in methanol and ethanol via this process is significant and occurs within 15 min of extraction. According to the literature, methanol is the second most commonly used solvent for atranorin extraction (Table 1), yet the breakdown demonstrated here suggests methanol may be a poor choice prior to HPLC analysis. The breakdown products of atranorin standard, however, appeared c. 24 h later, suggesting that there is an intermediate product that we were unable to detect before this time with the diode array detector at 272 nm.

Fig. 2 Proposed mechanism of atranorin breakdown in methanol through transesterification.
Interestingly, the atranorin solution turned light yellow after dissolution when using methanol and ethanol as solvents for both the standard and natural lichen extracts. This yellow colour appeared before breakdown peaks were observed by HPLC. This colour change might reflect the formation of the intermediate mentioned above underlying the breakdown process. Alcohols can deprotonate acids, but most in very small quantities. We suspect that the deprotonated form of atranorin may be an intermediate in the formation of a conjugated pi electron system that exhibits a yellow colour. Furthermore, the yellow colour disappeared if an acid was added to the alcohol-based atranorin extract, which could be due to acid protonation of the deprotonated form of atranorin. Additionally, the yellow colour change was more intense with the addition of a strong base compared to extracts in methanol or ethanol alone. This reaction clearly relates to the commonly used ‘K test’ for taxonomic purposes, in which atranorin in solution turns yellow in the presence of potassium hydroxide. Huneck (Reference Huneck1973) suggests that atranorin’s ester linkage is hydrolyzed in aqueous KOH but the structures of the resulting coloured potassium salts are not known (Santesson Reference Santesson1973).
Breakdown in acetonitrile and acetone
Atranorin was soluble in both acetonitrile and acetone (Table 1) although no yellow colour was observed. It was also stable in both solvents although more so in acetonitrile (solvent×time effect for each of these two solvents at all times P ≥0·07; Fig. 1 C & D). Analysis by HPLC demonstrated that the concentration of atranorin in both these solvents increased over time owing to solvent evaporation, but not significantly. Acetone has a higher vapour pressure than acetonitrile (30·6 kPa and 11·8 kPa at 25 °C, respectively), which accounts for the larger observed change in concentration in acetone over time, although the change was not statistically significant (P >0·05).
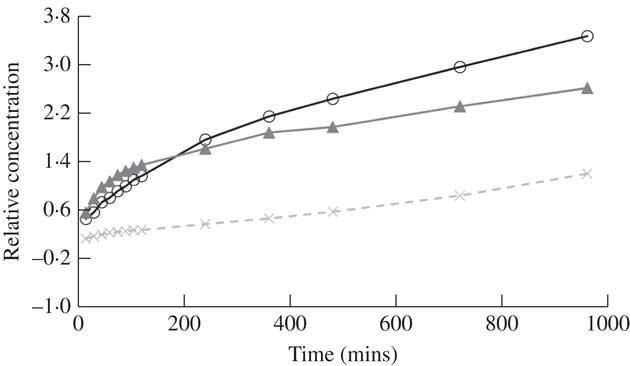
Fig. 3 Relative concentration of atranorin over time in diethyl ether. Relative concentration is the change in concentration expressed as a fraction of the concentration at time zero (i.e. (x t – x 0 )/x 0 ). Raw values were used in analyses but standardized values are presented here to show similarity among each of the three trials (open circles, closed triangles and crosses).
Breakdown in diethyl ether
The solubility of atranorin was greater in diethyl ether than in either methanol or ethanol but similar to the solubility in acetonitrile and acetone; however, the concentration of atranorin in diethyl ether increased significantly over time (Fig. 3). The rate of increase was highest in the first 15 min and then slowed down gradually over time. Diethyl ether is even more volatile than acetone, with a vapour pressure of 58·8 kPa at 20 °C (Table 1), thus we suspect that this solvent evaporated over time, concentrating the atranorin sample. Although atranorin did not seem to break down in diethyl ether, it is not a favourable solvent for atranorin studies because its extreme volatility concentrates atranorin at a rate that is not constant over time. Furthermore, diethyl ether is highly flammable and decomposes to explosive peroxides in air and light.

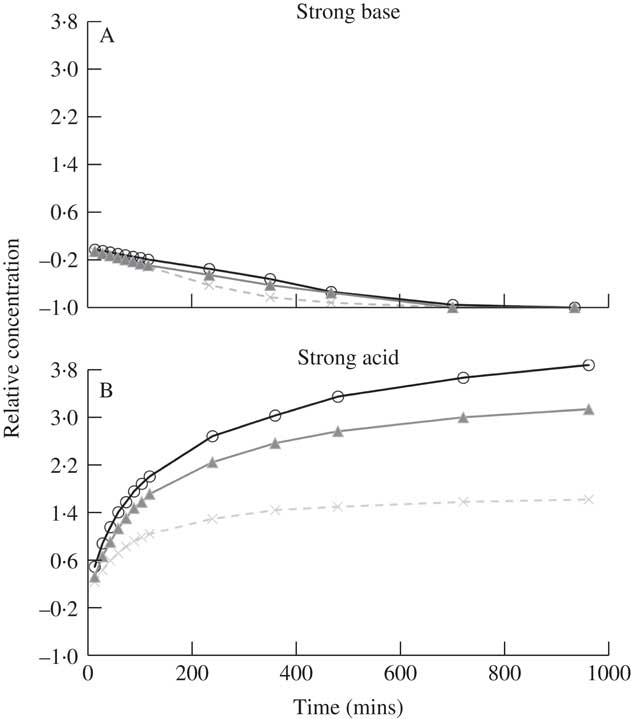
Fig. 4 Relative concentration of atranorin over time in methanol with the addition of strong base (A) or strong acid (B). Relative concentration is the change in concentration expressed as a fraction of the concentration at time zero (i.e. (x t – x 0 )/x 0 ). Raw values were used in analyses but standardized values are presented here to show similarity among each of the three trials (open circles, closed triangles and crosses). The range of the y-axis is comparable to that in Fig. 3.
Breakdown in chloroform
Of all the solvents used in this study, chloroform was the most effective in solubilizing atranorin. While no yellow colour was observed, we found a split peak for atranorin in the chromatography which requires further investigation. It was decided to disregard chloroform as a solvent due to time and budget constraints, and because no consistent relationship was obtained for atranorin stability over time.
Summary of solvent experiment
In summary, although rarely reported in the lichen literature, breakdown of atranorin clearly occurs in solution, most notably when methanol and ethanol are used as solvents. Atranorin breakdown in polar protic solvents, however, is not universal. Exploratory runs using 1-propanol as the solvent did not yield similar atranorin breakdown, perhaps owing to steric hindrance (i.e. the large size of the propanol molecule prevents it from coming within close proximity of the ester to react). Marante et al. (Reference Marante, Castellano, Rosas, Aguiar and Barrera2003) previously documented breakdown but were unclear whether atranorin and chloroatranorin breaks down via hydrolysis or transesterification. Meanwhile Bossi et al. (Reference Bossi, Rastogi, Bernard, Gimenez-Arnau, Johansen, Lepoittevin and Menné2004) and Hiserodt et al. (Reference Hiserodt, Swijter and Mussinan2000) showed that atranorin breaks down in the presence of ethanol to ethyl haematommate through transesterification and to atranol through decarboxylation. Stojanovic et al. (Reference Stojanović, Radulović, Mitrović, Stamenković and Stojanović2011) also found high concentrations of atraric acid and methyl haematommate in fresh samples of lichens known to contain atranorin. We suggest that the observed breakdown of atranorin in methanol yields atraric acid and methyl haematommate by transesterification (Fig. 2). This hypothesis was supported by the results of mass spectrometry. Breakdown products of this reaction matched the compound library as benzoic acid, 3-formyl-2,4-dihydroxy-6-methyl-, methyl ester (also known as methyl haematommate) and benzoic acid, 2,4-dihydroxy-3,6-dimethyl-, methyl ester (or atraric acid).
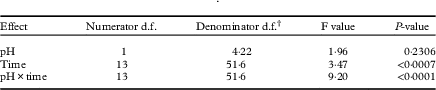
pH experiment
Addition of a strong base
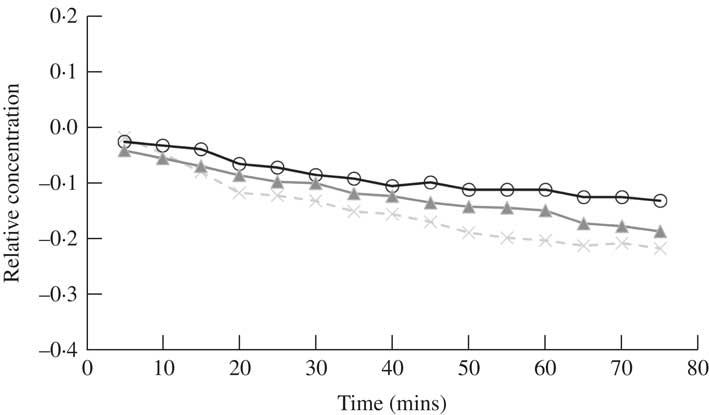
Since transesterification needs an acid catalyst, and atranorin with its phenol groups serves in this capacity, we sought to neutralize the slight acidity of atranorin. By the addition of a strong base, the catalyst would react with the base instead of the carbonyl group of the ester in atranorin, stopping transesterification. Trials were conducted with atranorin in methanol with the addition of a strong base to test this hypothesis. Methanol was used as the solvent because of the frequency of its use in previous research (Table 1). Atranorin levels decreased significantly in methanol with added base (Table 3, Fig. 4A): there was a significant decrease in concentration after four or five time intervals of 60 or 75 min and no atranorin remained after 12 h (Fig. 4A). The breakdown products of atranorin under these conditions also appeared soon after the addition of a strong base and gradually increased. The significant decrease in atranorin levels over time supports saponification as its breakdown mechanism here. The saponification breakdown products did not match either transesterification breakdown products or atranorin, suggesting that atranorin is degraded beyond recognition and that its breakdown differs from transesterification. We postulate the strong base reacts with more than just the ester bonds, creating various other compounds.
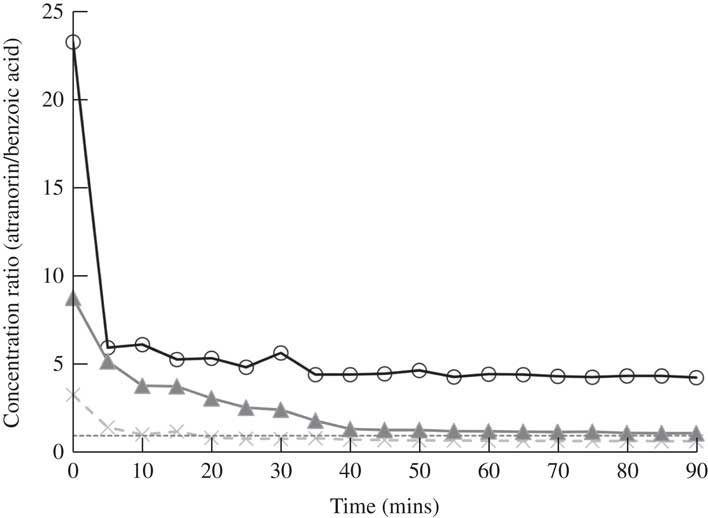
Fig. 5 Change in the ratio of atranorin to benzoic acid concentrations with time using methanol as a solvent. Perfect covariance of these two compounds over time is a ratio of 1·0 (dashed line). Raw ratio values are presented to show similarity among the three replicates (open circles, closed triangles and crosses).
Table 3 First-order autoregressive model test results for fixed effects in pH experiment

† Adjusted using Satterthwaite’s approximation, appropriate for repeated measures designs.
Addition of a strong acid
With the addition of strong acid, the rate of the transesterification would likely increase and equilibrium would then be reached faster. However, a significant increase in atranorin concentration was observed over time (Fig. 4B). While it is probable that low pH affects the solubility of atranorin and this may explain the general increase in atranorin levels with time, the mechanism of this reaction needs further investigation. Trends similar to those above were found when a strong base or strong acid were added to atranorin extracted in acetonitrile (i.e. atranorin degradation and increased concentration with time, respectively). The addition of a weak base (e.g. triethylamine) may inhibit transesterification more than that observed with a strong base, and future research in this area is also required.
Comparison between solvent and pH experiment results
In summary, we observed the breakdown of atranorin under two different experimental conditions; using methanol and ethanol as solvents, and in the presence of a strong base. We propose two mechanisms for the breakdown of atranorin, transesterification using methanol and ethanol, and saponification on the addition of a strong base. Transesterification takes place in the presence of an acid catalyst and an alcohol, and is a reaction that reaches equilibrium. Saponification is a base-mediated reaction that breaks ester bonds until either the base or the compound containing the ester bond is depleted. Mass spectroscopy shows that the chemical structure of the atranorin breakdown products differ as a result of these two mechanisms.
Benzoic acid experiment
Many previous studies quantifying atranorin by HPLC have used benzoic acid as an internal standard (Huovinen Reference Huovinen1987; McEvoy et al. Reference McEvoy, Nybakken, Solhaug and Gauslaa2006; Nybakken & Julkunen-Tiitto Reference Nybakken and Julkunen-Tiitto2006; Solhaug et al. Reference Solhaug, Lind, Nybakken and Gauslaa2009). The molecular structure of benzoic acid is dissimilar to atranorin which suggests that they will not behave in the same way and indeed benzoic acid did not break down in various solvents, while atranorin clearly did. If benzoic acid and atranorin degraded equally, we assumed that the ratio of the two compounds would remain constant in a mixed solution. However, in methanol, the concentration ratio of atranorin to benzoic acid was significantly higher at time 0, relative to all other time periods (P≤0·03; Fig. 5). Therefore, using methanol as a solvent, benzoic acid failed to capture the breakdown of atranorin that was clearly occurring in the first 5 min (Fig. 5). Hence, benzoic acid can only reliably serve as an internal standard when acetonitrile or acetone is used to extract atranorin, when the solvent does not contribute to atranorin breakdown.

Fig. 6 Time dependent changes in the relative concentration of atranorin in methanol extracted from fresh material of Physcia adscendens using the TLC spot isolation method. Relative concentration is the change in concentration expressed as a fraction of the concentration at time zero (i.e. (x t – x 0 )/x 0 ). Raw values were used in analyses, but standardized values are presented here to show similarity among the three trials (open circles, closed triangles and crosses). The range of the y-axis is narrower to better demonstrate the change compared to Figs 1 and 3.
Fresh lichen experiments
When atranorin was freshly isolated from Physcia adscendens, purified by TLC and re-dissolved in methanol its concentration was found to gradually and significantly decrease during a 70 min period of observation (F15,30=4·75, P<0·01) (Fig. 6). Although this rate of decrease was not as visually striking as that obtained for the atranorin standard (Fig. 1a), we expect broadly similar findings with atranorin purified with the TLC method when varying the solvent and pH, as well as using benzoic acid as an internal standard, to those with the atranorin standard.
Most lichen studies fail to purify the compound of interest when conducting ecophysiological research and simply use lichen extracts derived from leached specimens. The leached version of the fresh lichen experiment attempted to simulate these practices. Other compounds present in the lichen symbiosis might protect against chemical degradation of atranorin, which is why the authors of previous ecophysiological studies have not reported such degradation (L. Nybakken, pers. comm.). The present results support this hypothesis since we did not find significant changes in atranorin concentration over time when atranorin was stored in solution together with other lichen compounds (Table 4). Furthermore, the species×time interaction was not significant, suggesting that this result was similar for each of the two species tested, despite them containing different concentrations of atranorin (Table 4).
Table 4 First-order autoregressive model test results for fixed effects in leached fresh lichen experiment with Physcia adscendens and Hypogymnia physodes. Extracts contained atranorin and potentially other compounds leached from the thalli

Hypogymnia physodes was also tested using the leaching method for two reasons. First, other authors have used this species in ecophysiological studies involving analysis of atranorin without any reported problems concerning breakdown (Giez et al. Reference Giez, Lange and Proksch1994; McEvoy et al. Reference McEvoy, Nybakken, Solhaug and Gauslaa2006; Ranković et al. Reference Ranković, Kosanić, Manojlović, Rančić and Stanojković2014). Second, H. physodes contains a complex array of other secondary compounds (i.e. physodic acid, 3-hydroxyphysodic acid, physodalic acid, chloroatranorin and protocetraric acid) which might interact and prevent the degradation of atranorin. The lack of breakdown in these samples indicates that this may be a viable explanation. Physcia adscendens was also tested, a species that contains atranorin alone (Thomson Reference Thomson1984). We predicted that, given the paucity of other potentially protective compounds, the leached sample might also degrade over time. This hypothesis was not supported by our observations. It is perhaps possible that one or more metabolites that are released in the leaching process, yet removed by TLC separation, might aid in preventing breakdown of atranorin. Identification of this modifier or further clarification of this process is a clear direction for future research.
Conclusions
Although atranorin breakdown has been observed before (Hiserodt et al. Reference Hiserodt, Swijter and Mussinan2000; Marante et al. Reference Marante, Castellano, Rosas, Aguiar and Barrera2003; Bossi et al. Reference Bossi, Rastogi, Bernard, Gimenez-Arnau, Johansen, Lepoittevin and Menné2004; Stojanović et al. Reference Stojanović, Radulović, Mitrović, Stamenković and Stojanović2011), the present comparisons of breakdown rates by solvent and pH have clear implications for future practice with HPLC and atranorin. We were able to demonstrate the breakdown of atranorin as a purified standard (Figs 1A, 4A & 6), yet not when present in extracts of natural populations of lichens (Table 4). The instability of atranorin under certain conditions might have led to underestimations of concentrations in previous work where purified atranorin was used. This issue might not have been a problem previously because the standard practice is to leach specimens rather than isolate specific compounds. Moreover, extreme care should be taken when quantifying atranorin by HPLC as only two species were tested and it is not clear if other taxa will behave in the same manner.
This study can provide guidance for the refinement of successful laboratory practices to ensure reporting of more accurate atranorin concentrations. We recommend using acetonitrile or acetone as a solvent without a strong base or acid when quantifying atranorin concentrations by HPLC. Benzoic acid may be used as a suitable internal standard, but only under these conditions. The use of these experimental procedures can help lichenologists improve measurement of changes occurring in natural conditions as a reflection of treatment conditions (e.g. variations in UV light) rather than experimental error. Finally, this work underscores the need to further investigate metabolite breakdown in lichens that house understudied compounds.
The authors thank D. Heaton, C. Thulin and O. D. Petrucci for their early discussions on this project and two anonymous reviewers for their constructive comments. We acknowledge the Utah Valley University Scholarly Activities Committee grant for support to CV and CP.