


Introduction
Accurate and precise measures of growth and morphological changes in slow-growing crustose lichen thalli are difficult to obtain. Measures of true thallus area or shape are particularly unreliable if thalli are tiny, bumpy, have tiny hair-like ‘lobes’ or have coloration that closely matches the substratum. Sub-millimeter scale changes cannot be measured from pen and ink thallus tracings (e.g., Hale Reference Hale1959; Brodo Reference Brodo1965; Andrews & Webber Reference Andrews and Webber1969; Fisher & Proctor Reference Fisher and Proctor1978; Stone & McCune Reference Stone and McCune1990), but can sometimes be tracked by photogrammetric measures of repeated vertical photographs (e.g., Hooker & Brown Reference Hooker and Brown1977; Hawksworth & Chater Reference Hawksworth and Chater1979) or with the use of digital photographs and computer software (Table 1). However, as the variety of digital monitoring and measurement techniques increases, there is a lack of standardization in both the way that measurement data are obtained and the way that actual and potential errors are articulated. The result is that unknown and uncorrected errors are creeping into the literature as users and reviewers fail to recognize or quantify the systematic errors that may be involved with their research methodology. For example, when an image file is converted from a continuous grayscale or colour image format (e.g., JPEG or TIFF format) to a bitmap image, the grey or lighter parts of an image are lost (McCarthy & Zaniewski Reference McCarthy and Zaniewski2001). This very real source of measurement error sometimes goes unreported and unquantified (e.g., Jackson et al. Reference Jackson, Clair and Eggett2006; Bowker et al. Reference Bowker, Johnson, Belnap and Koch2008). Sometimes workers claim nominal accuracy and precision and provide readers with no evidence to support their claims. Rarely do we read about the challenges associated with the measurement method (e.g., shadows at the thallus margin, ability to repeat a measurement, etc.), thus it is sometimes unclear whether workers have recognized and quantitatively addressed important technical aspects of measurement methodology.
Table 1. Studies that have used digital images and computer software to measure lichen thalli
In the late 1970s, it was suggested that workers who are attempting to use repeated photographs to measure lichen growth should place a machined nut, a coin or a ruler adjacent to the thallus (Locke et al. Reference Locke, Andrews and Webber1979). It is not uncommon to see this approach still being used today (e.g., Jackson et al. Reference Jackson, Clair and Eggett2006; Bradwell Reference Bradwell2010). However, it is unclear what benefit this approach provides. At least three rulers or painted control points are needed to provide rudimentary planar, elevational and distance control. The placement of a single ruler or a machined nut along one side of a thallus and the ability to digitally overlay successive images with reference to rock crystals seen in each image (e.g. Bradwell Reference Bradwell2010, fig. 3) does not quantify, remove or reduce errors associated with tilted camera backs, topographic relief or errors in measurement. Measurements done in this way could be precise, but inaccurate. Ideally, orthorectification (removal of distortion) can be done by using computer software to warp (rubber sheet: stretch or compress) parts of the image so that the image correctly corresponds with the marked ground control points that surround the object of interest. If a rock facet is perfectly flat and the linear distances between each of the ground control points is known, a polygon of known dimensions can be formed using straight lines of known distance to connect the fixed reference points on the rock. This polygon provides scale that can be used to rectify distortion and calculate the accuracy and reproducibility of measurements on the planar surface. Lacking ground control points along both the X and Y axes and/or lacking software that can stretch or compress parts of an image, workers can test and report measurement reproducibility (e.g., Benedict Reference Benedict2008) or can calculate accuracy by using mathematical approaches to rectify parallax and other forms of distortion. If validated accuracy and precision data cannot be obtained we could claim a nominal error (e.g., ±0·01 mm), but this would be a guess.
The growth of Rhizocarpon lichens has been estimated and described in hundreds of lichenometric dating studies. The great majority of those studies have ‘calibrated’ growth by using indirect approaches that match the size of the largest individual(s) on a surface with the age of that surface (McCarthy Reference McCarthy and Elias2007). Occasionally, repeated measurement of diametric growth in a few mid-sized thalli has been used to estimate growth over the long-term and estimate the age of large thalli on old surfaces. In contrast, lichenological studies directly measure the growth of marked thalli. Those studies usually describe the growth of mid-sized thalli (e.g.,<50 mm diameter) because mid-sized thalli are readily available (Bradwell & Armstrong Reference Bradwell and Armstrong2007; Trenbirth & Matthews Reference Trenbirth and Matthews2010). Thus, only the growth of a few very small or very large Rhizocarpon thalli has ever been directly measured (Bradwell & Armstrong Reference Bradwell and Armstrong2007; Matthews & Trenbirth Reference Matthews and Trenbirth2011). While there is anecdotal evidence to characterize early growth and thallus development (Asta & Letrouit-Galinou Reference Asta and Letrouit-Galinou1995), we are unaware of any study that has attempted to systematically measure the areal growth rate of the tiniest of Rhizocarpon thalli (e.g., 0·25–5·00 mm2). This is understandable since measurement at the sub-millimeter scale must be done to close tolerances, and is especially challenging if workers do not have the expertise or the micro-survey equipment needed to carry out this sort of work. However, change in the establishment, growth and survival of young, small thalli should be of considerable scientific interest because monitoring these changes could provide insights into changes in ambient air quality or other environmental changes. This sort of research be done can only if workers are able to readily observe and accurately quantify microscopic changes in tiny thalli. Workers might also wish to investigate and quantify developmental changes in lichens that can be seen in archival photographs (e.g., Trenbirth & Matthews Reference Trenbirth and Matthews2010). This type of work might provide us with a way to test the accuracy of lichen growth curves and gain insight into how lichen communities evolve. Accordingly we have explored the use of a low-cost approach to digital photogrammetry in the hope of developing a systematic way to explore archival photographs and gain better insight into the growth of the yellow Rhizocarpon thalli that have long been used for lichenometric dating. In this paper we describe and critically evaluate the use of consumer grade digital cameras and software to investigate the growth of small Rhizocarpon thalli. We attempt to: 1) demonstrate how to use and critically evaluate the accuracy and reproducibility of Adobe® Photoshop® CS3 Extended software in a lichenological application; 2) provide a quantitative description of change in diameter, area and the perimeter of yellow Rhizocarpon thalli; and 3) develop and calibrate a preliminary model for the growth of small Rhizocarpon thalli that relates change in thallus area to time elapsed.
Materials and Methods
Material
Our data were derived from a time series of repeated macro-photographs of marked thalli at the Illecillewaet Glacier in the Selkirk Mountains of Canada's Glacier National Park, British Columbia (51°15·116′N, 117°28· 226′W). McCarthy (Reference McCarthy2003) reported on the radial growth of over 100 thalli at this site and described how digital calipers were used to measure growth (from 1996–2000) with reference to c. 6 fixed points per thallus. We have continued to take macrophotographs of marked lichens on a semi-annual basis and will now report on changes seen in 115 thalli that were growing on flat rock facets. Each thallus was closely surrounded by at least four painted fixed points and the distances between these points were measured in the field under ×4 magnification with calipers (accurate to 0·01 mm) (as reported by McCarthy Reference McCarthy2003). We have joined the fixed points with straight lines to form a polygon of points that surrounds each thallus and we have used these polygons to calibrate our planar (digital) measurements.
Three growth intervals were considered: one year (2006–2007), three years (2003–2006) and seven years (1996–2003) (Table 2). The mature thalli in our sample have nearly circular outlines and have distinct margins that are free of contact with others. Most of the smallest thalli (e.g., area <2 mm2) do not have circular outlines, but they are not in contact with other thalli and are morphologically distinct individuals.
Table 2. Number and sizes of thalli measured in each study interval
In the summer of 1997, some of the largest thalli at this site were examined in situ and were identified to section level by microscopic examination of spores and the use of reagents. The reagents were applied sparingly and were quickly blotted with a tissue. Where an apothecium was removed to permit the microscopic examination of spores, the resulting damage was minimal (e.g., 2 mm diameter) and had healed by the summer of 2006. Based on the identification of the large thalli, we believe that all of the thalli in our sample belong to the Rhizocarpon group and most at this site are Rhizocarpon geographicum (L.) DC.; none are Rhizocarpon lecanorinum as was reported incorrectly by McCarthy (2003).
Photography
The macro-photography was carried out with a variety of film and digital camera systems. Our oldest images were derived from colour negatives that were exposed on July 4 1996 using a Canon F1 camera and a 100 mm f4.0 Canon bellows lens. The negatives were scanned with a Minolta Dimage Scan Dual II film scanner producing digital files with 3864×2616 pixel resolution. Digital single lens reflex cameras were used in the summer of 2003 (Canon EOS 20D and 60 mm Canon EF-S macro lens, 3504×2336 pixels) and in August of 2006 and 2007 (Canon EOS 450D and 60 mm Canon EF-S macro lens, resolution 4274×2848 pixels). Film and digital images were captured at ISO 100 and the digital images were saved as Canon camera raw files. These files were opened and adjusted using Adobe® Photoshop® CS3 Extended software (Adobe Systems Inc., San Jose, CA). The Canon camera raw images were cropped and white balance was set to 5800 °K. Images were individually adjusted for exposure, colour saturation, contrast and sharpness to ensure that thallus-rock boundaries were clearly visible. Post-exposure digital image adjustments and all measurements were made using a personal computer with an Intel® Core 2 Duo® processor running at 2·2 GHz with 2GB of RAM, Macintosh® OS X, version 10.5.2, operating system and an LCD display set at 1400×900 resolution. All images were saved and analyzed as 16-bit Tagged Image File Format (TIFF) files. Statistical analysis was carried out and graphs were produced using Microsoft® Office Excel 2003 (Microsoft, Redmond, WA) and SigmaPlot® for Windows, version 10.0 (Systat Software, San Jose, CA). Adobe® Illustrator® CS5 (Adobe Systems Inc., San Jose, CA) software was used to create the polygons that were used to calibrate the accuracy of areal measurements.
Areal measurements
One person took all the measurements while viewing the images at an appropriate magnification (e.g., 300–400% magnification) in Adobe® Photoshop® CS3 Extended software. The 2006 images were first scaled to ensure that distances in the image very closely matched the polygonal network of straight line distances that surround the thallus perimeters. This was done using the ‘Free Transform’ and ‘Warp’ tools, the ‘Ruler’ tool and by adjusting the image width and height values. Often the perimeter distance was a very close match with the field measurements, but the polygon width could not be perfectly matched with the field data. Thus we could demonstrate that thallus perimeter and thallus area were very accurately preserved, but thallus shape and distances across the thalli could not be rectified in all cases. Accordingly, in the following sections we describe how the field and image polygon width data were used to estimate our errors in measurement.
Once the 2006 base image was scaled to match the perimeter of the polygon of fixed points, the 2007 image was opened, placed on a separate image layer and oriented so that it aligned with the fixed points in the 2006 image (Fig. 1). The ‘Warp’ command was then used sparingly to align, stretch and/or compress parts of the 2007 image. This process was repeated for the 2003 and 1996 images. When properly aligned with the perimeter of fixed points, the images showed no distortion within the polygon of fixed points. At this stage we knew that measures taken along the perimeter line were accurate. Blurred pixels and misaligned rock crystals outside of the perimeter line showed where the rock surface was curved or where there were bumps and depressions above and below the focal plane. Although our image sets were sharply focused and the rock crystals seemed to be correctly aligned, further testing was needed to establish the accuracy and precision of areal and linear measures.
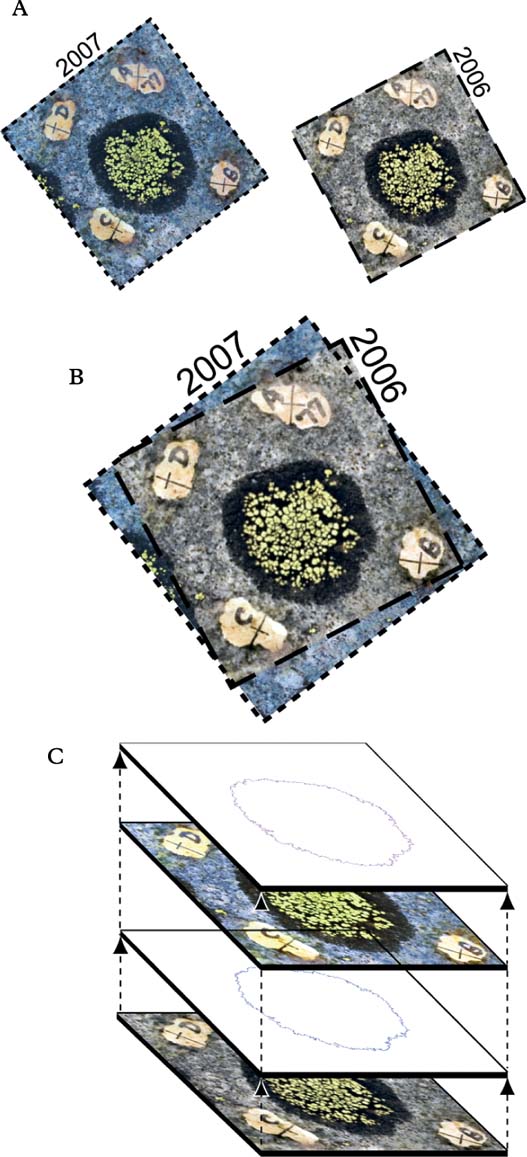
Fig. 1. Superpositioning of two images. A, cross-hairs were painted on the rocks and calipers were used to measure the distances between these fixed markers. Digital images were obtained in different years (1996, 2003, 2006, 2007); B, the series of photographs were scaled and aligned so that the painted markers on the rocks perfectly overlapped in the images; C, thallus outlines were traced using the ‘Pen’ tool in Adobe® Photoshop® CS3 Extended software.
Accordingly we examined the contrast and sharpness of the thallus margins and explored a variety of approaches that we thought might allow us to objectively identify and measure pixels that represented lichen tissue. Under high magnification, we saw that the Rhizocarpon thallus to rock boundary in our images was a tonal transition where pixels representing an evenly illuminated thallus were about 20% darker than pixels seen in smooth quartzite (Fig. 2). We tried, but were unable to train the software to identify and select only those colours and pixels that were associated with Rhizocarpon thalli in these images. Consequently, delineation of the thallus margin was done manually. This involved a close inspection of the thallus-rock tonal transition and the manual marking of each thallus perimeter using the ‘Pen’ tool (set to a width of 1 pixel, ≤0·01 mm). The area inside the thallus perimeter was then selected with the ‘Magic Wand’ tool to allow the pixels in these areas to be placed on a separate image layer and be measured with the ‘Ruler’ tool. The reproducibility of thallus perimeter delineation, therefore, was a critical part of our measurement process. Perimeter delineation was especially challenging because inclusion or rejection of only a few pixels that were slightly darker or lighter than the perceived ‘target’ could make a big difference when we were measuring tiny thalli. Accordingly, perimeter delineation and thallus area measurement were repeated twice, on separate days, for each thallus. We averaged the two measures and will report the accuracy and precision of these data in the following sections.
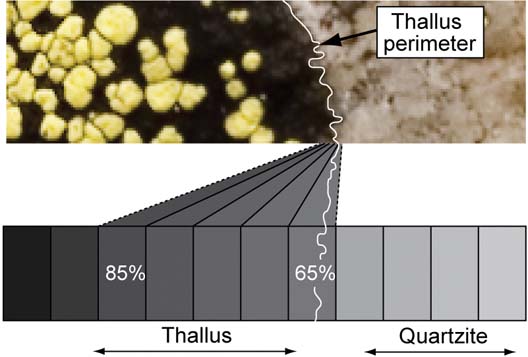
Fig. 2. A tonal contrast marks a gradual transition between the dark coloured thallus and the lighter coloured rock. Even though colour, temperature and contrast were standardized, we were unable to train the software to recognize and automatically select thalli. Instead, the operator manually identified thallus outlines using colour and tone (65 to 85% black) as the distinguishing criteria.
Eight measures of thallus diameter (thallus width) were collected for each thallus in each image of the one, three and seven year photo pairs. Diameter was measured along a radial grid of 16 evenly spaced radii that was positioned by eye at the approximate centre of each thallus (Fig. 3). Smaller thalli (<5 mm diameter) were measured at regular intervals (every 22·5°) using the ‘Ruler’ tool anchored at the approximate centre of the thallus. Our diametric change (diametric growth) data set includes positive, negative, net and percentage changes in diameter. When widely differing values were obtained on different radii, these radii were revisited and remeasured to confirm the results.
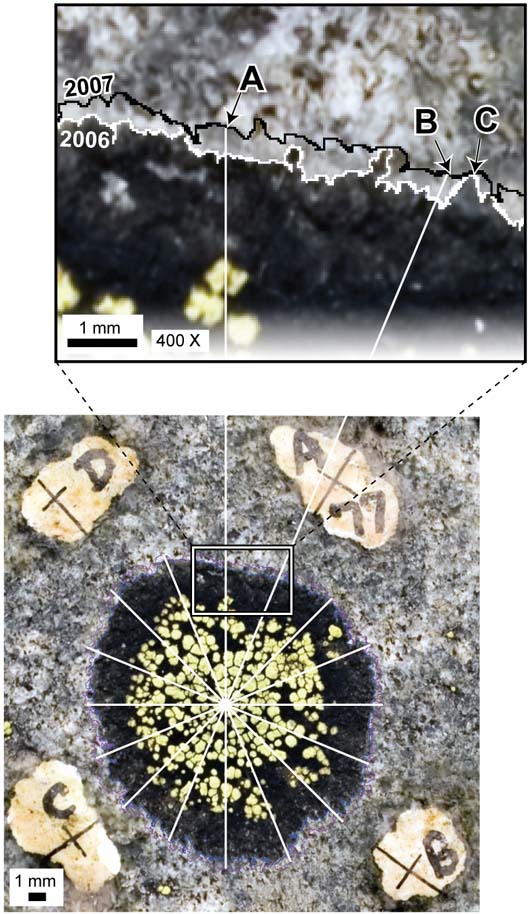
Fig. 3. The radial measurement grid. The grid was used to obtain 8 measures of thallus diameter. Use of a measurement grid helps to reduce operator bias and ensures that a regular sample is collected.
Estimation of scaling errors
The polygon formed by straight line joins of the fixed reference points around each thallus was never an identical match to the polygon shown in the superimposed images, and the distances between all points on opposite sides of thalli (polygon widths) were not known in every case. However, we used the mathematical difference between the areas and perimeters of the ‘field’ and the ‘image’ polygons in a subset of our images to estimate the accuracy of our linear and areal measurements (Table 3). These data show that linear distance and reproducibility of areal measures exceeded 98% in all cases. However, it is possible that our ‘field’ and ‘image’ polygons have the correct perimeters and areas, but do not have the correct width or shape. We investigated differences in width and shape by examining 25 polygonal plots with areas of 189–1533 mm2 and covering 1·48 m2. Adobe® Illustrator® software was used to form reference polygons that had the correct field dimensions. The polygons were compared with image polygons that had correct perimeters, but uncorrected widths. The mean difference between these polygons was 1·02% ± 1·62% standard deviation. This established the accuracy of our scaling, but did not reveal the source of the inaccuracies (e.g., micro-topographic relief, clerical errors, field measurement error).
Table 3. Accuracy of distance and area measures in superimposed images
Estimation of operator errors
The ‘Pen’ tool was used to manually define the edge of the objects measured. Reproducibility should be high because there is a clear contrast in colour where the black hypothallus of a Rhizocarpon thallus meets the light coloured rock. We assessed measurement reproducibility (precision) by doing 15 repeated areal measures of thallus area and perimeter in each of 27 thalli of various size classes (0·18–764·89 mm2) on 15 different days. Each measurement was done without consulting the previous results. Thalli used in this test broadly represented all size classes and the same person who performed this test also made all of the measurements reported in this paper.
We expressed precision as the percentage by which each of 15 measures differed from the mean. Measurements were considered to be precise if all 15 measures were within ±5% of the mean. In Fig. 4A, each vertical bar represents a single thallus with each of 15 measures displayed as a tick on the bar. Mean measurement reproducibility for thallus area exceeded 95% (P>0·05) in each of the 27 thalli and was almost perfect (99% reproducibility) in the larger thalli. Figure 4B shows that thallus perimeter was also a highly reproducible measure with mean reproducibility >96% in all cases. No clear trend was apparent between the reproducibility of thallus perimeter measurements and thallus size.
Fig. 4. Reproducibility of thallus measurements, each point represents 15 repeated perimeter tracings and areal measurements of the same thallus done on different days. A, area, mean measurement reproducibility exceeds 95% (P>0·05) in each of the 27 thalli; the lower limits of reproducibility range from 89–99% with high reproducibility found in large thalli and lower values found in tiny thalli (mean area ≤3 mm2); B, perimeter, mean reproducibility ≥96% in each case, the lower limits of reproducibility range from 87 to 99%.
Results
Change in thallus size
Figure 5 and Table 4 present thallus areal growth data for all three intervals. Linear regression of thallus size (mm2) against the mean change in area (mm2) shows a strongly positive correlation (R 2=0·94, 0·93 and 0·89) indicating that areal growth rate increases with thallus size. When the data are standardized to an annual rate, the regression lines overlap and show that the areal growth trend was similar in all growth intervals. Overall, the annual areal growth of small thalli (<30 mm2) was highly variable (12–105% change in area per year), but dropped to <10% in thalli that were >30 mm2 (Fig. 6, Table 5).
Fig. 5. Scatterplots showing linear regression of thallus size (mm2) against mean change in area (mm2) for all three growth intervals (▴ 1 year – – –; ▪ 3 year —; • 7 year - - - -). Strong correlation coefficients and linear regression lines with a positive slope indicate that areal growth slows as lichens increase in size (A). When growth is normalized to one year (B) all regression lines overlap indicating that growth trend is similar regardless of the growth interval. Table 4 provides the correlation coefficients and additional data.
Table 4. Details of change in area for Rhizocarpon geographicum thalli.
Fig. 6. Scatterplot showing mean initial area (mm2) against mean percent change in area (mm2) for all three growth intervals (• 1 year; ▪ 3 year; ▴ 7 year). Mean initial area is the mean thallus area at the start of the growth interval. The growth of each interval was standardized to one year to allow comparison. A, represents all thalli; B, represents only small thalli (<100 mm2). (See companion Table 5).
Table 5. Details of change (%) in area for Rhizocarpon geographicum thalli (companion Table to Fig. 6). Represents data standardized to one year
Annual diametric change (Fig. 7A), as measured at 8 diameters per thallus per interval, showed that high variability in diametric growth was very common and no single diameter well-represented diametric growth in any thallus. This was most evident in the one year data set (2006–2007) where net positive growth was found in every thallus, but 78% of the thalli had both positive (up to 4·40 mm yr–1) and negative (up to −1·96 mm yr–1) diametric change. When the mean change in 8 diameters per thallus was plotted against the mean initial diameter per thallus, a trend was weakly defined (R 2=0·37–0·49) by a 3rd order polynomial equation (Fig. 8B). However, when diametric change was expressed as a percentage (Fig. 8), we found high relative diametric growth rate in the smallest thalli (mean initial diameter <5 mm) and lower variability when thallus diameter was ≥5 mm. This suggests that the long-term shape of a growing Rhizocarpon thallus margin may be apparent when a thallus is c. 5 mm in diameter.
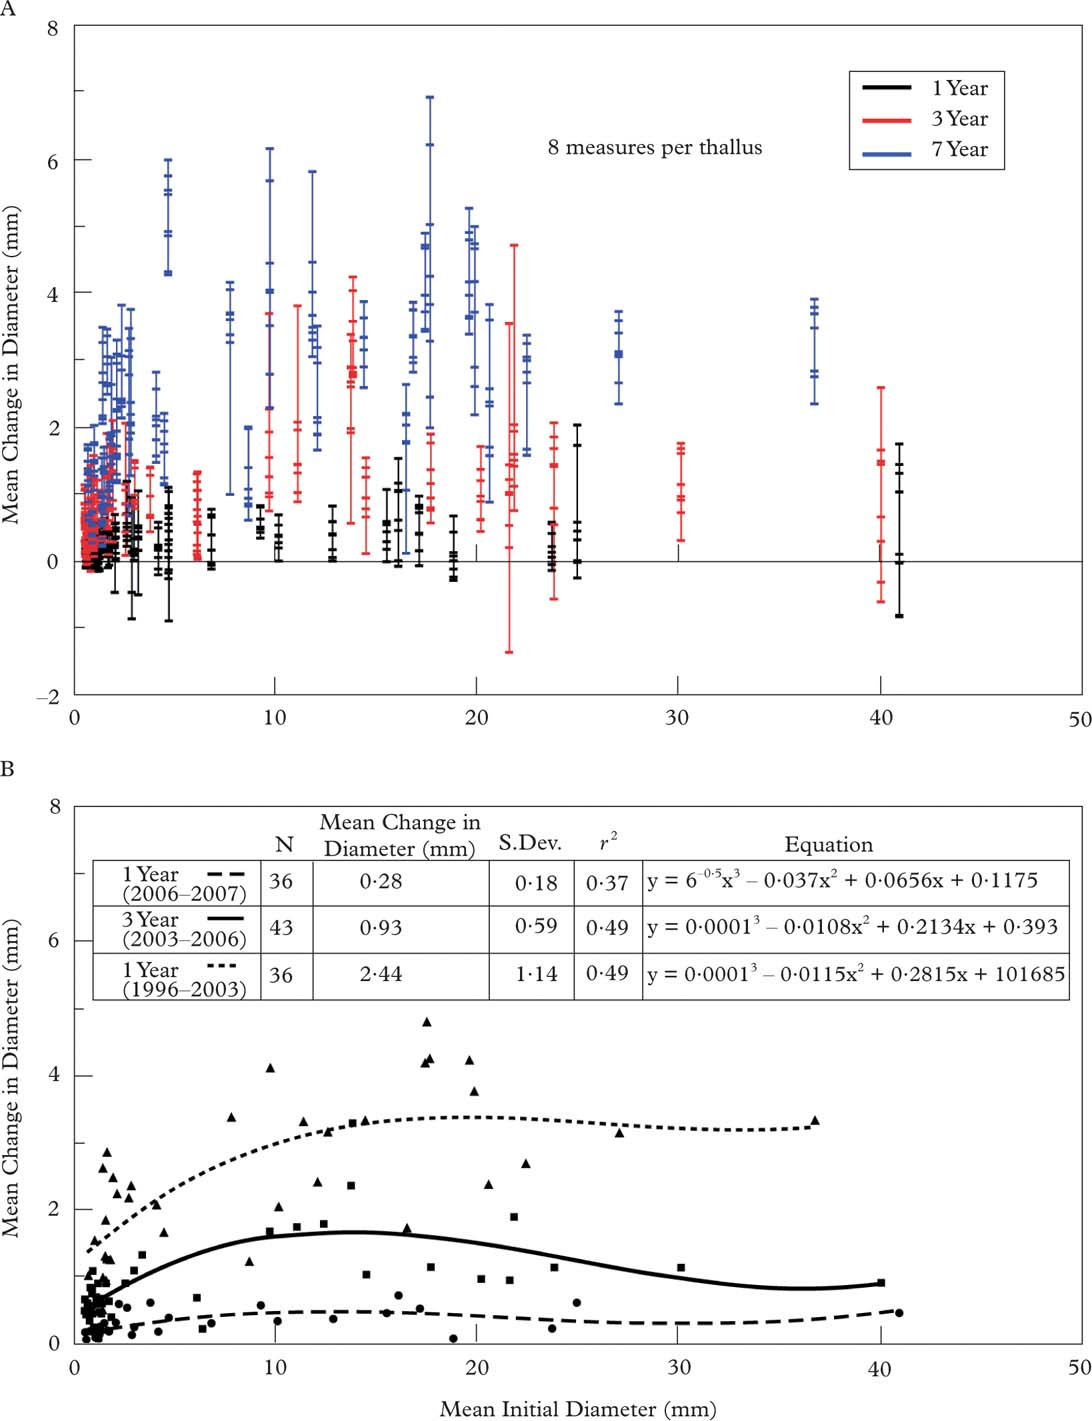
Fig. 7. Scatterplot showing the annual change in diameter in relation to the mean initial thallus diameter for the one, three and seven year intervals. A, each bar represents the mean diameter for a single thallus while points within the bar show the change in diameter at eight points around each thallus; B, the mean change in thallus diameter plotted against the mean initial thallus diameter.
Fig. 8. Percentage change in thallus diameter for all three growth intervals. A, 1 year; B, 3 years; C, 7 years. Each bar represents the mean diameter for a single thallus. The points within each vertical bar represent the percent change in diameter at eight locations around the thallus. In all growth intervals the percent change in diameter is highly variable in small thalli (<5 mm). As thallus size increases beyond 5 mm the percent change in diameter becomes more constant around the entire thallus.
Discussion
We have demonstrated that it is possible to use consumer-grade cameras and software to develop accurate and precise planar measures of growth in Rhizocarpon thalli. Our measurements were accurate and precise to the sub-millimeter scale and we showed how it is possible to measure growth in a systematic manner. Repeated measures of diametric change along a fixed grid clearly showed that diametric growth is highly variable within and between thalli. This variability was greatest in tiny thalli where the thallus margins were a jagged edge of finger-like branches. Larger thalli had smoother margins and lower variability in diametric change. We note that variability in the diametric growth of Rhizocarpon thalli has seldom, if ever, been quantified for tiny (<5 mm2) Rhizocarpon thalli. Unlike repeated measures of thallus area, measurement of change at one location on a thallus margin does not mean that this change was uniform around the entire thallus perimeter. Thus, when growth is measured relative to a few fixed points we do not generate as robust and useful a measure as we might produce if we were to measure thallus area. We therefore encourage workers to abandon the use of rulers and calipers as the sole means of measuring thallus size and adopt digital approaches that will allow them to generate accurate and precise measures of change in lichen photographic time series. Lacking validated data sets for various crustose species, we do not yet know with certainty that high variability in the areal growth of small thalli is specific to the individuals examined in this study, or is a characteristic of crustose lichens in general. Precise, but inaccurate data sets could also be used to shed light on this issue. Unfortunately, precise but inaccurate measures of areal growth would not provide a definitive test of some important research questions (e.g., is there a causal link between areal growth rates and specific environmental variables?).
Potential users of this Photoshop measurement technique should be warned that the technique is very labour-intensive, requires tremendous attention to detail and is not suitable for use on uneven surfaces. Metric camera systems and/or portable laser scanners and related software require a substantial financial investment, but they permit orthorectification and require much less labour than our ‘low cost’ Photoshop-based approach. Our approach is, however, a viable option for workers who are interested in accurately measuring changes in a few dozen tiny thalli on flat rocks. On flat bedrock, workers should consider using permanent anchors and rigid, portable camera stands (e.g., Hill Reference Hill1992, Reference Hill, Kranner, Beckett and Varma2002). This could reduce or eliminate the need to adjust every image in a time series. However, when the thalli are on the sides of boulders, photo stations are reoccupied by different workers with different camera systems, or where construction of anchor systems is not permitted, the Photoshop approach can be used to salvage historical data that might otherwise be lost.
We remain puzzled by protocols that use a single ruler or machined nut to provide scale, and we encourage readers to place no trust in unsubstantiated claims of nominal measurement accuracy. Similarly, we wonder why anyone should use or trust a single measure of thallus diameter as a basis for modelling the growth of Rhizocarpon thalli. We suggest that it is quite possible that variability in diametric growth and/or inaccurate measurement data explain why existing models of Rhizocarpon growth have not yet been validated.
Systematic measurement using a diametric grid has shown that change in thallus diameter was highly variable. Change in thallus diameter was poorly correlated with areal growth in the dozens of thalli that we examined. Thus, diameter would be a poor index of lateral growth in these thalli. In contrast, change in thallus area was an objective measure that was statistically robust. When the areal growth data were standardized to an annual rate, we saw that the growth trend was similar regardless of the number of years studied. This suggests that the areal growth of small and mid-sized yellow Rhizocarpon thalli was insensitive to interannual climatic variation. Our findings lend support to the idea that areal growth can be accurately characterized by carefully repeated measurements carried out in a year, not decades. Thus, extrapolation of accurately measured short-term areal growth rates could perhaps be used to establish a long-term growth trend that would be suitable for use in lichenometric dating. Perhaps now the combined use of Photoshop and Geographic Information System software could be used to investigate the fundamental lichenometric assumption that large Rhizocarpon thalli with circular outlines grow outward from a single origin. We hope that workers will consider using Photoshop as a measurement tool, but like Campana (Reference Campana2001), we encourage workers to generate and report validated data.
This work formed part of a graduate thesis by NH. We thank graduate committee members Drs I. Brodo, M. Richards and G. Pickering and acknowledge the helpful comments of two anonymous reviewers. Mike Lozon expertly drafted the figures and helped us test for accuracy and precision. We extend a warm thank you to the staff of Glacier National Park. Since 1996 they have allowed DM to paint rocks and measure the little things. This work received direct and indirect support from Brock University, the Ontario Ministry of the Environment, the National Scientific and Engineering Research Council of Canada and Parks Canada. However, this support does not indicate endorsement of the contents of this manuscript. This work would not have been completed without the tremendous support of our families and close friends. Thank you all.


