Introduction
Measurement of heavy metals, nitrogen and sulphur in lichens is a well-established technique for indicating air pollution load (e.g. Ferry et al. Reference Ferry, Baddeley and Hawksworth1973; Martin & Coughtrey Reference Martin and Coughtrey1982) that remains in active use today (e.g. McMurray et al. Reference McMurray, Roberts, Fenn, Geiser and Jovan2013; Paoli et al. Reference Paoli, Guttová, Grassi, Lackovicová, Senko and Loppi2014; Yemets et al. Reference Yemets, Solhaug and Gauslaa2014; Will-Wolf et al. 2017 Reference Will-Wolf, Jovan and Amachera ). This technique requires less lichenological expertise and field time than methods based on community surveys (e.g. van Haluwyn & van Herk Reference van Haluwyn and van Herk2002; Will-Wolf et al. Reference Will-Wolf, Makholm, Nelsen, Trest, Reis and Jovan2015), making it a potentially cost-effective option for high-volume, large-scale inventories. It is generally assumed that rigorous protocols for collecting and preparing lichens are necessary to ensure accurate data, given the known limitations of the technique (Markert et al. Reference Markert, Wappelhorst, Weckert, Herpin, Siewers, Friese and Breulmann1999; Bargagli & Mikhailova Reference Bargagli and Mikhailova2002; Forbes et al. Reference Forbes, van der Wat and Kroukamp2015). Protocol variations that decrease per-sample costs while maintaining data quality facilitate cost-effectiveness, important for both large-scale monitoring programmes and research studies.
We evaluated the impact of variations in lichen collecting and handling protocols on the quality of element data in a study that included non-specialist field collectors. Recent tests of methods, for example Loppi et al. (Reference Loppi, Faleri and Paoli2014), involved only expert researchers. Our research hypothesis was that less rigorous protocols could generate data that would be useful at least in large monitoring programmes. The a priori assumption was that lower protocol rigour always degrades data quality to some extent but that this is not significant compared with field sample variability. Using five target lichen species, element data for which had been previously validated for bioindication (Will-Wolf et al. 2017 Reference Will-Wolf, Jovan and Amachera ), we tested the effects on data quality of varying rigour in sample collection, handling and preparation protocols. Higher rigour generally involves additional time and expense, for example having experts collect samples and using extra care and supplies to avoid chemical contamination of samples. We also reviewed the potential impact of element measurement with different methods.
Methods
The study was conducted in the state of Wisconsin, USA and adjacent areas of Illinois, Iowa and Minnesota (Fig. 1). Variations in protocols were evaluated for five macrolichen species: Evernia mesomorpha Nyl., Flavoparmelia caperata (L.) Hale, Parmelia sulcata Taylor, Physcia aipolia (Ehrh. ex Humb.) Fürnr. var. aipolia and P. stellaris (L.) Nyl. together (widespread but small and the two species not 100% distinguishable in the field), and Punctelia rudecta (Ach.) Krog. For brevity, these species are often referred to by genus only. Each species is relatively common in part of our study area (Will-Wolf et al. 2017 Reference Will-Wolf, Jovan and Amacherb ). Project vouchers for each species are deposited in the Oregon State University Herbarium (OSU).

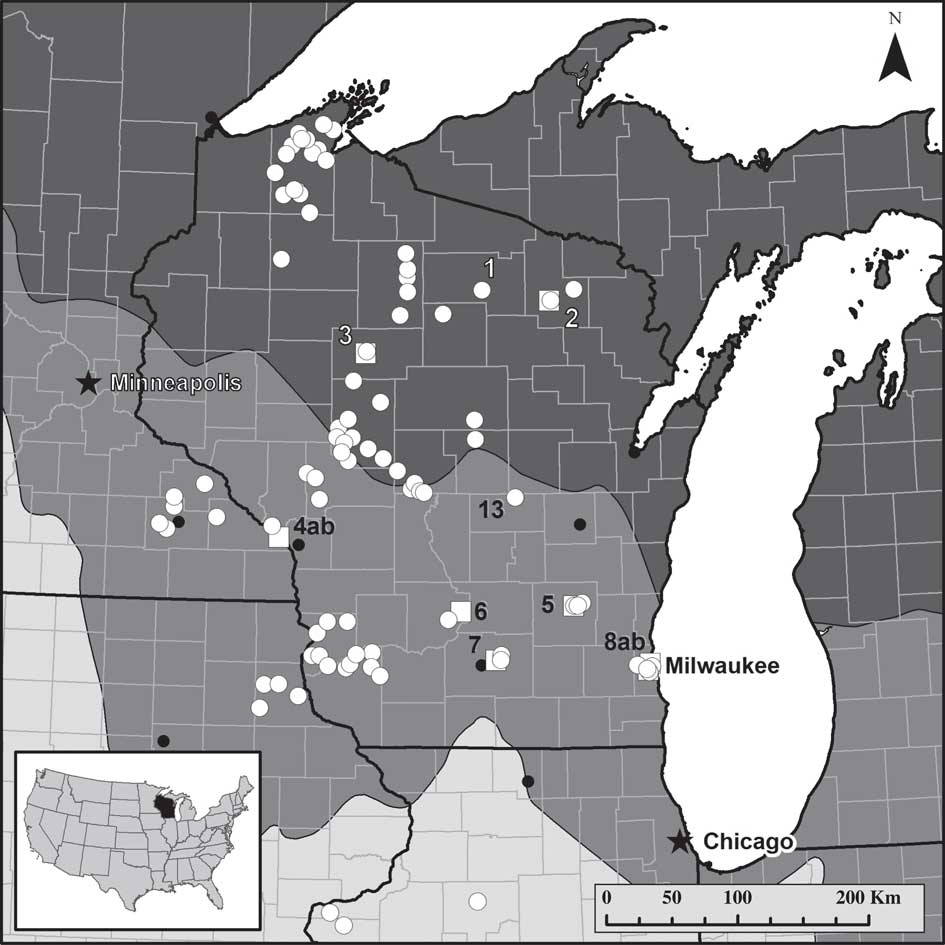
Fig. 1 Map of lichen collection and instrument monitor sites. ![]() =lichen collection site (site 1 was the training site; site 13 had samples collected with Protocol 4 (lowest rigour) only);
=lichen collection site (site 1 was the training site; site 13 had samples collected with Protocol 4 (lowest rigour) only); ![]() =instrument monitoring site (2–8);
=instrument monitoring site (2–8); ![]() or
or ![]() =major city. Monitor sites with “ab” indicate two instrument monitor stations at that site. Intensity of background shading indicates ecoregion province: dark grey=Laurentian Mixed Forest; mid-grey=Eastern Broadleaf Forest; light grey=Prairie Parkland. Detailed data sets are presented for four sites: Baxter's Hollow (near site 6), Jerry Lake (near site 3), Gilbert Lake (site 13) and Madison (two sub-sites near site 7).
=major city. Monitor sites with “ab” indicate two instrument monitor stations at that site. Intensity of background shading indicates ecoregion province: dark grey=Laurentian Mixed Forest; mid-grey=Eastern Broadleaf Forest; light grey=Prairie Parkland. Detailed data sets are presented for four sites: Baxter's Hollow (near site 6), Jerry Lake (near site 3), Gilbert Lake (site 13) and Madison (two sub-sites near site 7).
Field sample and laboratory handling protocol description and code
Lichens were collected from forest openings or edges within c. 0·4 km (c. 0·25 mile) of a United States Forest Service Forest Inventory and Analysis (FIA) permanent plot, and from similar temporary sites (numbered in Fig. 1). Samples were collected within a c. 500 m2 area having 20–50% tree canopy, with no recent chemical disturbances nearby (no roads, lawns, ploughed fields, etc.). Four experienced FIA employees who each routinely survey field plots in their own geographical subregion (the “field staff”) received one day of training from a professional lichenologist (SWW; the “expert”) to identify target lichen species and collect samples. The minimum goal for field collection was two samples (any target species) from 90% of FIA plots: each single-species composite sample from six or more standing woody substrata, yielding ≥1 g (air-dry) biomass, with field notes on sample quality (Will-Wolf et al. 2017 Reference Will-Wolf, Jovan and Amachera , Reference Will-Wolf, Jovan and Amacherb ). When material was abundant, field staff collected two replicates of every target species seen. Collections by the expert at supplemental sites, mostly near scattered suitable monitor sites linked with various national networks (Fig. 1: see Will-Wolf et al. Reference Will-Wolf, Jovan and Amacher2017a ), included many replicates of target species. Four collection and handling protocols varying in chemical cleanliness were used. Field staff used Protocol 1 only; the expert lichenologist collected using all four protocols.
Protocol 1. Rigorous: fresh nitrile gloves worn during sample collection, collection tools alcohol-wiped. Chemically clean single-species collection bags placed into clean plastic bags with desiccant packs, sealed just before cooling. Samples air-dried and kept cool, re-dried and stored in an air-conditioned laboratory after mailing. Samples cleaned in the laboratory using fresh gloves with alcohol-wiped implements on glass plates.
Protocol 2. Mostly Rigorous: same as Protocol 1 in both field and laboratory except gloves not worn in the field; hands wiped with alcohol instead.
Protocol 3. Moderate Rigour: same as Protocol 1 except no gloves or alcohol used in the field or laboratory to clean hands and equipment.
Protocol 4. Low Rigour: no gloves or alcohol used during sample collection or preparation. Samples collected into and stored in brown paper bags (no desiccants, no cooling). Air-dried samples stored in open bags in the laboratory. Species separated only when substratum removed.
Laboratory protocols for sample preparation and determination of element concentrations
Visibly damaged parts were removed from all samples. Samples were not washed in order to avoid loss of water-soluble elements (Bargagli & Mikhailova Reference Bargagli and Mikhailova2002; Forbes et al. Reference Forbes, van der Wat and Kroukamp2015). Data quality was compared between two variations of substratum removal:
1. Full Removal: samples cleaned under a dissecting microscope; >99% (by surface area) of visible adhering substratum and other non-target material removed.
2. Partial Removal: samples cleaned with the naked eye; large pieces of substratum and non-target material removed but small pieces visible to the eye remained (approximately equivalent to removal of 95% of extraneous material visible under a dissecting microscope).
Concentrations of 26 elements in samples were measured in the Rocky Mountain Research Station (RMRS), Logan Forestry Sciences Laboratory (FSL), Logan, Utah, USA (Will-Wolf et al. 2017 Reference Will-Wolf, Jovan and Amachera , Reference Will-Wolf, Jovan and Amacherb ). Combustion analysis was used for C, N, and Hg. Chemical digestion followed by inductively-coupled plasma optical emission spectroscopy (ICP-OES) was used for all other elements (Gatziolis et al. 2016).
Data analysis
Effects on element data quality of sample quality, collection and treatment protocol variation, and different collection expertise (field staff compared to the expert) were evaluated in several ways. Individual observer effect was not tested since field staff did not overlap. Field sample quality issues included the sample being too small, from too few substrata (field staff notes or examination), arriving damp to the laboratory and contaminated with dust (Ca and/or Sr high and pollution elements low, Will-Wolf et al. 2017 Reference Will-Wolf, Jovan and Amachera ). The effect of sample quality on element data quality was estimated by comparing the proportion of ‘odd’ data values from samples with or without observed quality issues. ‘Odd’ values included very high outlier values (>5×the average for remaining values) routinely excluded before data analysis, moderate outlier values (2–5×the average for remaining values) that might be excluded and locally odd values (1·5–2×higher or 25–50% lower than other samples at that or nearby sites) that are often retained.
Variation between replicates was calculated as the relative standard deviation (rSD=100×SD/|mean|; Halleracker et al. (Reference Halleraker, Reimann, de Caritat, Finne, Kashulina, Niskaavaara and Bogatyrev1998)); equivalent to the coefficient of variation (Gailey & Lloyd Reference Gailey and Lloyd1986) when the mean is positive. The significance of differences between data means
 $\left( {\overline{x} } \right)$
for treatment protocols were tested with univariate general linear models (GLMs) calculated in SPSS v.23 (2015). Formal tests of experiment-wide error (which assume independence) were not applied since Will-Wolf et al. (2017
Reference Will-Wolf, Jovan and Amachera
) found many pairs of elements were correlated. To qualitatively account for such error, we favoured test results with P values ≤0·01 and focused on general trends more strongly than on individual statistical results.
$\left( {\overline{x} } \right)$
for treatment protocols were tested with univariate general linear models (GLMs) calculated in SPSS v.23 (2015). Formal tests of experiment-wide error (which assume independence) were not applied since Will-Wolf et al. (2017
Reference Will-Wolf, Jovan and Amachera
) found many pairs of elements were correlated. To qualitatively account for such error, we favoured test results with P values ≤0·01 and focused on general trends more strongly than on individual statistical results.
Results
A target species was collected by field staff on 70 FIA plots: 86% of the 81 plots that were visited. Samples were collected from 15 supplemental plots by the lichen expert. Replicates of all five target species were collected by both field staff and the expert and Flavoparmelia caperata was the most frequently collected species. Elements were measured in 210 healthy-looking samples handled with rigorous Protocol 1 (from 83 sites in total), and in 38 samples handled with less rigorous Protocols 2–4 (from six sites). Twenty elements were validated by Will-Wolf et al. (2017 Reference Will-Wolf, Jovan and Amachera ) with <5% of rigorous samples below detection limit and replicate sample variability ≤25%, including replicates of the European standard IAEA-336 Evernia prunastri (L.) Ach. (Heller-Zeissler et al. 1999). Original data, including excluded samples with notes, are given in Will-Wolf et al. (2017 Reference Will-Wolf, Jovan and Amacherb ).
Observer variation
On the whole, variability of element data did not differ between field staff and the expert. Comparisons used rSD values of single-person replicates since no two observers had replicates for the same site. The two out of 60 comparisons that revealed significant differences might have arisen by chance. Cobalt concentrations in Evernia mesomorpha were significantly more variable (GLM: P=0·004) in the expert (2 sites) than in field staff (2 sites) collections. Ca concentrations in Flavoparmelia were significantly less variable (GLM: P=0·0006) in the expert (4 sites) than in field staff (7 sites) collections. No differences were significant for Parmelia sulcata. Physcia aipolia/stellaris and Punctelia rudecta were not tested as there was only one set each of field staff replicates.
Evaluation of sample quality
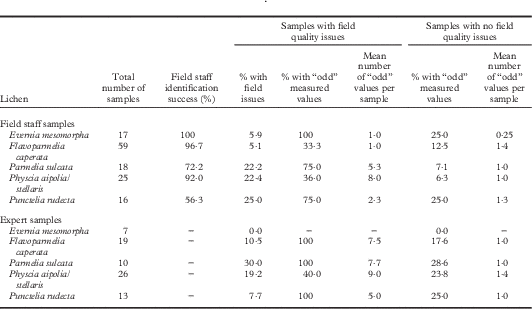
Field staff reliably identified Evernia, Flavoparmelia, and Physcia in the field but had difficulty distinguishing Parmelia and Punctelia from other grey foliose lichens. Some of the 135 field staff and 75 expert samples from rigorous Protocol 1 had quality issues (Table 1; details in Will-Wolf et al. 2017 Reference Will-Wolf, Jovan and Amacherb ). Evernia and Flavoparmelia samples were mostly of an adequate quality, with few data quality problems. Parmelia, Physcia, and Punctelia each had several poor quality samples; most poor quality Parmelia and Punctelia samples had data quality issues. Too few substrata as well as dust contamination reduced data quality in similar ways among the species studied. Small samples had more data quality problems for Parmelia and Punctelia. Samples that arrived damp with no other issues had no data quality problems and are not listed in Table 1 as having field issues. Six expert and 10 field staff samples with poor quality data (≥30–40% of elements with ‘odd’ values) were excluded from the analyses: no Evernia, one Flavoparmelia, five Parmelia, four Physcia and six Punctelia samples. Two Physcia samples from cut shrub branches were among those excluded. Two good quality field crew samples of Punctelia were excluded for poor quality data, perhaps arising from undocumented contamination. Other good quality samples produced few odd measured values and none was excluded; a small number of high outlier values were excluded.
Table 1 Field sample quality evaluation for 135 FIA field staff samples and 75 expert samples collected and handled using rigorous Protocol 1. See text for descriptions of protocols, field issues, and “odd” values for elements
Effect of collection and handling protocols
Evaluation of collection and handling protocols used fewer samples than were available (62 samples for cleanliness protocols; 23 for substratum removal level) because preliminary analyses showed at least three replicates per treatment were required for reliable analysis. Species were evaluated separately; species×site interactions were mostly significant. Approximately 60% of statistically significant tests had P values ≤0·01; responses were strong even considering experiment-wide error. Variability associated with each treatment was compared using the within-treatment variability of an element: mean rSD in Flavoparmelia replicates from rigorous Protocol 1 at 9–12 permanent and supplemental sites across the study area (Will-Wolf et al. 2017 Reference Will-Wolf, Jovan and Amachera ).
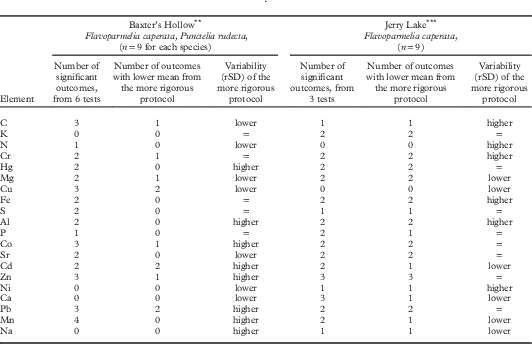
The effects of chemical cleanliness Protocols 1–4 compared pairwise (Table 2; 27 samples, two species) showed some similar patterns among sites. Element values from rigorous Protocol 1 were more similar to those from Protocol 2 than to those from the more relaxed Protocols 3 or 4 in several comparisons. At Baxter’s Hollow with moderate air pollution (near monitor site 6, Fig. 1; Will-Wolf et al. 2017 Reference Will-Wolf, Jovan and Amachera ), this pattern held for three elements from both species and five more from Flavoparmelia. At Jerry Lake with less air pollution (near monitor site 3, Fig. 1) the pattern held for 12 elements, including those from Baxter’s Hollow. Differences between protocols in mean pollution element values varied by element. At both sites, the more rigorous protocol in a test had mostly higher values for Co, Hg and S, while N values differed little. For Cd, Cu, Pb and Zn, the most rigorous protocol mostly had lower values at both sites.
Table 2 Effects of field Protocols 1–4 (most to least rigorous in chemical cleanliness) on means and variability (as rSD, relative standard deviation) of element data: univariate GLMFootnote * (protocols compared pairwise) on data from supplemental sites Baxter’s Hollow and Jerry Lake (locations 6 and 3, respectively, in Fig. 1). Trends for means are based only on significant outcomes; trends for variability reflect all outcomes. Elements are ordered by general variability of element data, least variable element first

* Significant at P≤0·05. 66% of tests used log10 transformed data to homogenize variances.
** Baxter’s Hollow near monitor site 6: tests of Protocols 1 vs 2, 1 vs 3, and 2 vs 3
*** Jerry Lake near monitor site 3: tests of Protocols 1 vs 3, 1 vs 4, 3 vs 4
Other cleanliness protocol effects differed between sites. Concentrations of Al, Cr, Fe and Hg in samples from the more rigorous protocol were higher at Baxter’s Hollow but lower at Jerry Lake. At Baxter’s Hollow, protocols gave similar means for most elements (means differed among protocols for Cu, Co, Zn, Pb, and Mn) and elements with more generally variable data usually had higher rSD for the more rigorous protocol (see the more variable elements Cd–Na, bottom third of Table 2). In contrast, at Jerry Lake means for elements differed significantly among protocols (except for Cu and N), with no consistent trend in element data variability among protocols.
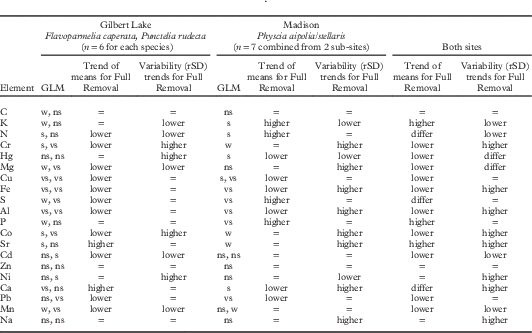
Effects of substratum removal level (Table 3) were mostly similar on Flavoparmelia and Punctelia from Gilbert Lake (13, Fig. 1), with estimated moderate air pollution, and Physcia from Madison (near monitor site 7, Fig. 1), with higher air pollution. For four elements in all species and both sites, and six elements at one site (and no difference for the other site), means were significantly lower for Full Removal samples, indicating that attached bark had higher concentrations of these elements than lichen thalli. In contrast Ca, N, S and Sr in Full Removal samples had lower values at Gilbert Lake but higher values at Madison. Variability (rSD values) differed between treatments for about half of the elements but with no consistent patterns related either to site or to general element variability.
Table 3 Effect of Full vs Part Removal of substratum on means and variability (rSD) of element data: univariate GLMFootnote * on data from supplemental sites Gilbert Lake and Madison (location 13 and near monitor site 7, respectively, in Fig. 1). Trends for means are based only on significant outcomes; trends for variability reflect all outcomes. Trends of means for weak outcomes followed those for significant outcomes. Two GLM results are reported for Madison when sub-site×treatment interaction was significant. Element order as in Table 2

* 6·3% of tests used log10 transformed data to homogenize variances.
GLM results: w=weak (0·05< P≤0·1); s=significant (P≤0·05); vs=very significant (P≤0·01); ns=not significant (P>0·1)
“=” denotes no trend; “differ” denotes trend differs between sites.
The ranges of measured values of elements from our study (Table 4) are mostly well within those reported for eastern North America (NA) and Europe after 1990 (resulting from widespread abatement of SO2 and other industrial pollutants). Values from ICP-OES (our study and most NA studies) and NAA (neutron activation analysis; Europe) are generally either similar or slightly different but translatable using simple formulae (Karakas & Tuncel 2004; Forbes et al. Reference Forbes, van der Wat and Kroukamp2015). Values from the combustion analysis for Hg and N in our study are slightly higher than those from Europe since combustion is more complete than chemical digestion used in European studies. There are no other reports on C for comparison. Unusually high European maxima are from Eastern Europe where pollution abatement began later.
Table 4 Comparison of measured values for lichen elements from this study with those in the literature. Project data ranges are screened original values for all species from rigorous field Protocol 1 and Full Removal of substratum. Data from literature are combined ranges of those species for eastern North America or Europe since 1990 (see literature sources in Supplementary Material Document S1, available online)
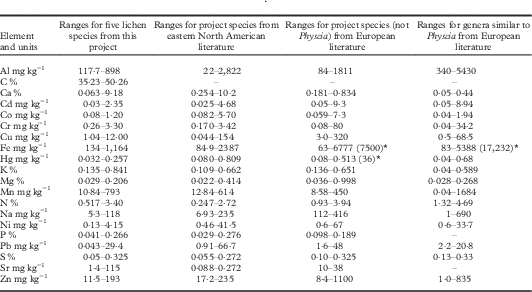
*Three high outlier, but apparently accurate, values from literature are reported in parentheses. The higher value in the adjacent range is the next highest documented value to indicate the primary range of the element.
Discussion
Only our most rigorous sample handling Protocol 1 is supported from this study and the use of trained non-specialists for sample collection is supported with caveats. Stricter criteria for the selection of sample collection areas are not recommended as 14% of permanent plots had no data and some plots had only a single sample, so our 90% sample collection goal was not met. Fewer sites with usable data would probably lower indicator reliability. Element data ranges were similar to those in published literature, supporting our chosen measurement methods. Species differences (simple and interactive) in response to protocol variations were observed, but our data did not allow us to infer reasons for the differences or their causes.
The ability of non-specialists to identify target species differed, which in turn affected data quality. Evernia mesomorpha, Flavoparmelia caperata, and Physcia aipolia/stellaris were easily recognized by field staff and yielded mostly good quality data. Parmelia sulcata and Punctelia rudecta were not as reliably distinguished from other grey foliose lichens in the field (Will-Wolf et al. 2017 Reference Will-Wolf, Jovan and Amacherb ), resulting in more serious sample and data quality issues. The same Punctelia species yielded consistent element data when collected by experts in the same and similar areas (Will-Wolf et al. Reference Will-Wolf, Nelsen, Trest, Rolih, Reis and Jovan2014, Reference Will-Wolf, Makholm, Nelsen, Trest, Reis and Jovan2015). This contrast highlights that regional lichen community context should be considered when selecting target species for non-specialists.
Poor sample quality from dust contamination or too few substrata, as also shown by Sloof & Wolterbeek (Reference Sloof and Wolterbeek1991), reduced data quality similarly for all species, while the effect of sample size varied. Small sample size (but from at least 6 substrata) reduced data quality less for reliably identified species so that further mitigation might be achieved through better training. Sample substratum removal rate was slower for all species with a smaller size than the sample (Will-Wolf et al. 2017 Reference Will-Wolf, Jovan and Amacherb ), a reason not to lower the recommended minimum target size for a composite sample of any species. Despite identification problems, replicates collected by the four field staff were no more variable than those collected by the expert for three species tested, supporting the use of trained non-specialists for sample collection. Although not statistically tested, single observer variation was perceived to have contributed to the variability of our data.
Expectations for tests of field protocol were met partially. Tests that included the least rigorous collection Protocol 4 often matched expectations that lower rigour gave different and more variable data, but other results did not. Data differed for less relaxed protocols but trends did not reliably match the degree of protocol rigour. Our expectation that variability linked to relaxed protocols would increase with inherent element variability was not met. Differences were often either unrelated to inherent variability or were the opposite of our expectations, such as with elements Cd to Na in Table 2. High outlier values for many elements in two healthy-appearing samples from old cut branches reinforced the importance of samples collected from substrata in their original location. More thorough tests of our least rigorous cleanliness Protocols 3 and 4 do not seem worthwhile. However, a more thorough study of our least relaxed Protocol 2 might be useful; wiping hands with alcohol rather than wearing gloves in the field and for sample preparation showed the fewest treatment effects. Wearing nitrile gloves on hot, humid days (not encountered in this study) in eastern USA is uncomfortable enough to possibly affect field staff collecting performance.
Time-consuming Full Removal of adhering substratum usually resulted in lower values for most elements (e.g. Al, Co, Cu, Fe, and Hg) than Partial Removal, a finding that was consistent across the three species tested. Contrasting patterns between sites and species for Ca, N, S and Sr might relate to either lichen growth form or site factors including pollution (confounded in this study). Loppi et al. (Reference Loppi, Faleri and Paoli2014) found that 3–4h versus 1–2h substratum removal time for a final 200 mg sample of a small foliose lichen still gave different values for two of 15 elements. Our Full Removal protocol took 0·5–1 hour on average and we suggest it as a recommended minimum (Will-Wolf et al. 2017 Reference Will-Wolf, Jovan and Amacherb ). The faster Partial Removal protocol yielded variable data so its greater cost-effectiveness is of no advantage. Our variable results are consistent with other literature where concentrations in lichens compared to tree bark were found to vary by element and also with site conditions. Boltersdorf et al. (Reference Boltersdorf, Pesch and Werner2014) found in Germany that the 1·0–4·8% N content of Parmelia sulcata, two Physcia spp. and Xanthoria parietina was reliably higher than the 0·2–1·5% bark N of trees with either acid or neutral bark. Kansanen & Venetvaara (Reference Kansanen and Venetvaara1991) found in Finland that pine bark had lower Cr and Ni concentrations than Hypogymnia physodes and cited earlier reports that Pb was higher in bark than in lichen, and that moss or lichen data tracked regional atmospheric variation more closely than did tree bark. Purvis et al. (Reference Purvis, Chimonides, Jeffries, Jones, Read and Spiro2005) reported that 1) concentrations of Fe, K, P and N in Parmelia sulcata were higher than those in oak bark, 2) concentrations of Ca, Cd, Mn, Ni, Pb, Sr and Zn were higher in oak bark and 3) concentrations of Al, Co, Cu, Mg and Na did not differ. Thus, in terms of whether lichens or bark contain higher element concentrations, there is little support for generalizations across all elements or for all lichens. While tree bark elements also indicate air pollution (e.g. Forbes et al. Reference Forbes, van der Wat and Kroukamp2015), failure to adequately clean lichen samples could lead to misleading interpretations of air pollution load. The possibility that elements in lichens and tree bark vary at different spatial scales should be explored in modern studies; such patterns would magnify the impact of incomplete substratum removal on data quality.
Measurement methods appear not to introduce notable bias in values, though they may mediate bias in the selection of elements to monitor. Combustion analysis is both reliable and cost-effective for the measurement of important pollutants such as N and Hg (neither measured by ICP-OES). NAA (frequently used in Europe) often does not give reliable data for N in lichens: N values are not certified for the European standard IAEA-336 Evernia prunastri (Heller-Zeisler et al. Reference Heller-Zeisler, Zeisler, Zeiller, Parr, Radecki, Burns and De Regge1999) measured with NAA. Values from digestion/ICP-OES as well as combustion analysis which are used in most published North American studies, are generally comparable with NAA or can easily be converted between the two methods (e.g. Forbes 2015).
Conclusions
Our hypothesis that relaxation of either field or sample preparation protocols would introduce differences smaller than replicate variation was rejected for most elements. The extra time and cost for rigorous sample handling protocols are necessary to ensure quality data for both research and monitoring. In contrast, the use of non-specialist field collectors generated quality data, a conclusion useful for large monitoring programmes. Species identification is a critical training hurdle for non-specialists. To increase successful identification, non-target lichen community composition should be evaluated when selecting target species for non-specialists.
Cost-effective methods for element analysis of many samples of lichens or mosses facilitate much-needed environmental health monitoring. For instance, a recent study of elements in 346 moss samples distributed across Portland, Oregon, USA (Donovan et al. Reference Donovan, Jovan, Gatziolis, Burstyn, Michael, Monleon and Amacher2016) identified previously unrecognized local sources of atmospheric Cd at levels that pose risks to human health. Modelling from sparsely-distributed, expensive instrument monitoring stations in nationwide USA networks (as in Fig. 1: e. g. CMAS 2015; NADP 2016; US EPA 2016) has not successfully assessed local air quality far from those stations (Jovan & McCune Reference Jovan and McCune2006; Geiser & Neitlich Reference Geiser and Neitlich2007; Jovan et al. Reference Jovan, Riddell, Padgett and Nash2012; Root et al. Reference Root, Geiser, Fenn, Jovan, Hutten, Ahuja, Dillman, Schirokauer, Berryman and McMurray2013; Will-Wolf et al. Reference Will-Wolf, Nelsen, Trest, Rolih, Reis and Jovan2014). Pressure to find cost-effective methods for research and practical applications is so strong that studies on the importance of rigorous protocols are critically needed, both to defend greater rigour when appropriate and to support the relaxation of protocols when scientifically justified.
This project was funded by cooperative agreement SRS09-CA1130145101, between the USDA Forest Service Forest Indicator and Analysis Program (FIA) and the University of Wisconsin-Madison (Principal Investigator Susan Will-Wolf). FIA Northern Region Program Managers Dennis May and Christopher Woodall (acting) facilitated the study. FIA Wisconsin supervisor Peter Koehler helped organize training and field sample collection. FIA Wisconsin staff John Benaszeski, Benjamin Nurre, Sjana Schanning and Willard Smith collected field samples and gave much valuable feedback. Robert W. Hoyer prepared Figure 1. Peter Crittenden and two anonymous reviewers are thanked for constructive criticisms that helped us improve the manuscript.
Supplementary Material
For supplementary material accompanying this paper visit https://doi.org/10.1017/S0024282917000299