


Introduction
Tree species composition is very important for lichen biodiversity (Fanning et al. Reference Fanning, Ely, Lumbsch and Keller2007; Öztürk & Güvenç Reference Öztürk and Güvenç2010; Király et al. Reference Király, Nascimbene, Tinya and Ódor2013; Sales et al. Reference Sales, Kerr and Gardner2016). Variation among tree species regarding bark properties and canopy structure offers different habitats for lichen communities (Ellis Reference Ellis2012). For individual trees, age gradients along stems and branches also create a variety of conditions for corticolous organisms (Fritz et al. Reference Fritz, Brunet and Caldiz2009; Ellis Reference Ellis2012; Woods Reference Woods2017).
The diversity of corticolous lichens in the forest ecosystem also depends on other factors, such as differences in topography and hydrology and canopy variation with respect to light gaps, age distribution and dominance relationships among the trees, all of which create many different microhabitats (Ellis Reference Ellis2012). Lichen species richness has been found to correlate positively with stand age and continuity in forest cover (Fritz et al. Reference Fritz, Gustafsson and Larsson2008; Svoboda et al. Reference Svoboda, Peksa and Veselá2010; Hauck Reference Hauck2011; Ellis Reference Ellis2012). This can make it difficult to isolate the unique effect of, for example, tree species or vertical height.
A common garden is a set of plantations meant to evaluate the performance of selected tree species or provenances 1) under different climate and soil conditions, and 2) against each other under near-identical conditions. At each site, the exact trial area is selected for uniform topography and hydrology, and the soil is homogenized by ploughing before the tree species in question are planted in a regulated pattern. Several such trial areas are allotted over a larger geographical area to represent a variety of soils and local climate. Such a forestry experiment gives an extraordinary opportunity to follow the establishment of corticolous lichens over time and among tree species growing in the same environment where many stand-related factors are minimized. In the present study, we took advantage of trees felled and sectioned for biomass calculations (Nord-Larsen et al. Reference Nord-Larsen, Meilby and Skovsgaard2017) which takes place at regular intervals in the common gardens. This enabled us to analyze the lichens all along the stems but also dictated our sampling strategy.
Most research on corticolous lichens has been carried out on the lower and accessible parts of the tree stem (e.g. Culberson Reference Culberson1955; Kuusinen Reference Kuusinen1996; Perhans et al. Reference Perhans, Gustafsson, Jonsson, Nordin and Weibull2007; Calviño-Cancela et al. Reference Calviño-Cancela, López de Silanes, Rubido-Bará and Uribarri2013; Kaufmann et al. Reference Kaufmann, Hauck and Leuschner2017). However, species richness and cover of corticolous lichens generally increase upwards along the stem (Coote et al. Reference Coote, Smith, Kelly, O'Donoghue, Dowding, Iremonger and Mitchell2008; Fritz Reference Fritz2009) and some lichen species may be found only in the crown (Kiebacher et al. Reference Kiebacher, Keller, Sheidegger and Bergamini2016). Only about one third of corticolous lichen species are found at the lowermost 2 m of the stem (Marmor et al. Reference Marmor, Tõrra, Saag and Leppik2013) or even lower (Rasmussen et al. Reference Rasmussen, Nord-Larsen, Hansen and Hoareau2018). Consequently, surveys of the first 2 m of the stem tend to underestimate the floristic diversity of lichens and could yield misleading information as to the rarity of species (Fritz Reference Fritz2009; Johansson et al. Reference Johansson, Snäll, Johansson and Ranius2010; Marmor et al. Reference Marmor, Tõrra, Saag and Leppik2013).
Seven angiosperm tree species replicated at four different common garden sites were used here to examine lichen colonization along the whole tree stem. All trees were 44 years old and shared the same provenance across the sites. The study reflects conditions in a relatively young tree plantation and the species richness and community structure that may develop over four decades. The aim of the present work is to examine 1) how the species richness and diversity of corticolous lichens differed among the tree species, and 2) their distribution along tree stems. These distribution patterns are essential for developing hypotheses about the specific tolerance range for each lichen species that determines where lichen spores will colonize and when thalli go into decline (Rasmussen et al. Reference Rasmussen, Nord-Larsen, Hansen and Hoareau2018).
Methods
Data collection
Tree bark from seven Danish native angiosperm trees was examined by a floristic sample analysis of lichens. The tree species included Acer pseudoplatanus L. (provenance F 269, Gjorslev d.), Alnus glutinosa (L.) Gaertn. (provenance F 2, Graasten d.), Betula pendula Roth (provenance Visingsö), Fagus sylvatica L. (provenance Herk.geb. II/3, Holland ´t Loo, Apeldoorn), Fraxinus excelsior L. (provenance FH 202), Quercus robur L. (provenance Herk.geb. I, Holland, ‘Zevenarr’) and Tilia cordata Mill. (provenance Vindeholme d.).
All trees were grown in a common garden experiment established with two-year-old seedlings in 1973 at four sites: Matrup forests, Odsherred forest district, Det Petergaardske forest district and Vallø diocese (Appendix 1). In the common gardens, each tree species was planted in monocultures in separate plots ranging between 0.2 and 0.4 ha per tree species. All plots were regularly thinned every 4–6 years according to silvicultural practices, with the aim of maintaining production of quality trees.
As part of a study on tree biomass (Nord-Larsen et al. Reference Nord-Larsen, Meilby and Skovsgaard2017), six trees per tree species on each site were selected by stratified random selection and felled in March 2015. Stem discs with a thickness of 3–4 cm were collected at different heights along the tree stems. Fraxinus excelsior were not collected from Vallø diocese due to a severe ash dieback attack when the plantation was young and three trees of Acer pseudoplatanus from Odsherred forest district were discarded because of labelling errors. Altogether, 159 trees were collected. Stem discs were collected at 0.75, 1.30 and 1.50 m above the ground, and above that at equidistant intervals along the main stem. Since there was a considerable variation in total tree height (7.78–28.23 m), subsequent sample intervals were between 0.5 and 3 m depending on the total height of the individual tree (Appendix 2). In total, 1956 stem discs were examined.
From each stem disc, all bark was carefully loosened from the cambium and collected in pieces as large as possible. The bark was dried at 105 °C for 24 h to determine the dry weight as a part of the biomass study (Nord-Larsen et al. Reference Nord-Larsen, Meilby and Skovsgaard2017). Subsequently, the bark was examined for the presence or absence of lichens. Lichens were identified morphologically at ×10–30 magnification using keys in Smith et al. (Reference Smith, Aptroot, Coppins, Fletcher, Gilbert, James and Wolseley2009). The lichen collection at the Natural History Museum of Denmark served as reference material. In some cases, identification was only possible to generic level because of poorly developed thalli (i.e. either too young or senescent).
Data structure
Since six trees per tree species were felled within each site, for each sample height along the main stems there was a maximum number of six stem discs (Fig. 1). As trees from the same species and site were not independent, we created one single sample unit per sample height for each tree species within a site to avoid pseudo-replication. That is, one sample unit corresponded to a maximum of six stem discs from a certain sample height (Fig. 1). Relative sample height was calculated in relation to the total height of the tallest tree within the species and site.
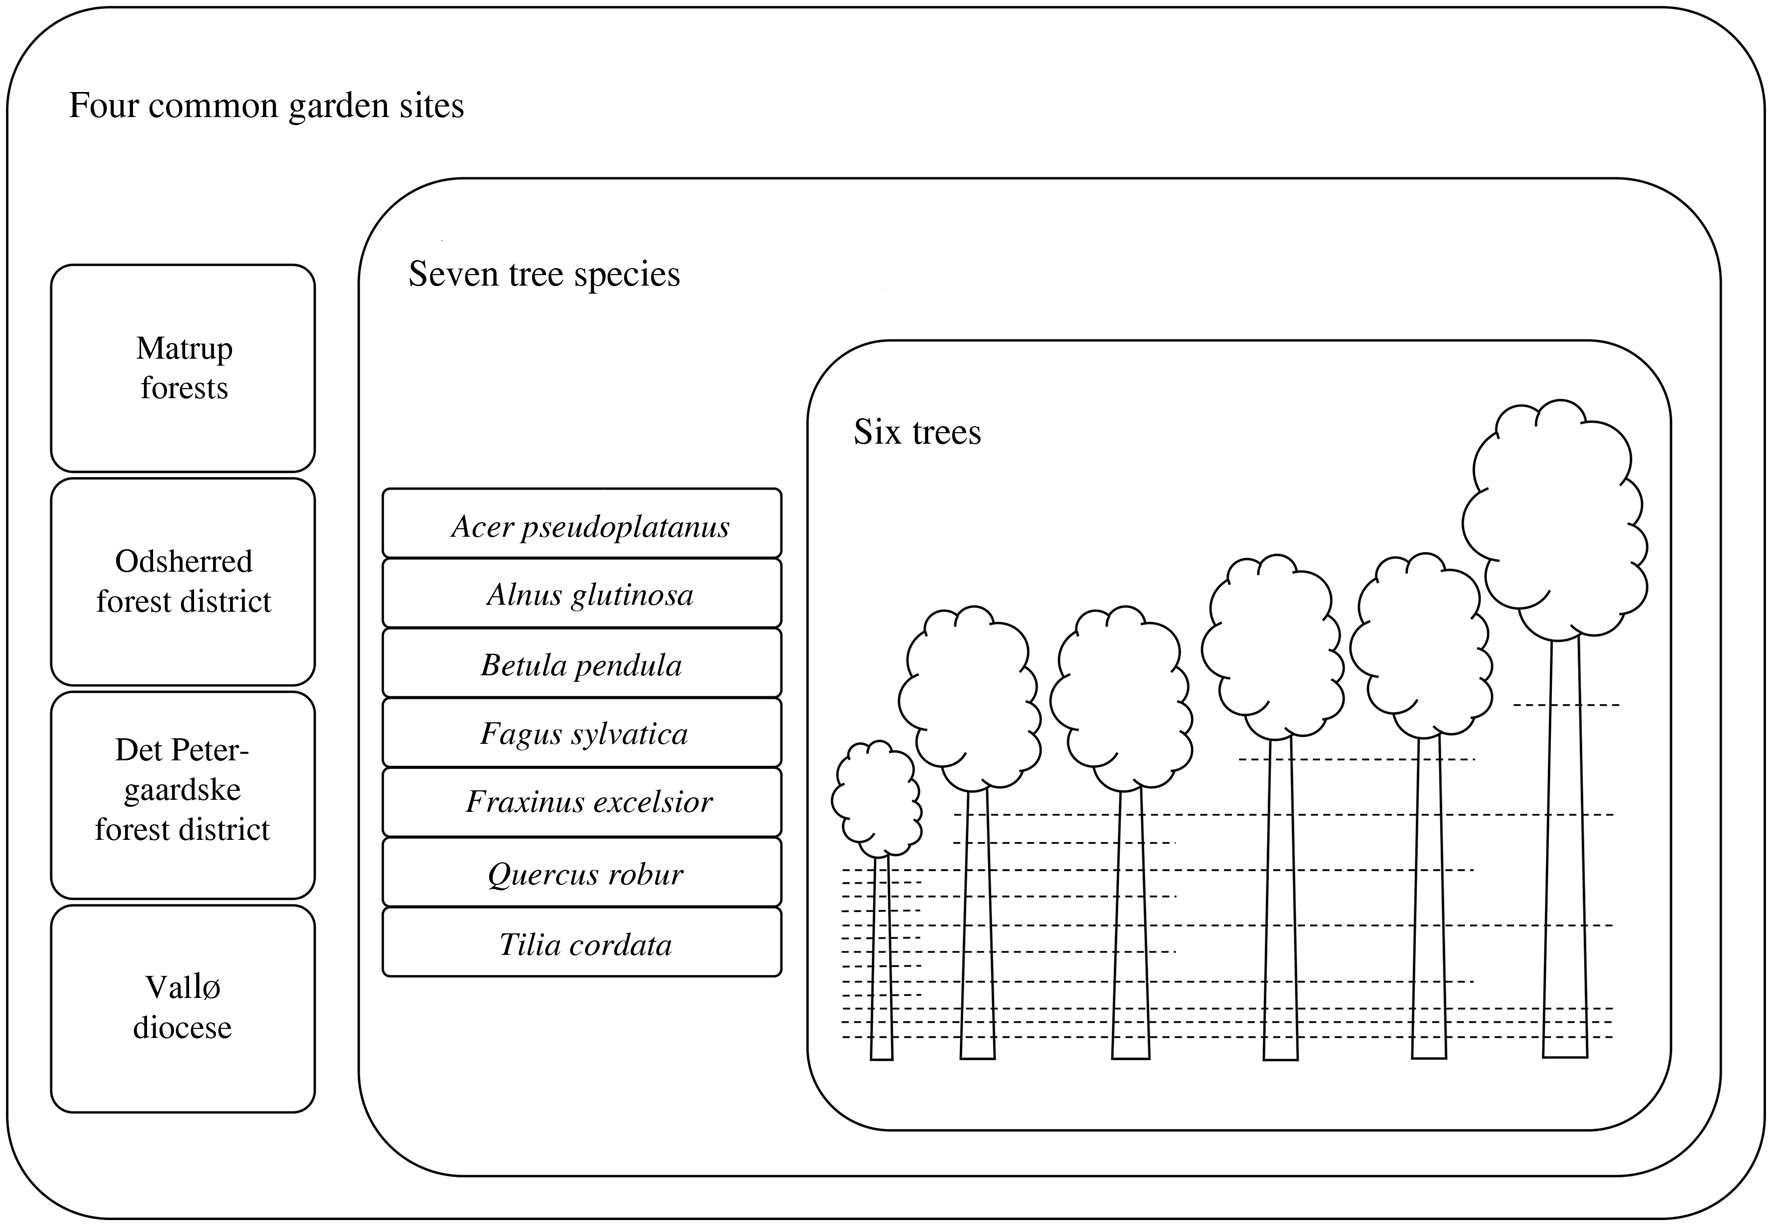
Fig. 1. Illustration of the principle of stem disc sampling along the tree stems. For each of the four common garden sites, six trees per seven tree species were felled. Sample heights are illustrated with dashed lines and depended on the total tree height. The number of stem discs per sample height decreased with height due to a natural difference in total tree height. A sample unit was created for each sample height within tree species and site and corresponds to the total number of stem discs of the sample height in question.
The frequency or the proportional abundance of a lichen species was calculated for every sample unit. If a lichen species was found on two out of six stem discs in one sample unit the proportional abundance was 2/6. In trees with a forked stem, two discs from the same height were regarded as one. Despite all trees being even-aged, the total height (7.65–28.23 m) and diameter at breast height (7.5–42.5 cm) varied between trees. Since sample intervals were larger in taller trees than shorter trees, not all sample units had the same number of stem discs, which affected the calculated proportional abundances. Also, the proportional abundances of the lichen species depended on the bark surface area available for colonization, which naturally decreased with height. The ratio between the surveyed surface area and the total surface area of the sample interval remained roughly the same along the tree stem (Appendix 3). Therefore, it was possible to ignore the decreasing surface area of the stem discs with tree height because the same proportional bark surface area was examined for the occurrence of lichen species.
A species matrix and a second matrix were created for the analysis. The species matrix (481 sample units × 36 lichen species) contained the proportional abundance of the recorded lichen species per height within each tree species and site. In order to avoid the risk of species replication, lichen species identified to generic level were only included in the species matrix as separate operational taxonomic units if they belonged in a genus not otherwise represented. The second matrix (481 sample units × 5 variables) contained variables including tree species, site, species richness (S), Shannon diversity (H´) and relative sample height. Following Whittaker (Reference Whittaker1972), it was decided to include both species richness and Shannon diversity values in the analysis. The relative height was used because we assume that trees have similar microclimatic conditions at the same relative height, regardless of different growth rates. The relative height was calculated as a sample unit height divided by the total height of the tallest tree within the same tree species on each site.
Data adjustment and analysis
The procedure described in McCune & Grace (Reference McCune and Grace2002) and PC-ORD statistical software (Version 7; McCune & Mefford Reference McCune and Mefford2016) were used for data adjustment and analysis. Lichens occurring in fewer than five sample units were omitted from the species matrix to reduce noise in the data analysis. No log-transformation was necessary as the magnitude of the lichen abundance within each sample unit was within a narrow range. It was of interest to maintain empty sample units as a part of the analysis and so the data were not relativized as it would result in division by zero. Furthermore, it was of no interest to attenuate the abundance differences between lichen species.
The outlier analysis showed that 25 sample units had an average distance of more than two standard deviations from the grand mean for pairwise Euclidean distance (0.81, Euclidean distance measure) among the 481 sample units. Five sample units with a standard deviation > 3.05 were considered as potential outliers because they had few lichen species with very high proportional abundance. Visual inspection of the outlier position in an ordination plot based on nonmetric multidimensional scaling (NMS) showed a peripheral position in the main point cloud. Therefore, it was decided not to exclude these potential outliers.
Species richness and Shannon index
Lichen species richness (S) and Shannon diversity (H´) values were calculated for each sample unit before omitting rare species and then means across sample units within tree species were calculated. Differences in species richness and Shannon index values among tree species were tested by a Kruskal-Wallis test (R, version 3.3.2). Visual inspection of QQ-plots for the two response variables showed a non-normal distribution. Dunn's test was used for the post-hoc analysis.
NMS ordination of lichen abundance in relation to height
The choice of ordination method was based on the summary statistics of the species matrix showing a dust bunny index (DBI) of 0.974, which indicates non-normal data distribution (McCune & Root Reference McCune and Root2015). To avoid the assumption of a linear relationship among variables, such as in a principal components analysis (PCA), nonmetric multidimensional scaling (NMS) was used as an ordination method (Kruskal Reference Kruskal1964; Mather Reference Mather1976; McCune & Grace Reference McCune and Grace2002). A Euclidean distance measure was used to avoid dividing by zero because lichens were absent in some sample units. NMS ordination allows the use of any distance measure, compared to, for example, correspondence analysis (CA) where chi-square distances must be used. Furthermore, CA is not appropriate when sample units meaningfully contain no or few species (McCune & Grace Reference McCune and Grace2002). NMS was performed with a random starting configuration in autopilot mode ‘slow and thorough’ with a maximum number of 500 iterations, instability criterion of 0.0000001, starting number of axes set to 6 and 250 runs of real and randomized data. Ties were not penalized.
Modelling of the lichen-height distribution
The distribution of individual lichen species along the stem was first modelled using non-parametric multiplicative regression (NPMR) with HyperNiche (Version 2.3; McCune & Mefford Reference McCune and Mefford2009). Using NPMR, HyperNiche simulates habitat models where the predictors are joined multiplicatively instead of additively (McCune & Mefford Reference McCune and Mefford2009). NPMR fits the habitat model by smoothing without reference to any specific mathematical model and finds the best correlation between the response variable and the predictor(s) (McCune Reference McCune2011).
Models were fitted by free search, local mean with Gaussian weighting, and a NPMR overfitting control. Relative height and tree species were used as predictors to model the distribution of the single lichen species along the stems across all tree species, whereas only relative height was used to predict the lichen distribution on the single tree species. The best models for each lichen species were selected based on the cross-validated R2 (xR2) for qualitative responses. All models had very low xR2 values and it was decided to use only models with xR2 > 0.1.
As a supplement to the non-parametric analyses, we modelled the presence of lichens using logistic log-binomial regression (procedure GENMOD, SAS Institute ver. 9.4) with lichen genus as a response (separate operational taxonomic units), compared to tree species, relative height and relative height squared as well as the cross-effect of relative height squared and lichen genus as predictor variables. In this analysis, individual stem discs represented the primary sample unit and possible correlations between samples obtained from the same tree were included using a compound symmetry correlation of observations within the same tree. The analysis was made at the lichen genus level to avoid excessive use of degrees of freedom in the analysis and to reduce the number of records disregarded for lichens that were recorded only at the genus level. Lichen species recorded less than five times were omitted from the analysis.
Results
Species richness and Shannon index
In total, 2720 lichen records representing at least 36 taxa were made (Table 1). Lichen species diversity varied significantly across tree species. Acer pseudoplatanus and Fraxinus excelsior had significantly higher species richness (S) and Shannon index (H´) values than all other tree species, except for the species richness of Alnus glutinosa. Betula pendula and Fagus sylvatica showed a significantly lower presence and diversity of lichens (Table 2).
Table 1. A complete list of the frequency of 36 lichen taxa recorded to species level among the tree species across four common garden sites. Lichens recorded to genus level are not included (in total 590). Numbers in brackets indicate the total number of sample units per tree species. Cross-validated R2 values are listed for best-fit models (xR2 > 0.1) of the distribution of corticolous lichens along the tree stem.

Table 2. Means and standard deviations of species richness (S) and Shannon index (H´) values across height and sample units (given in brackets) within each tree species. The P-values based on a Kruskal-Wallis test show that species richness and Shannon index differ significantly among tree species, which is indicated by the lower-case letters (P < 0.05).

NMS ordination of lichen presence
NMS suggested a two-dimensional ordination with a final stress of 14.6 as the best solution to represent sample units in species space. After 100 iterations, NMS reached a final instability of zero. The final stress was found to be lower than expected by chance (P = 0.004) by comparing real and randomized runs of the data (Monte Carlo test; McCune & Grace Reference McCune and Grace2002).
The two-dimensional ordination of sample units in species space accounted for the dissimilarity in species composition between sample units (Fig. 2). Axis 1 explained 70.5% of the variance in the dissimilarity matrix and axis 2 explained 17.4% (Fig. 2). The ordination was rotated 19° to align the variable H´ with the first ordination axis. Species richness (r = 0.394) and Shannon index (r = 0.407) showed a stronger correlation with axis 1 compared to relative height which was more weakly related to the first axis (r = 0.291). The three vectors almost share the same direction. The vector for relative height (R) is approximately half the length of vector S and H´ (Fig. 2).

Fig. 2. The two-dimensional ordination of sample units in species space. A sample unit corresponds to the total number of stem discs from a certain sample height for each tree species within a site (Fig. 1). Triangles represent sample units colour-coded by tree species. Black solid dots represent lichen species. The ordination plot was superimposed with convex hulls (polygons) enclosing sample units to each tree species and a joint plot showing the quantitative variables relative height (R), species richness (S) and Shannon index (H´). Colour key: red = Acer pseudoplatanus, green = Alnus glutinosa, light blue = Betula pendula, pink = Fagus sylvatica, dark blue = Fraxinus excelsior, orange = Quercus robur, brown = Tilia cordata.
On the ordination plot the S and H´ signify a gradient along axis 1, indicating that sample units placed to the far right (Acer pseudoplatanus and Fraxinus excelsior) have higher species richness and Shannon index values than sample units placed in the opposite direction (Betula pendula). The calculated means (Table 2) agreed with the direction of the joint plot vectors S and H’ and their relatively strong relationship with axis 1, as well as the placement of convex hulls in the ordination plot (Fig. 2).
Lichen-height distribution
Individual lichen species differed in their abundance optima according to the modelled height distribution (Fig. 3). Only models with xR2 > 0.1 were included (Table 1). Within each of the seven tree species, the criterion of using best-fit models with xR2 > 0.1 resulted in only one or a few useful models to show lichen distribution along the tree stem (Appendix 4) and the lichens showed a distribution pattern equal to that found across all tree species (Fig. 3). However, Melanelixia glabratula could only be modelled on Acer pseudoplatanus, where it was present above 5 m and most abundant around 55% of the tree height.

Fig. 3. Lichen proportional abundance as a function of relative height modelled by use of non-parametric multiplicative regression (NPMR). Some lichen species differ in frequency by relative height on the tree stem. The models are based on records of lichens across the tree species and sites, meaning that lichen species shown were not necessarily present on all tree species and sites. Key: open triangle = Lecanora carpinea, filled triangle = Lecanora chlarotera, open square = Arthonia atra, filled square = Parmelia sulcata, open diamond = Physcia tenella, filled diamond = Pseudosagedia aenea, open circle = Lecidella elaeochroma, filled circle = Lepraria incana, cross = Xanthoria parietina.
The change in distribution patterns created different lichen communities along the tree stem. Species such as Lepraria incana, Arthonia atra and Pseudosagedia aenea were growing on the lower part of the tree stem, while Lecanora carpinea, Physcia tenella, Xanthoria parietina, Lecanora chlarotera and Lecidella elaeochroma frequented the upper parts (Fig. 3). This result is also supported by the ordination plot, where the placement of these lichen species corresponds to the direction of the relative height vector (Fig. 2).
The logistic regression revealed significant effects of tree species (P < 0.001), relative tree height (P < 0.001) and relative tree height squared (P < 0.001) on the distribution of lichen genera (Table 3). Furthermore, the effect of relative tree height depended significantly on the lichen taxon (P < 0.001), that is the patterns of lichen presence along the stem differed significantly depending on the lichen genus. Among the more frequent lichen genera, the distribution of Lepraria differed significantly from the distribution of Lecanora, Lecidella, and Physcia.
Table 3. Parameter estimates of the logistic log-binomial regression for analyzing the distribution of different lichen genera along the stem. Standard errors of the estimates are written in italics. Cross effects are shown as the combination of ‘Relative tree height squared’ and ‘Lichen genus’.

Significance levels are given as: P > 0.05 = ns, P < 0.05 = *, P < 0.01 = **, P < 0.001 = ***.
Discussion
Species richness and lichen diversity among tree species
Since intensive forest management may influence lichen species richness negatively (Aragón et al. Reference Aragón, Martínez, Izquierdo, Belinchón and Escudero2010), regular thinning of the common gardens may have resulted in less colonization and fewer lichen species in this study than might otherwise have been expected. Nevertheless, our tree species differed significantly with respect to lichen diversity.
Features that have been emphasized as influencing the suitability of a tree species as a lichen phorophyte include bark pH (Jüriado et al. Reference Jüriado, Liira, Paal and Suija2009; Käffer et al. Reference Käffer, Marcelli and Ganade2010). Among our tree species, Acer pseudoplatanus and Fraxinus excelsior are expected to have had the highest pH, followed by Tilia cordata and Quercus robur, with Fagus sylvatica and Alnus glutinosa in the lower pH spectrum (Spier et al. Reference Spier, van Dobben and van Dort2010; Štifterová & Neustupa Reference Štifterová and Neustupa2015). This essentially agrees with the lichen species richness found here. However, specific pH values tend to vary considerably according to the environment of the trees and may explain only a minor part of the lichen community variation (Spier et al. Reference Spier, van Dobben and van Dort2010).
Increase in bark roughness is often positively related to lichen species richness, greater total lichen coverage, and to variations in community composition (Kuusinen Reference Kuusinen1996; Lamit et al. Reference Lamit, Lau, Næsborg, Wojtowicz, Whitham and Gehring2015). A rough bark surface might increase the chance of propagules settling and provide protected microsites within bark crevices (Lamit et al. Reference Lamit, Lau, Næsborg, Wojtowicz, Whitham and Gehring2015; Sales et al. Reference Sales, Kerr and Gardner2016). Lichens growing on a smooth bark surface are more exposed to strong light and drying winds, and subject to displacement by stem flow (Király et al. Reference Király, Nascimbene, Tinya and Ódor2013). In this study, the smooth bark of Fagus sylvatica was poorly colonized by lichens, while the smooth bark of Acer pseudoplatanus and Fraxinus excelsior showed relatively high species richness and diversity. Furthermore, several lichen species prevailed in the upper part of the tree stems, where the bark was fairly smooth regardless of tree species. Thus, for the lichen species of this study, the importance of rough bark on richness and/or cover appeared to be low.
A positive relationship between the amount of light and the cover of corticolous lichens (Jüriado et al. Reference Jüriado, Liira, Paal and Suija2009) suggests that canopy structure can be an influential factor (Fanning et al. Reference Fanning, Ely, Lumbsch and Keller2007; Király et al. Reference Király, Nascimbene, Tinya and Ódor2013; Sales et al. Reference Sales, Kerr and Gardner2016). Fagus sylvatica is known for creating a dense canopy, allowing less than 3% of the sunlight to reach the forest floor compared to 3–10% under Acer pseudoplatanus (Petersen & Vestergaard Reference Petersen and Vestergaard2006; Hoffmann Reference Hoffmann2007). This suggests that light exposure on the stems would also be quite limited with Fagus sylvatica, in spite of regular thinning at the experimental sites, which might explain the poor lichen colonization we found on this host. The same might apply to the canopy of Tilia cordata (Hoffmann Reference Hoffmann2007). In contrast, Betula pendula is reported to let 10–30% of the sunlight pass through the canopy (Petersen & Vestergaard Reference Petersen and Vestergaard2006) but it nevertheless had a low lichen species richness and diversity (this study; Kuusinen Reference Kuusinen1996). This could be caused by peeling bark which might inhibit both establishment and long-term persistence of thalli, as suggested by Kuusinen (Reference Kuusinen1996).
Prior to this study, the water holding capacity in bark coming from our sampled trees had been examined (Larsen et al. Reference Larsen, Rasmussen and Nord-Larsen2017). We found that water holding capacity in Betula pendula was conspicuously low (50%), compared to 60–68% in the other tree species (difference between wet weight and dry weight divided by wet weight; data from 50% of total tree height). This suggests that bark from Betula pendula dries faster after rainfall, which might inhibit both lichen establishment and thallus growth.
Altogether, predominance of lichen colonization on certain tree species can be explained by an interaction of multiple bark and canopy features.
Lichen abundance
Several environmental factors change systematically along the height/age gradient of the stem. For instance, pH, which tends to decrease from the top to the stem base in most tree species (Bates Reference Bates1992; Marmor et al. Reference Marmor, Tõrra, Saag and Randlane2010; Rambo Reference Rambo2010; Rasmussen et al. Reference Rasmussen, Nord-Larsen, Hansen and Hoareau2018), bark roughness, irradiation and humidity. Together these factors could define the vertical distribution of a lichen community or particular species along the stem.
The NMS ordination revealed a considerable unexplained variation in the data, which could be due to stochastic conditions such as sunspots, broken branches, bird droppings, attacks from bark-living animals and fungi, all of which may create a patchy microenvironment superposed onto the general height and age gradients in the tree.
The lichen community compositional distribution along the tree stem was only weakly related to relative height. This variable was probably affected by a more or less even distribution of lichens in general with no distinct difference between height intervals. However, this contrasts with several single-species distributions.
Vertical distribution of lichen species
In contrast to studies on standing trees, the stem disc sampling was useful because it was possible to analyze the bark at the very top of the main stem, including the bark surface too young to be visibly colonized by lichens. We have thus been able to demonstrate height distribution of certain lichen species that clearly have establishment potential on very young bark.
As a consequence of continued tree growth, the conditions at a colonization site within the tree are not static (Woods Reference Woods2017). Underneath a long-lived thallus, the bark matures and conditions change. At the time when a spore of a particular lichen species attaches and germinates, the substratum is probably more exposed and the bark younger than it appears when the thallus in question becomes fully developed. During that time, the lichen will acclimate to the changing conditions. Hence, it can be difficult to deduce a species requirements from the habitat occupied by fully grown colonies. When vertical zonation of individual lichen species along the tree stem is recorded (Kershaw Reference Kershaw1964; Harris Reference Harris1971; Fritz Reference Fritz2009; Marmor et al. Reference Marmor, Tõrra, Saag and Leppik2013), young pioneer colonies would be expected at the upper edge of the zone and senescent colonies at the lower edge (Rasmussen et al. Reference Rasmussen, Nord-Larsen, Hansen and Hoareau2018).
Parmelia sulcata has been recorded mainly above 2 m (Fritz Reference Fritz2009; Marmor et al. Reference Marmor, Tõrra, Saag and Leppik2013) and in whole-stem analyses it was found in the middle to the top of trees in a range of angiosperm species (Kershaw Reference Kershaw1964; Harris Reference Harris1971). Our records of P. sulcata showed a smooth distribution, indicating a broad tolerance range and an optimum around 50% relative height. In previous studies, Physcia tenella and Lecanora chlarotera were recorded only above 2 m (Harris Reference Harris1971; Fritz Reference Fritz2009; Marmor et al. Reference Marmor, Tõrra, Saag and Leppik2013). This information supports our modelled height distribution curves of these species.
Many species, such as Lecanora carpinea, L. chlarotera, Lecidella elaeochroma, Physcia tenella and Xanthoria parietina seem able to establish on the young, smooth bark typically found at the upper and more exposed part of the tree stem and tend to decline as the colonization site becomes more covered in foliage. These species are likely to persist in the upper parts of the crown due to short-range upward dispersal onto young shoots.
In our study, Lepraria incana was very abundant at the stem bases, which is supported by a study of similarly aged oak and conifer trees (Rasmussen et al. Reference Rasmussen, Nord-Larsen, Hansen and Hoareau2018), as well as in old beeches (Fritz Reference Fritz2009) and conifers (Marmor et al. Reference Marmor, Tõrra, Saag and Leppik2013). This implies a typical establishment site on the bole of the trees. The same might be suggested for Arthonia atra, which was found only on the very stem base of Fraxinus excelsior. However, in Wales (UK) this species has been recorded at the top of a 10 m tall Fraxinus sp. (as Opegrapha atra, Kershaw Reference Kershaw1964). According to our observations, lichens such as Lepraria incana, Arthonia atra and Pseudosagedia aenea require a protected microhabitat for establishment and are shade tolerant.
Evidence of phorophyte bias
This study suggested that some common lichen species discriminated among the seven tree species (Table 1). For instance, Lepraria incana was completely absent on Fraxinus excelsior, but had established widely on the other six tree species. In contrast, Arthonia atra was recorded only on Fraxinus excelsior.
Conclusions
Lichen diversity and species richness differed significantly among the tree species, despite all trees having the same age and density at the time of study and having been grown under homogenous conditions across a range of sites. This indicates that some tree species provide better conditions for lichen colonization. Constraints to colonization could include inhibiting bark chemistry (pH), dense crown structure, bark shedding or dry bark.
Some lichen species were differentially distributed along the tree stems and showed similar distribution patterns among the tree species, suggesting that the height distribution range in these trees is characteristic for the lichen species in question, rather than being a function of tree species. Thus, in spite of a relatively short cultivation time (in forestry terms) and regarding fairly common and generalist lichen species, the lichen community differed considerably according to tree species.
Acknowledgements
We are very grateful to the 15. Juni Fonden (Grant/award no: 2015-A-4A), who supported this study. Many thanks are due to Professor Bruce McCune, Oregon State University, USA, for assistance with data analysis. Mia Mouridsen and Guillaume Hoareau were an indispensable help in the floristic lichen analysis of the bark samples. We are also very grateful to the Knud Højgaards Foundation, Christian og Ottilia Brorsons Rejselegat, Niels Bohr Fondet and Studiefonden under Danmarks Jordbrugsvidenskabelige Ph.D.-forening for enabling a research stay for the first author at Oregon State University, USA.
Author Contribution
HNR conceived and designed the study and collected the stem disc material together with TNL. ESH was responsible for the floristic analysis of lichens. HMEL and TNL analyzed the data. HMEL, HNR and TNL wrote and revised the manuscript. ESH contributed critically to the revision.
Data Accessibility
Primary data for this study will be stored in the repository Data DOI at the University of Copenhagen.
Appendix 1
Characteristics and coordinates of the four common garden sites in Denmark, as outlined by Callesen (Reference Callesen2003) and Callesen et al. (Reference Callesen, Nilsson, Schmidt, Vesterdal, Ambus, Christensen, Högberg and Gundersen2013). T = mean annual temperature (oC), P = mean annual precipitation (mm).
Site characteristics and coordinates of the four common garden sites in Denmark

Appendix 2
Stem discs were collected at 0.75, 1.30 and 1.50 m from the ground, and above that at equidistant sample intervals (0.5, 1, 2 and 3 m) along the main stem, based on total tree height shown in brackets.
Variation in sample intervals of stem discs in relation to tree height.

Appendix 3
Illustration of a tree trunk with two sample intervals X and Y and two wood discs x´ and y´ (grey coloured). The ratio between surface area x´ and the total surface area of sample interval X is equal to the ratio between the surface areas of y´ and Y. Illustration of a tree trunk showing an equal ratio between the surveyed surface area and the total surface area of the sample intervals.

Appendix 4
The cross-validated R2 for best-fit models (xR2 > 0.1) of the height distribution of corticolous lichens across and within all tree species. The letters n.r. (no records) indicate that the lichen species was absent on the given tree species. Modelling of height distribution within each tree species did not lead to stronger correlated models. All models were based on relative heights.
The cross-validated R2 (xR2) for best-fit models of the height distribution of corticolous lichens across and within all tree species.


